

Briefly: in our opinion, full (250% of the regular size of the position) speculative short positions in gold, silver and mining stocks are justified from the risk/reward perspective at the moment of publishing this alert. We are moving the exit prices and stop-loss levels lower in case of silver.
Silver just moved to its 2018 bottom. Not somewhat above it, not relatively close to it – silver’s Friday’s close of $14.14 equals the previous lowest closing price of 2018 that was formed on September 14th. That’s not yet a breakdown, but the implications are severe.
Silver’s Move to the 2018 Bottom
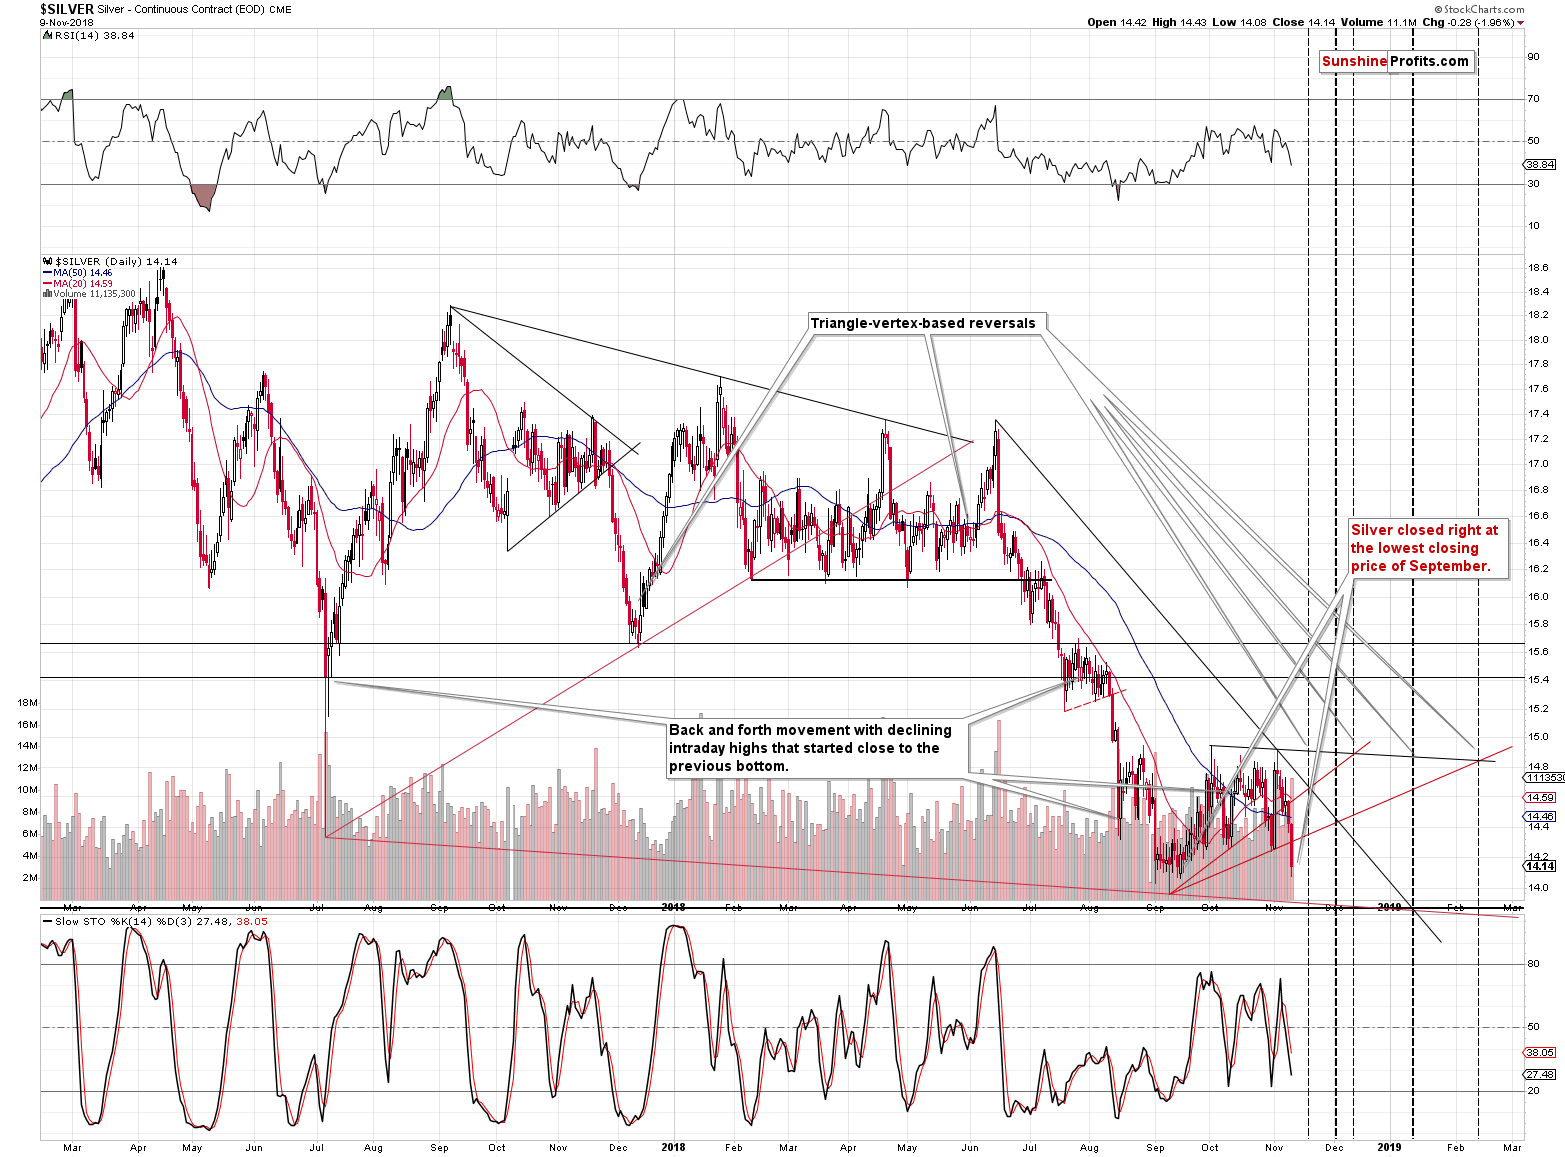
Silver’s decline means breakdowns (on big volume)below the October lows and the rising red support line.
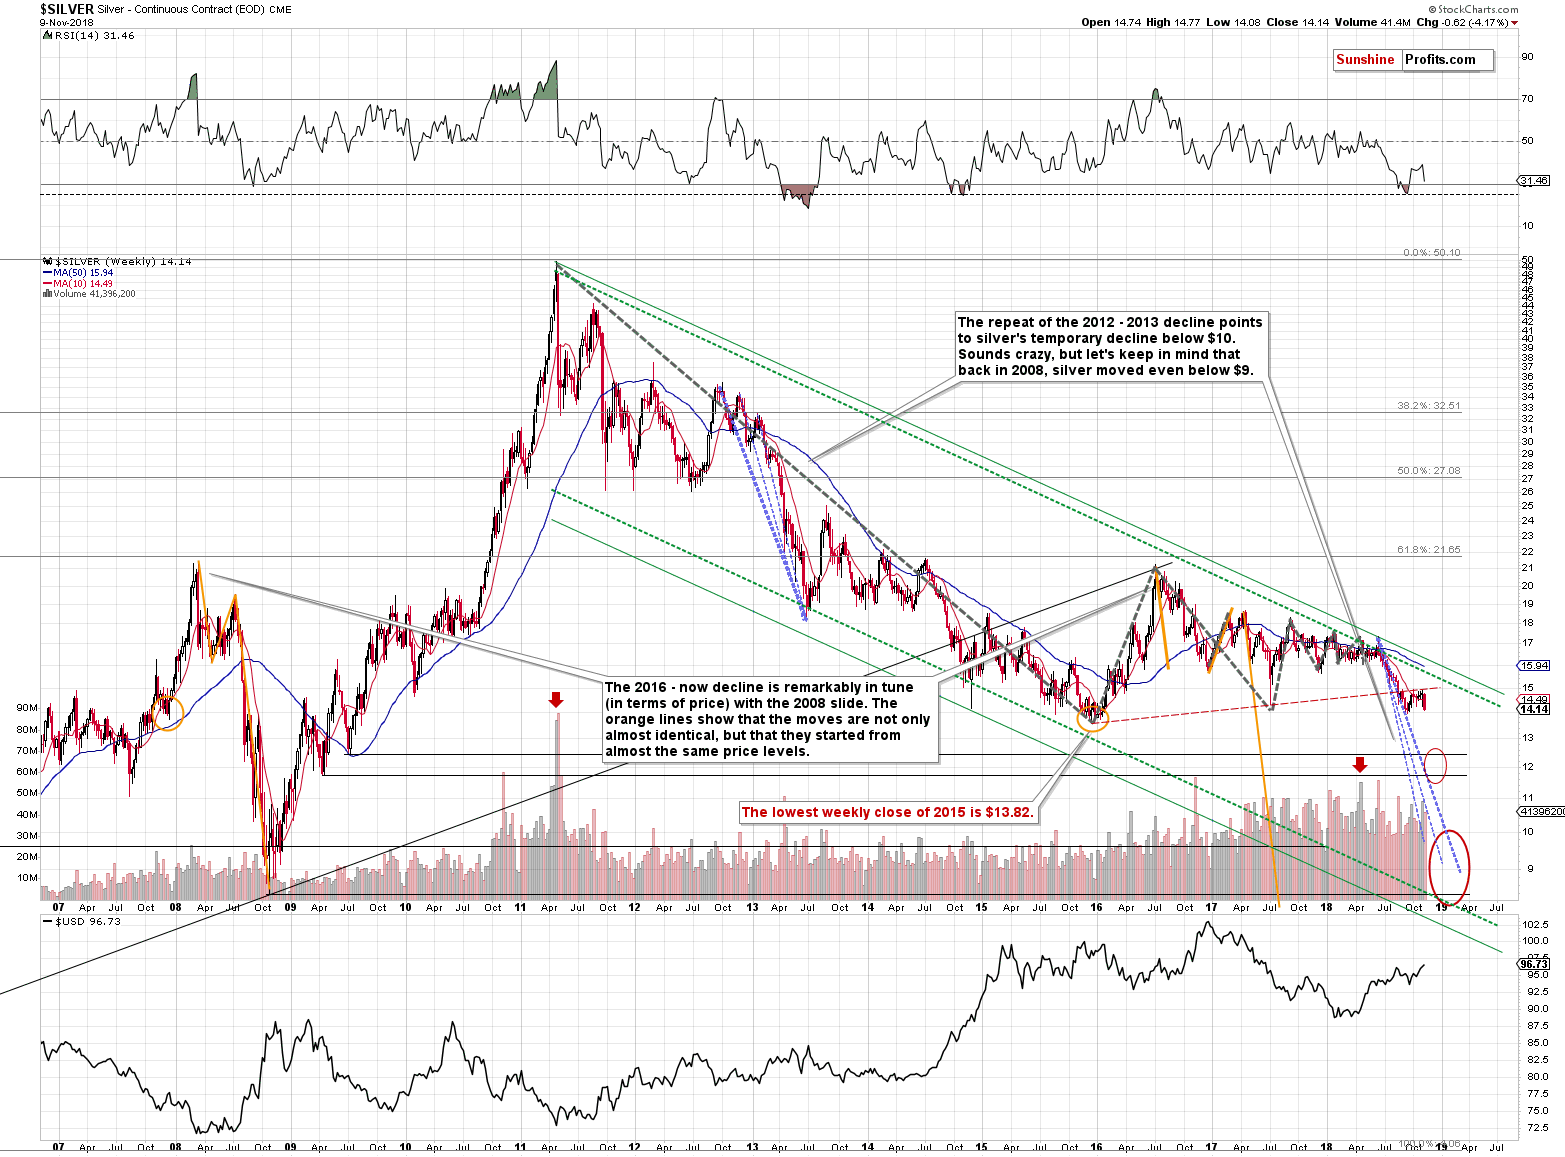
From the long-term point of view, silver seems to have already completed the post-breakdown correction and has now started its next move lower. The moves that preceded the consolidation tend to be repeated after the consolidation is completed and this means that silver is soon likely to break below its 2015 bottom.
This will be a shocking event to those, who were willing to bet the farm on the “bottom is already in” statement. This shock might – and is quite likely to – turn into panic and sharp selling as investors want to limit their losses. The support that is relatively far below the 2015 low and at the same time approximately corresponds to the size of the preceding decline is the area around the $12 level. That’s where we have two 2009 bottoms. None of them is extremely important, but they are the only ones that we have between the 2015 bottom and the 2008 bottom, so they are quite likely to provide temporary support.
Another reason why Friday’s move is so important is the situation in the gold to silver ratio.
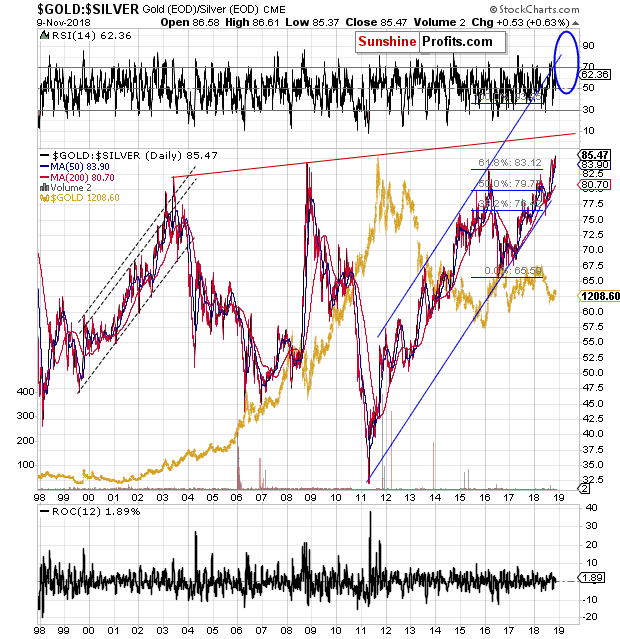
With a weekly close above 85, it’s clear that the ratio broke above the previous long-term highs. The next long-term target is the rising red line that’s approximately at the 90 level and the final one is at about 100. Interestingly, with gold at about $1,050 and the ratio at 90, we get $11.67 as the silver price prediction, which is very close to the April 2009 low (the lower one), which is $11.72. The above further validates the interim price target area (around $12) for the white metal.
Gold’s Sell Signals
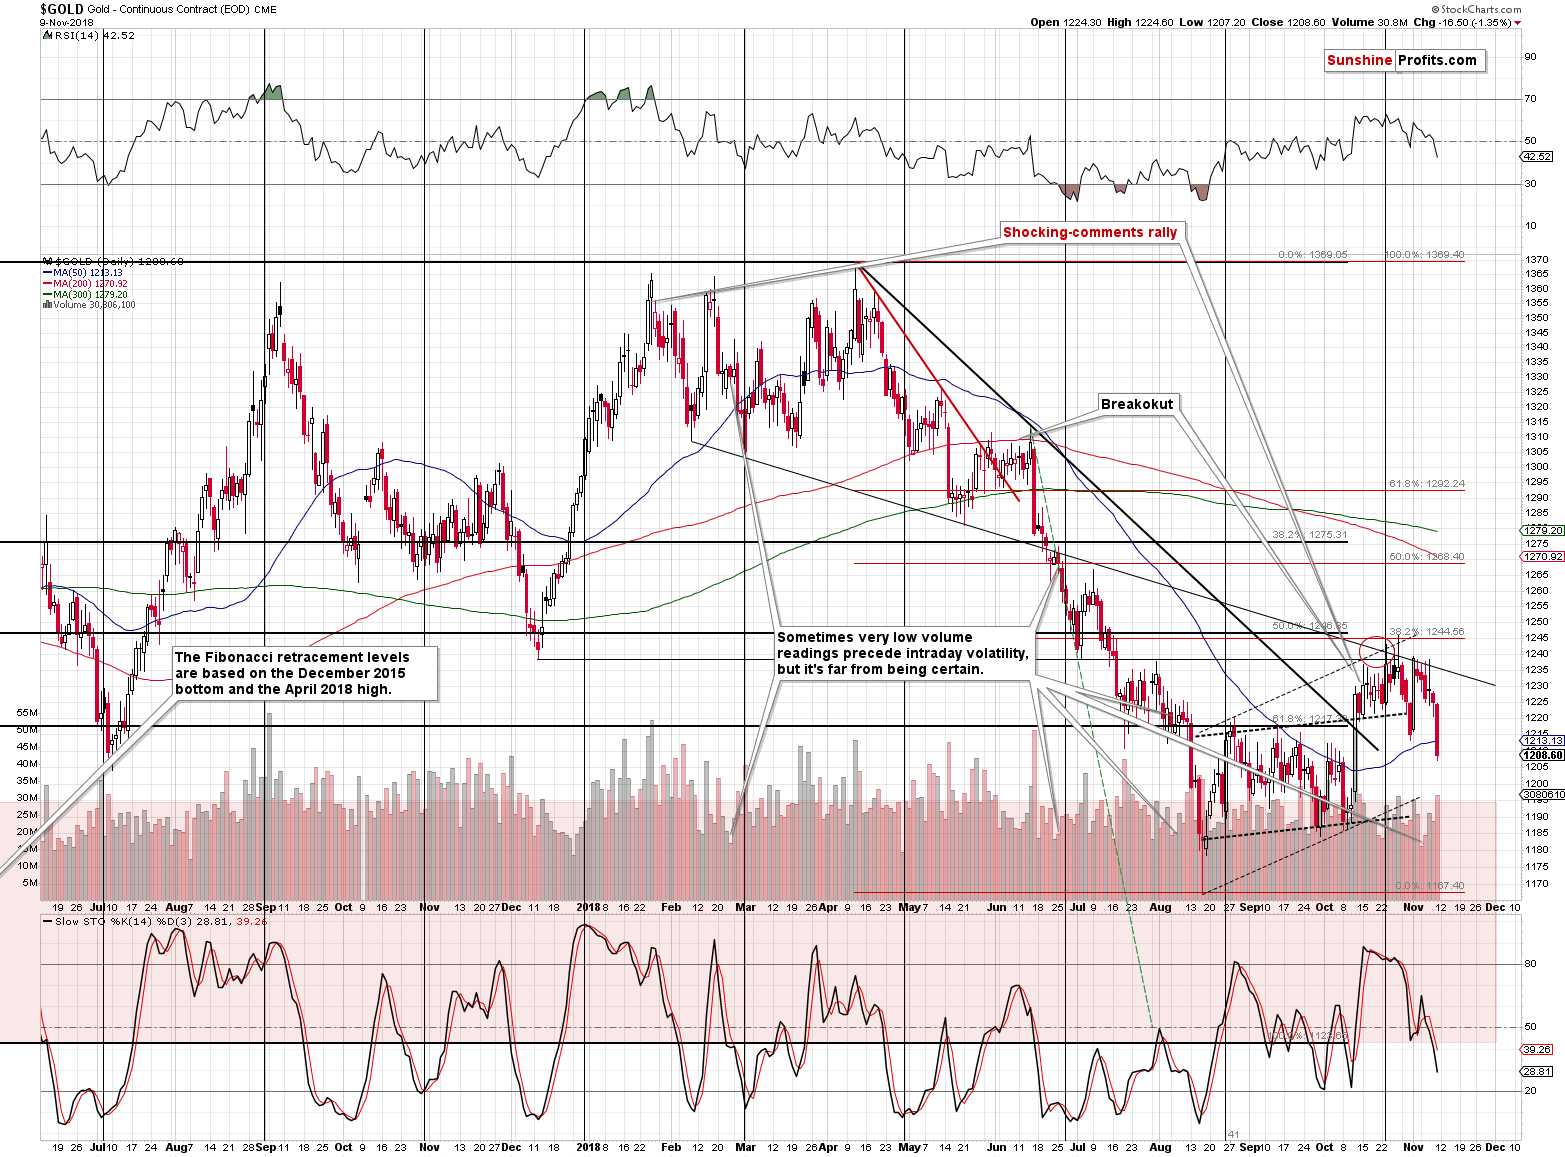
Gold didn’t move to its 2018 lows just yet, but it closed the week below the 50-day moving average and the slide below this level took place on relatively big volume. The implications are bearish.
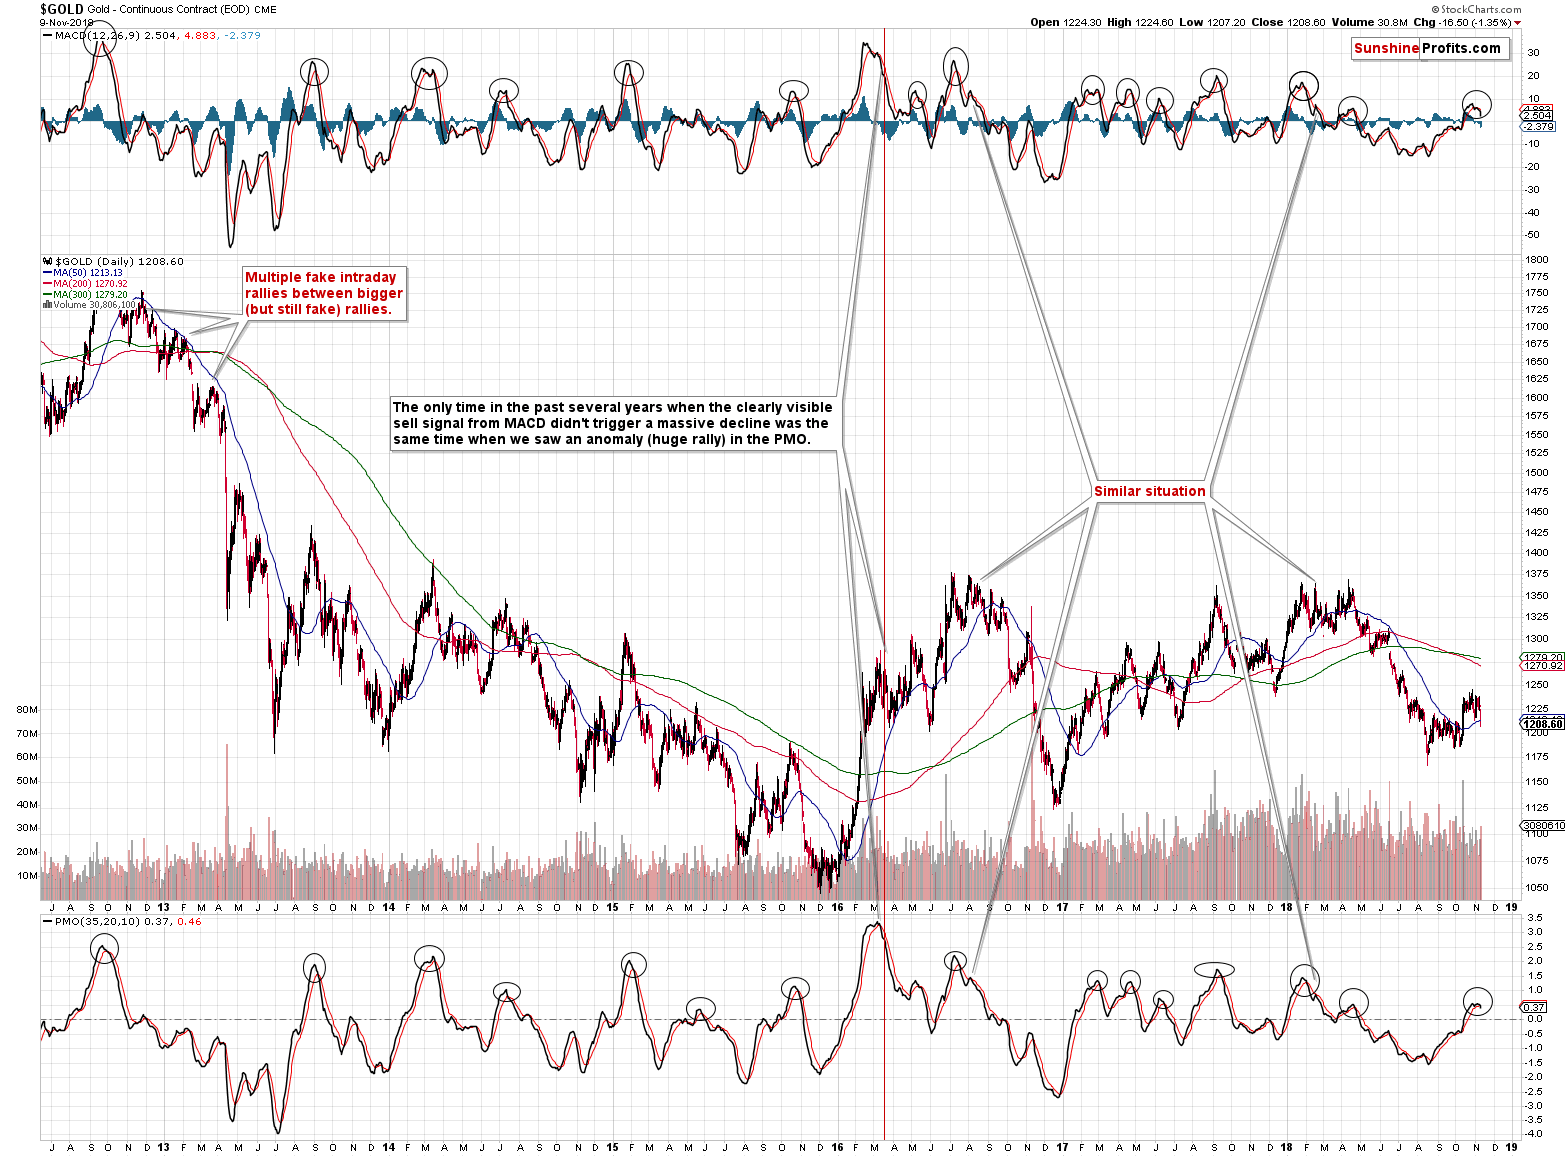
Moreover, we just saw 2 very effective sell signals: from the MACD and from the PMO indicators. On the above chart we marked similar signals with black ellipses. As you can see almost all of them were followed by significant declines. The implications are clearly bearish for the following days and weeks.
Speaking of indicators, we also saw a major sell signal from the weekly perspective.
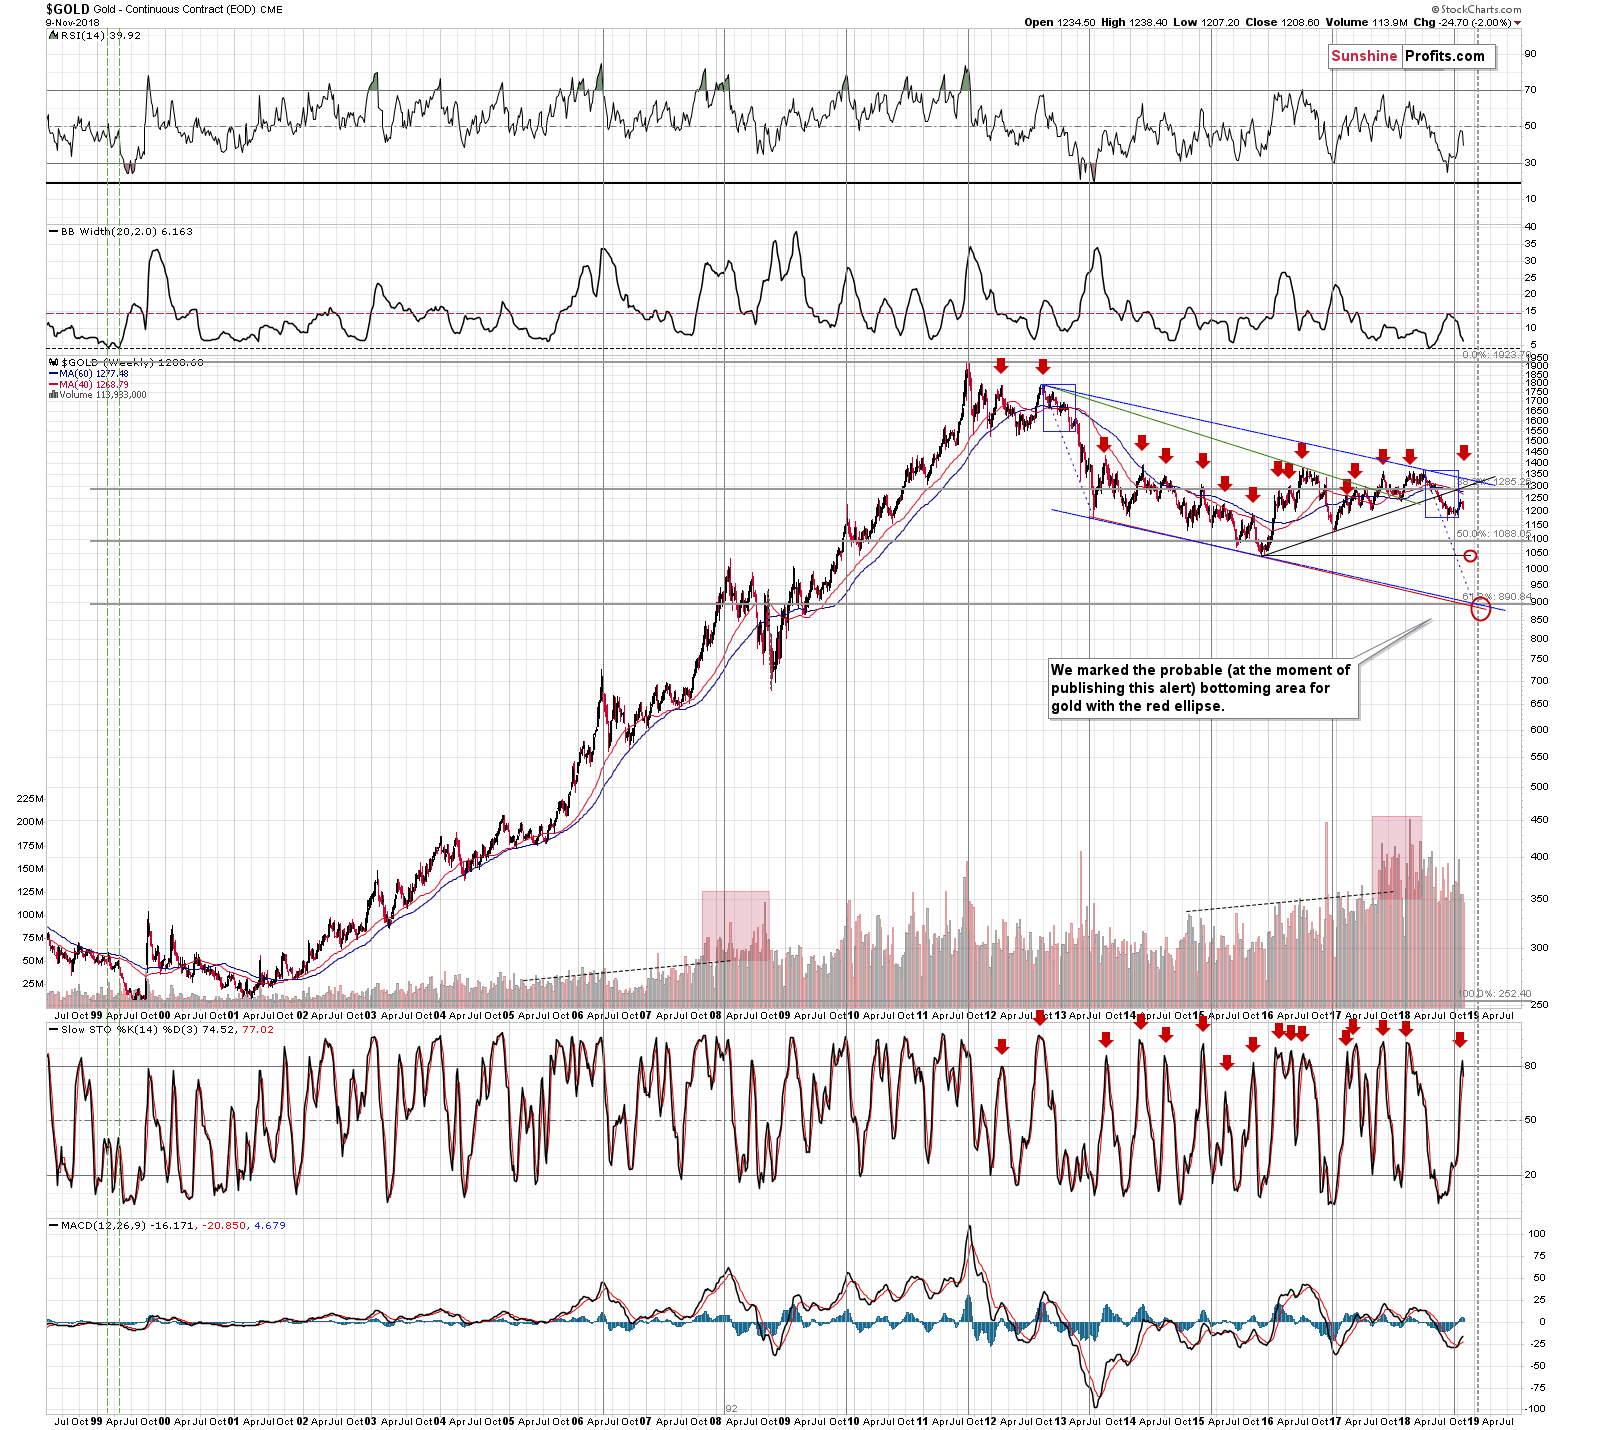
The bottom part of the gold chart (based on weekly candlesticks, thus we call it “weekly”) features the Stochastic indicator. Its weekly version has been particularly useful for predicting sizable declines, especially when the sell signal flashed above the 80 level. And this was just the case. The implications are very bearish and it appears that the consolidation is over.
Gold Stocks’ Critical Indication
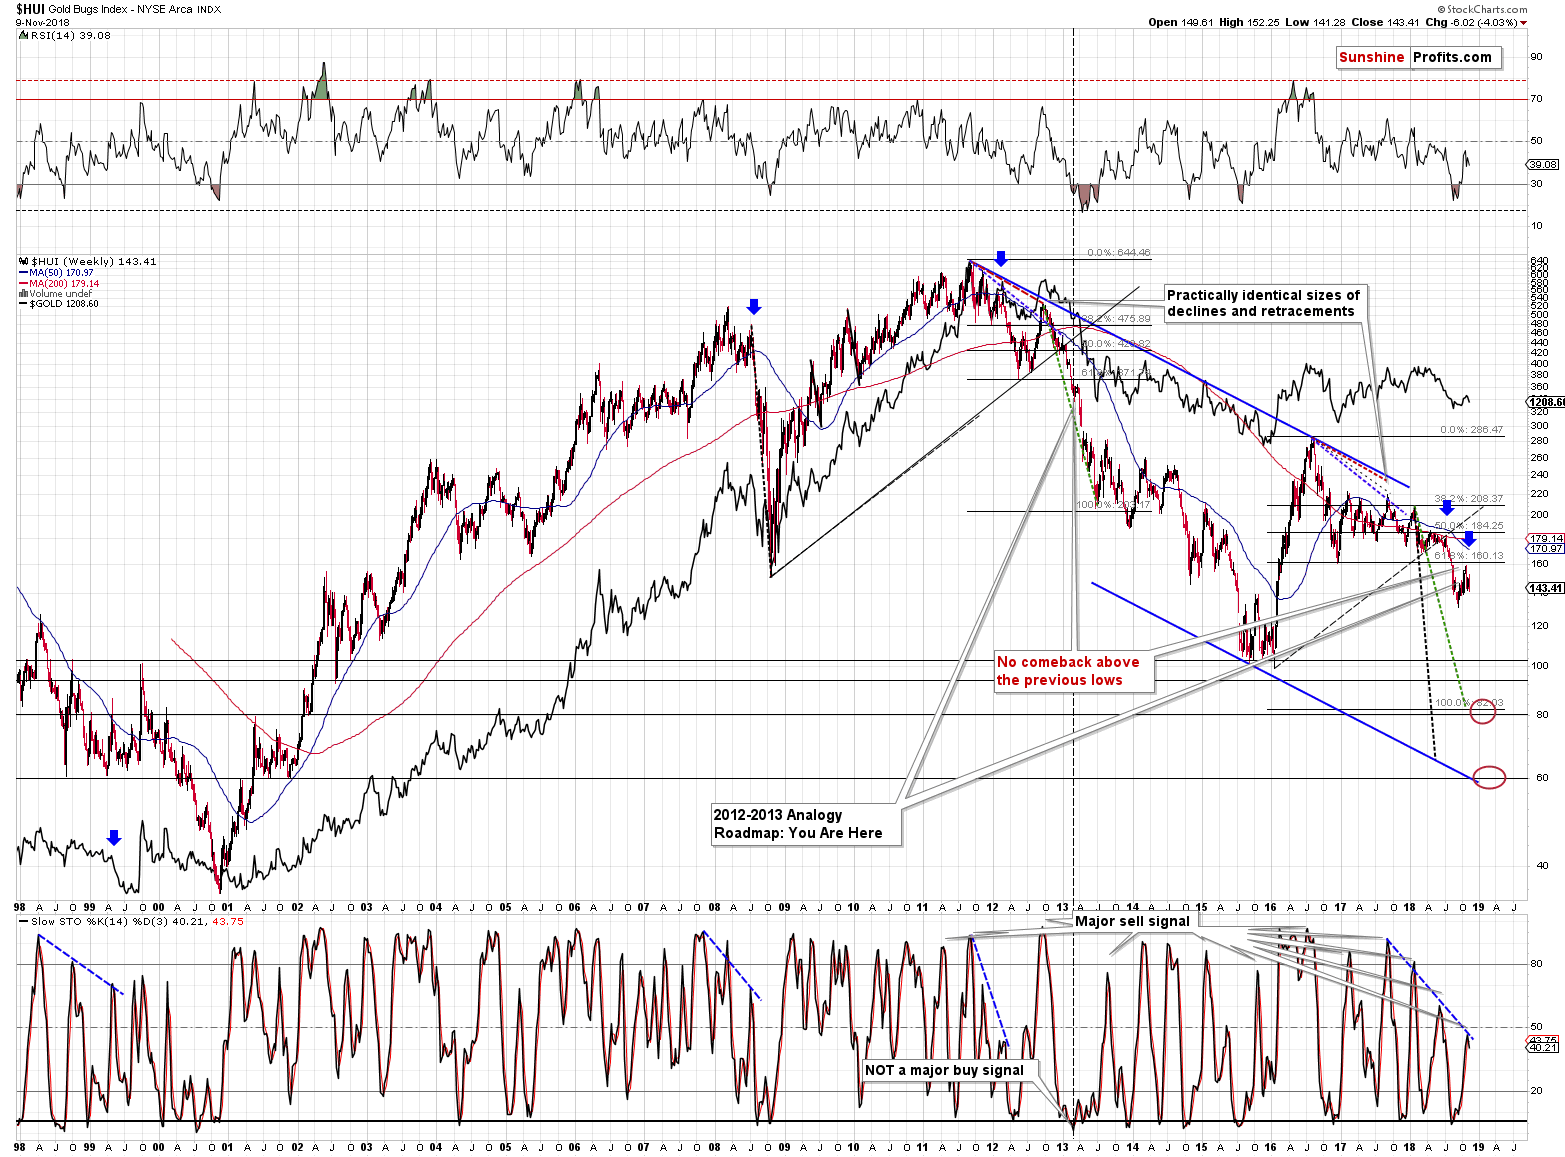
Speaking of the important weekly sign from the Stochastic indicator, it’s absolutely necessary to mention this signal in the HUI Index. In our Thursday’s Alert, we wrote the following:
The week is not over yet, so it’s too early to say that this will be the case with 100% certainty, but unless the HUI Index rallies strongly, we will most likely get a sell signal from the weekly Stochastic indicator. This is a big deal, because this indicator confirmed major tops and preceded big price declines many times in the recent past. The signal has been particularly useful since 2011.
The other interesting thing is that we saw lower highs in the past several months and this is characteristic only for the biggest of the declines. We saw this kind of performance of the weekly Stochastic indicator in 1999, in 2008, and in 2012. The last two were obviously excellent times to exit the precious metals market, but the first one appears to be different.
And it was different, but not because of the regular factors. It was the Washington Agreement on Gold that caused gold to spike in 1999, taking the rest of the PM market with it. If it wasn’t for this spike, we would have likely seen a bottom in gold quite similar to what we saw in the gold stocks. The latter declined in a profound manner right after the spike. Consequently, if it wasn’t for the Washington Agreement, the precious metals sector would have most likely declined in a rather regular manner after the above-mentioned series of signals from the weekly Stochastic indicator.
Therefore, it seems justified to say that all 3 previous cases that are similar to what we see right now, have been followed by the biggest declines of the past 20 years.
Well, the week is over now and we see that the above has indeed taken place. The major sell signal from the Stochastic and the analogy based on it are now in place and the implications are extremely bearish.
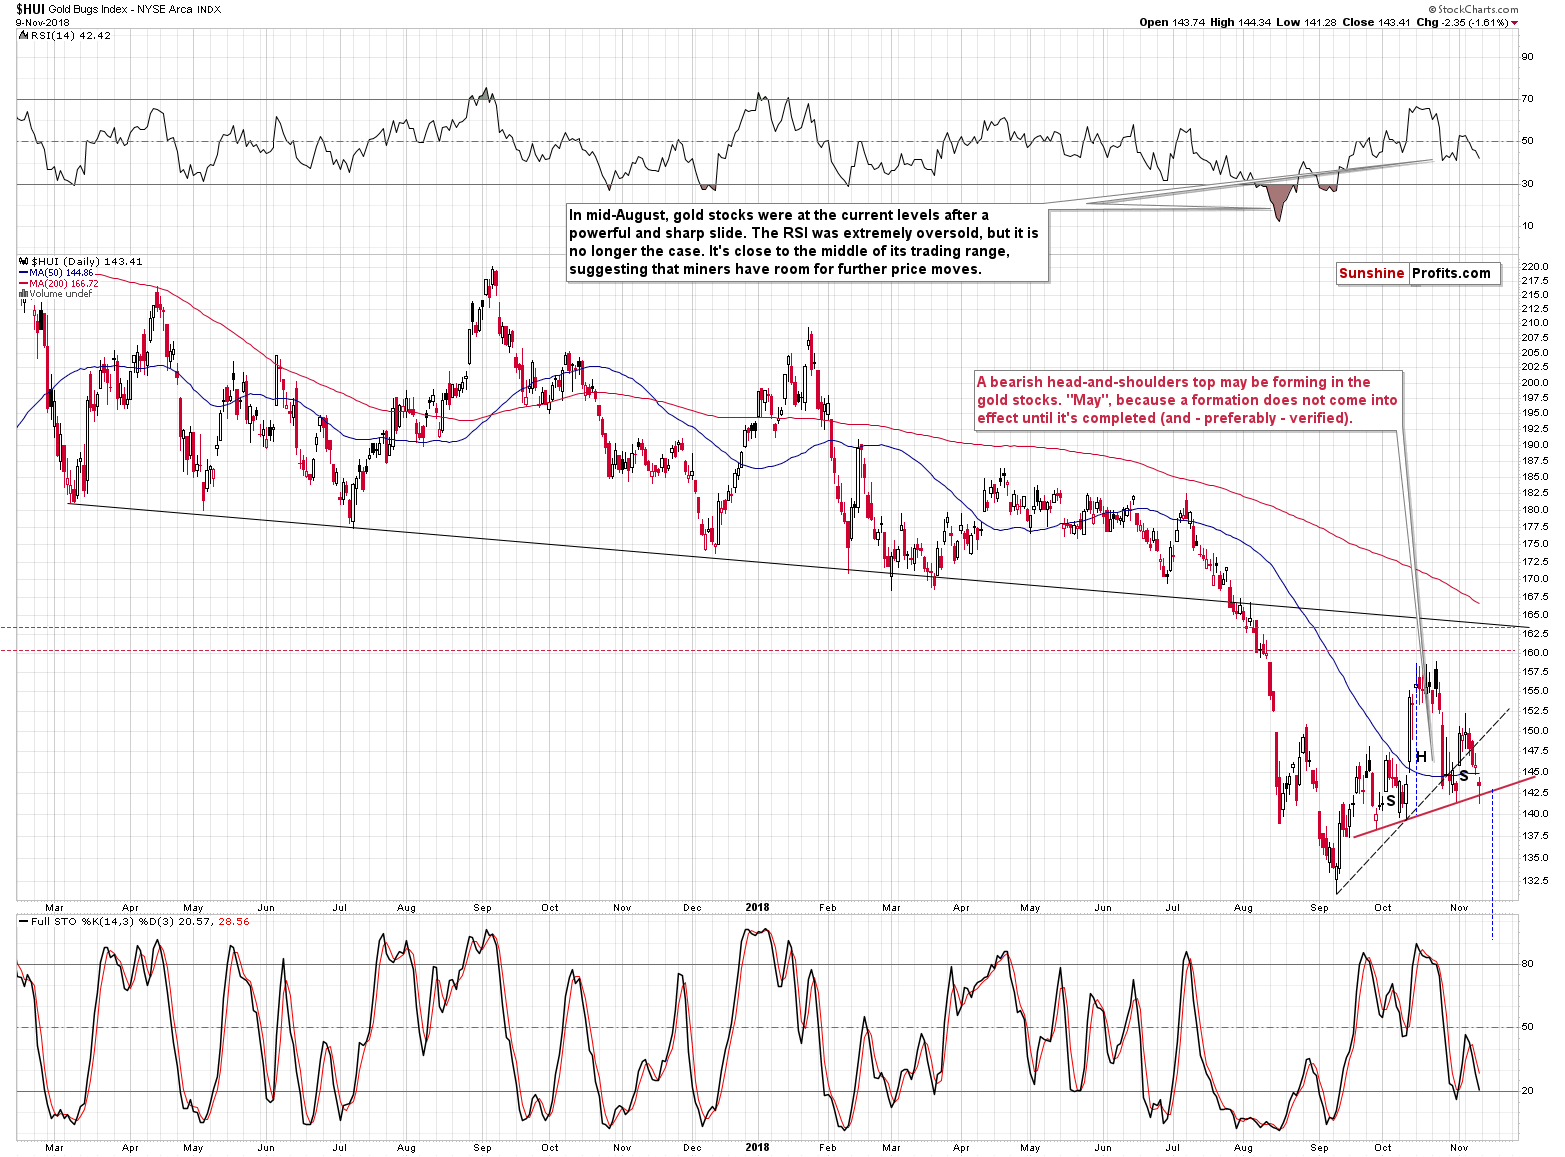
From the short-term point of view, we see that the mining stocks moved visibly lower but that they haven’t completed the bearish head-and-shoulders formation just yet. Therefore, there are no implications of this formation just yet, but based on the signals that we discussed previously today, it seems that the breakdown below the neck level is just around the corner and thus that the short-term outlook will become very bearish shortly.
To be clear, it’s already bearish at this time and the latest confirmation of the outlook comes from the confirmation of the breakdown below the rising dashed support line. The HUI Index moved visibly below it and closed below it for three consecutive trading days.
Finally, let’s take a look at what happened in the USD Index.
USD’s Bullish Outlook
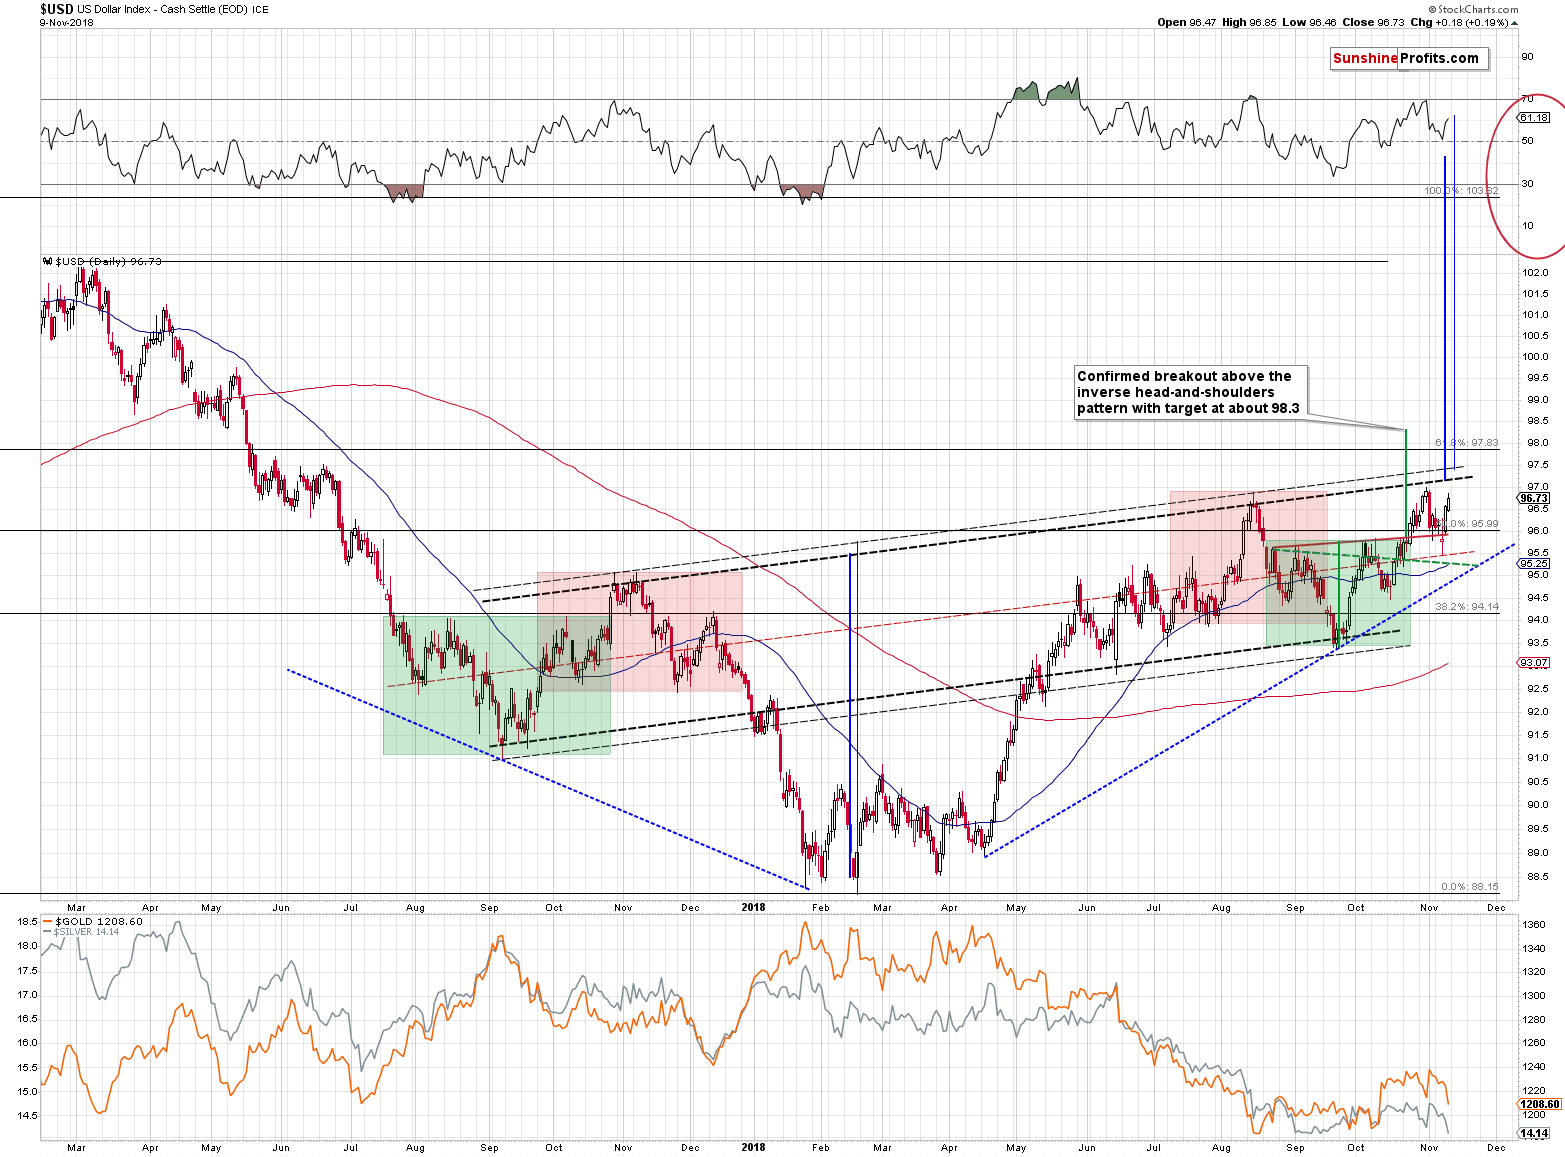
In Friday’s Alert, we wrote the following:
The USD moved higher after a very brief move back to the middle of its rising trading range that we marked with a red dashed line. It’s worth noting, because something similar happened in early August 2017 and since this year’s rally is the reflection of last year’s decline, it could mean that this was the bottom and that higher values of the USD Index will follow. The outlook for the medium term has been bullish for a long time, but this time it finally seems that the multi-month consolidation is over. The implications are very bearish for the precious metals sector.
The above remains up-to-date, but we would like to add one more thing. On October 31st, we wrote that gold’s relative strength to the USD Index is likely coming to an end and that this tendency is likely to be reversed. This is what is taking place right now. The USD Index is close to its mid-August high and gold is not yet close to its mid-August low, but silver is already below its mid-August low. On the short-term basis, the comeback is even clearer as its visible in both precious metals. The USD Index is not yet above its late-October high, but both: gold and silver are below their respective October lows. The implications are very bearish for the precious metals sector, especially that the outlook for the USD Index is bullish.
Important Analyses
Before summarizing, we would like to emphasize that we have recently posted several analyses that are very important and that one should keep in mind, especially in the next several weeks. If you haven’t had the chance of reading them previously, we encourage you to do so today:
- Dear Gold Investor - Letters from 2013 - Analogy to 2013, which should make it easier to trade the upcoming sizable upswing (if enough factors point to it, that is) and to enter the market close to the final bottom.
- Gold to Soar Above $6,000 - discussion of gold’s long-term upside target of $6,000.
- Preparing for THE Bottom in Gold: Part 6 – What to Buy - extremely important analysis of the portfolio structure for the next huge, multi-year rally in the precious metals.
- Preparing for THE Bottom in Gold: Part 7 – Buy-and-hold on Steroids - description of a strategy dedicated to significantly boosting one’s long-term investment returns while staying invested in the PM sector.
- Gold’s Downside Target, Upcoming Rebound, and Miners’ Buy Plan - details regarding the shape of the following price moves, a buying plan for mining stocks, and a brief discussion of the final price targets for the current decline.
- Gold: What Happened vs. What Changed - discussion of the latest extreme readings from gold’s CoT report
- Key Factors for Gold & Silver Investors - discussion of key, long-term factors that support the bearish outlook for PMs. We are often asked what makes us so bearish – this article is a reply to this question.
- The Upcoming Silver Surprise - two sets of price targets for gold, silver and mining stocks: the initial and the final one.
- Precious Metals Sector: It’s 2013 All Over Again - comparison between 2013 and 2018 throughout the precious metals sector, the general stock market and the USD Index. Multiple similarities point to the repeat of a 2013-style volatile decline in the PMs.
- Changing One's Mind - Why, When, and How – discussing the way of analyzing the market that helps to stay focused on growing one’s capital while not being influenced by the loss aversion bias. This essay might be particularly useful in light of the recent upswing in the PMs.
- Inverse H&S Patterns and Something Even More Extreme - gold targets for the current decline in terms of price and time.
Summary
Summing up, the outlook remains strongly bearish for the precious metals sector and the new long-term and short-term sell signals confirm it. There is a huge opportunity in taking advantage of the upcoming slide and then taking on big positions close to the final bottom, when others will be too scared to do so. It seems that another big decline in gold, silver and mining stocks has just begun and that the huge profits on our short positions will become enormous shortly.
We are adjusting the exit prices and stop-loss levels for silver and it seems that it will both: move a bit lower than we originally thought and that it will not move higher shortly.
As always, we’ll keep you – our subscribers – informed.
To summarize:
Trading capital (supplementary part of the portfolio; our opinion): Full short positions (250% of the full position) in gold, silver and mining stocks are justified from the risk/reward perspective with the following stop-loss orders and exit profit-take price levels:
- Gold: profit-take exit price: $1,062; stop-loss: $1,257; initial target price for the DGLD ETN: $82.96; stop-loss for the DGLD ETN $49.27
- Silver: profit-take exit price: $12.32; stop-loss: $15.11; initial target price for the DSLV ETN: $47.67; stop-loss for the DSLV ETN $28.37
- Mining stocks (price levels for the GDX ETF): profit-take exit price: $13.12; stop-loss: $20.83; initial target price for the DUST ETF: $80.97; stop-loss for the DUST ETF $27.67
Note: the above is a specific preparation for a possible sudden price drop, it does not reflect the most likely outcome. You will find a more detailed explanation in our August 1 Alert. In case one wants to bet on junior mining stocks’ prices (we do not suggest doing so – we think senior mining stocks are more predictable in the case of short-term trades – if one wants to do it anyway, we provide the details), here are the stop-loss details and target prices:
- GDXJ ETF: profit-take exit price: $17.52; stop-loss: $31.23
- JDST ETF: initial target price: $154.97 stop-loss: $51.78
Long-term capital (core part of the portfolio; our opinion): No positions (in other words: cash)
Insurance capital (core part of the portfolio; our opinion): Full position
Important Details for New Subscribers
Whether you already subscribed or not, we encourage you to find out how to make the most of our alerts and read our replies to the most common alert-and-gold-trading-related-questions.
Please note that the in the trading section we describe the situation for the day that the alert is posted. In other words, it we are writing about a speculative position, it means that it is up-to-date on the day it was posted. We are also featuring the initial target prices, so that you can decide whether keeping a position on a given day is something that is in tune with your approach (some moves are too small for medium-term traders and some might appear too big for day-traders).
Plus, you might want to read why our stop-loss orders are usually relatively far from the current price.
Please note that a full position doesn’t mean using all of the capital for a given trade. You will find details on our thoughts on gold portfolio structuring in the Key Insights section on our website.
As a reminder – “initial target price” means exactly that – an “initial” one, it’s not a price level at which we suggest closing positions. If this becomes the case (like it did in the previous trade) we will refer to these levels as levels of exit orders (exactly as we’ve done previously). Stop-loss levels, however, are naturally not “initial”, but something that, in our opinion, might be entered as an order.
Since it is impossible to synchronize target prices and stop-loss levels for all the ETFs and ETNs with the main markets that we provide these levels for (gold, silver and mining stocks – the GDX ETF), the stop-loss levels and target prices for other ETNs and ETF (among other: UGLD, DGLD, USLV, DSLV, NUGT, DUST, JNUG, JDST) are provided as supplementary, and not as “final”. This means that if a stop-loss or a target level is reached for any of the “additional instruments” (DGLD for instance), but not for the “main instrument” (gold in this case), we will view positions in both gold and DGLD as still open and the stop-loss for DGLD would have to be moved lower. On the other hand, if gold moves to a stop-loss level but DGLD doesn’t, then we will view both positions (in gold and DGLD) as closed. In other words, since it’s not possible to be 100% certain that each related instrument moves to a given level when the underlying instrument does, we can’t provide levels that would be binding. The levels that we do provide are our best estimate of the levels that will correspond to the levels in the underlying assets, but it will be the underlying assets that one will need to focus on regarding the signs pointing to closing a given position or keeping it open. We might adjust the levels in the “additional instruments” without adjusting the levels in the “main instruments”, which will simply mean that we have improved our estimation of these levels, not that we changed our outlook on the markets. We are already working on a tool that would update these levels on a daily basis for the most popular ETFs, ETNs and individual mining stocks.
Our preferred ways to invest in and to trade gold along with the reasoning can be found in the how to buy gold section. Additionally, our preferred ETFs and ETNs can be found in our Gold & Silver ETF Ranking.
As a reminder, Gold & Silver Trading Alerts are posted before or on each trading day (we usually post them before the opening bell, but we don't promise doing that each day). If there's anything urgent, we will send you an additional small alert before posting the main one.
=====
Latest Free Trading Alerts:
Friday's trading session was bearish, as investors were taking profits off the table following the recent advance. The S&P 500 index got back below the level of 2,800. Is this a downward reversal or just some quick downward correction within a new uptrend?
S&P 500 Below 2,800 Again, New Downtrend or Just Correction?
The recent period of sideways trading may make traders impatient or even discouraged altogether. At any rate, those who crave more action in Bitcoin could be driven out of the market. But this is no time to bet on Bitcoin staying docile.
One Direction More Likely for Bitcoin
=====
Thank you.
Sincerely,
Przemyslaw Radomski, CFA
Editor-in-chief, Gold & Silver Fund Manager
Gold & Silver Trading Alerts
Forex Trading Alerts
Oil Investment Updates
Oil Trading Alerts

