

Briefly: In our opinion, full (150% of the regular full position) speculative short positions in gold, silver and mining stocks are justified from the risk/reward perspective at the moment of publishing this alert.
The biggest event of yesterday’s session was the Draghi-induced rally in the euro and the decline in the USD Index. The latter broke below the declining support line in a profound manner – what are the implications of this decline for the index and for the precious metals market?
Let’s take a look at the charts, starting with the USD Index (chart courtesy of http://stockcharts.com).
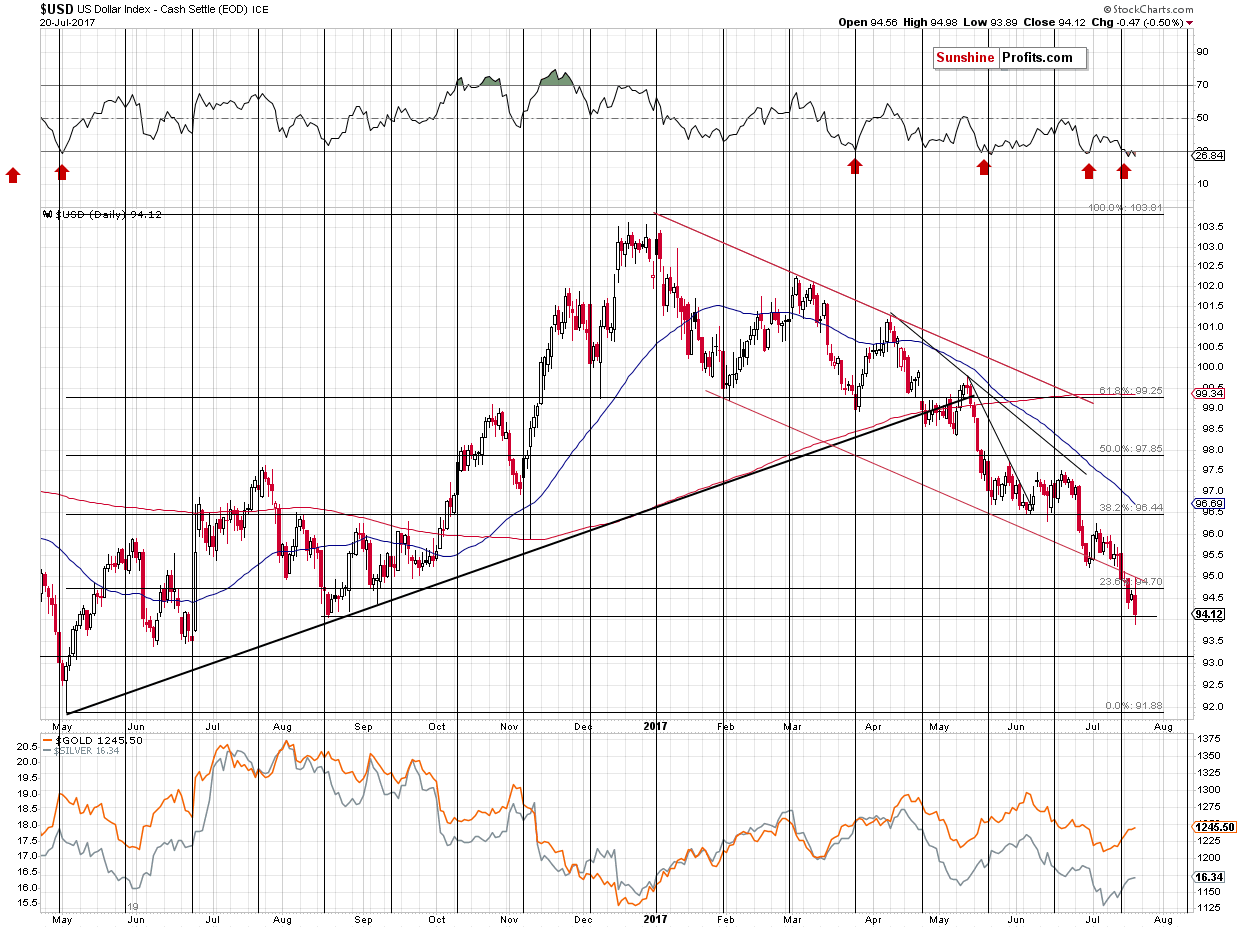
The USD Index broke below the declining red support line, the 23.8% Fibonacci retracement and was stopped by the August 2016 low. The breakdown itself appears bearish, because the USD not only moved below the declining support line, but also verified the breakdown by moving back to it and then declining once again.
The August 2016 low or the June 2016 could stop the decline, but for now (we will discuss the long-term implications of the recent USD action in the following alerts), let’s discuss what is likely to happen if the short-term downtrend in the USD Index was to continue in the following days.
Speaking of last year’s August low – please note that at that time gold was trading at about $1,350. Even though the USD Index is currently trading at the same price levels, gold was trading about $100 higher and silver was about $3.50 higher. Over time, gold and silver declined without the USD’s help.
Moving back to the current trend, let’s keep in mind that no market can move for long in a straight line up or down and there will be periodical corrections. Even within this short-term decline in the USD, there were corrective upswings. Let’s take a look at the most recent ones (one at the beginning of June and the second one at the end of June and the very beginning of July).
The USD Index moved higher by about an index point in each case – it turned out none of these rallies marked the end of the decline, but, the key question is how did the precious metals market reacted to these events. At the beginning of June, gold and silver declined substantially, then rallied back up a little when the USD resumed its downtrend, then declined again at the end of the June and it’s now moving back up as the USD continues to slide. Overall, however, gold is reacting strongly to the USD’s strength, even if it’s something temporary and relatively small, but it is reacting in a limited way to the USD’s short-term declines, even if they are significant. Overall, gold and silver remain in a downtrend even though the same thing is the case with the USD Index.
This means two things. Firstly, even if the short-term decline in the USD Index continues for some time, it will still be likely to be interrupted by corrective upswings, which will likely (just like was the case before) trigger bigger declines in the precious metals market – bigger than the preceding rallies.
Secondly, as soon as the USD Index forms the final bottom, and a big rally starts, gold and silver are likely to truly plunge – the size and sharpness of the decline in such a situation could be very significant.
Both things have one big implication for the precious metals investors – we could see either small rallies, or sizable declines, or enormous declines. This is a situation in which short positions appear appealing, not long ones.
Is there anything else that could point us to this direction besides the USD Index chart and comparing it to gold and silver prices? Yes.
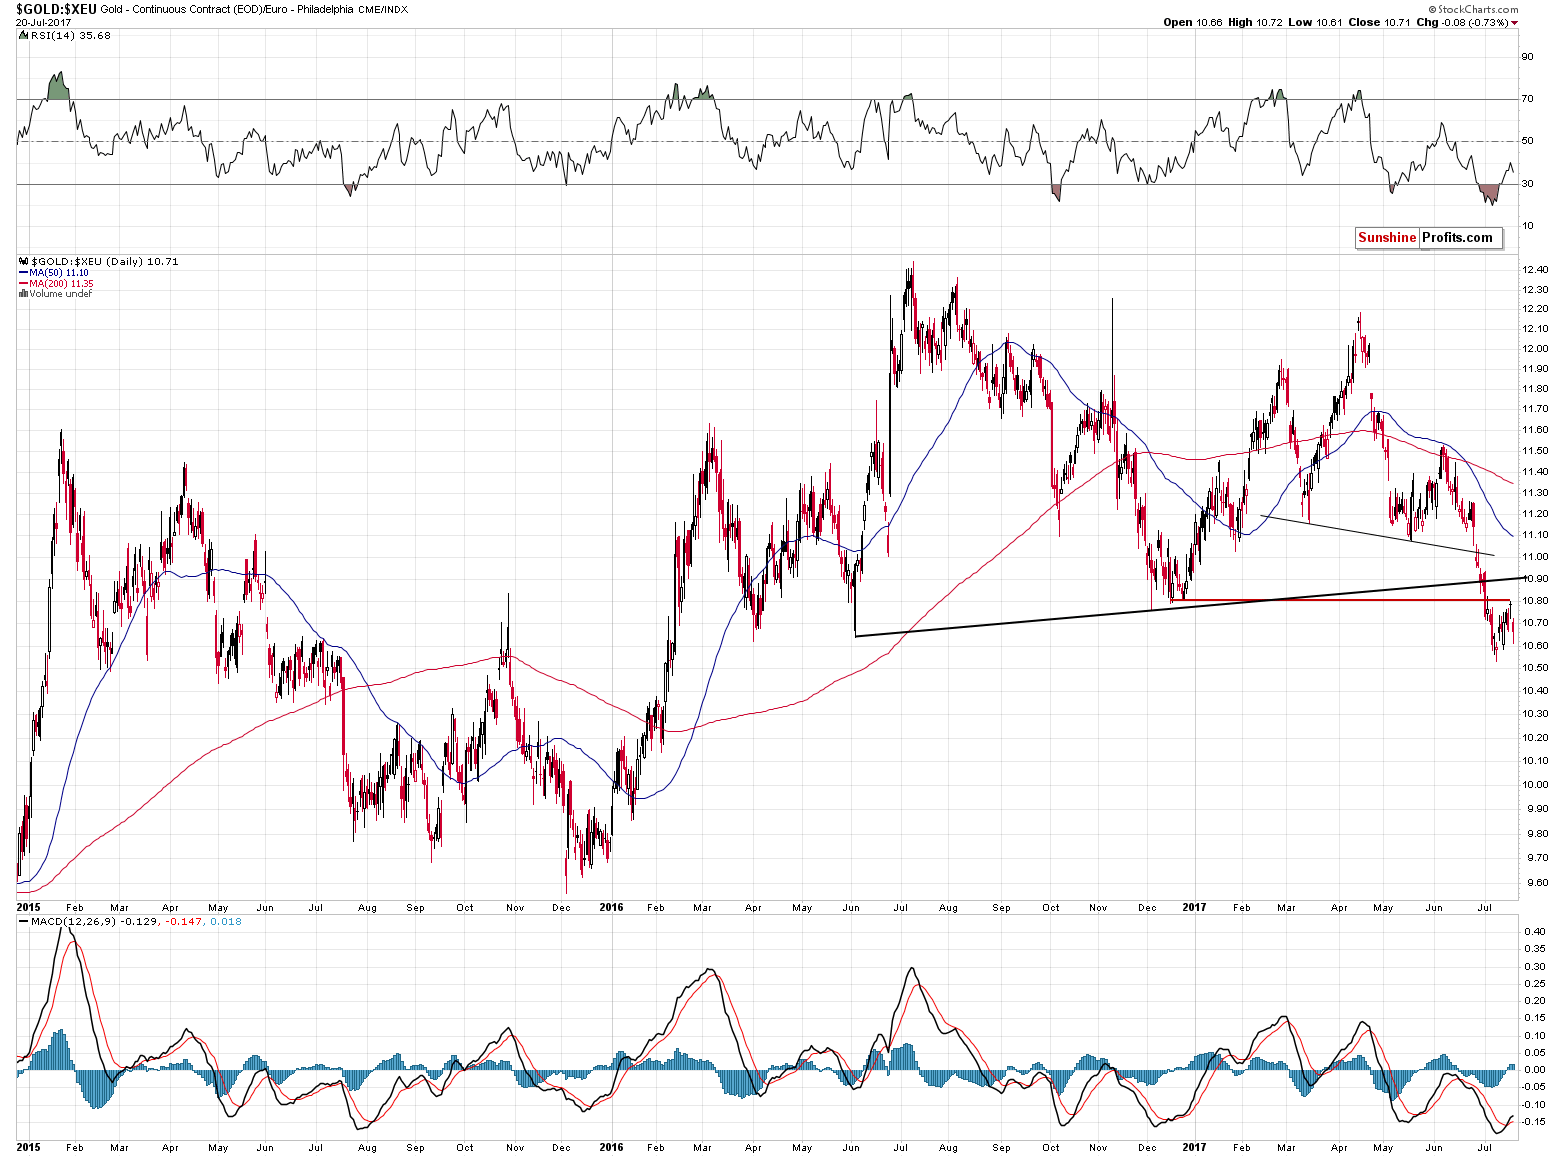
Gold priced in the euro has just verified its breakdown below the December 2016 low. The slide is now likely to continue. This means that gold’s underperformance relative to the USD Index is likely to continue and we could even see both decline simultaneously. That’s yet another reason for one not to view the decline in the USD Index as something significantly bearish.
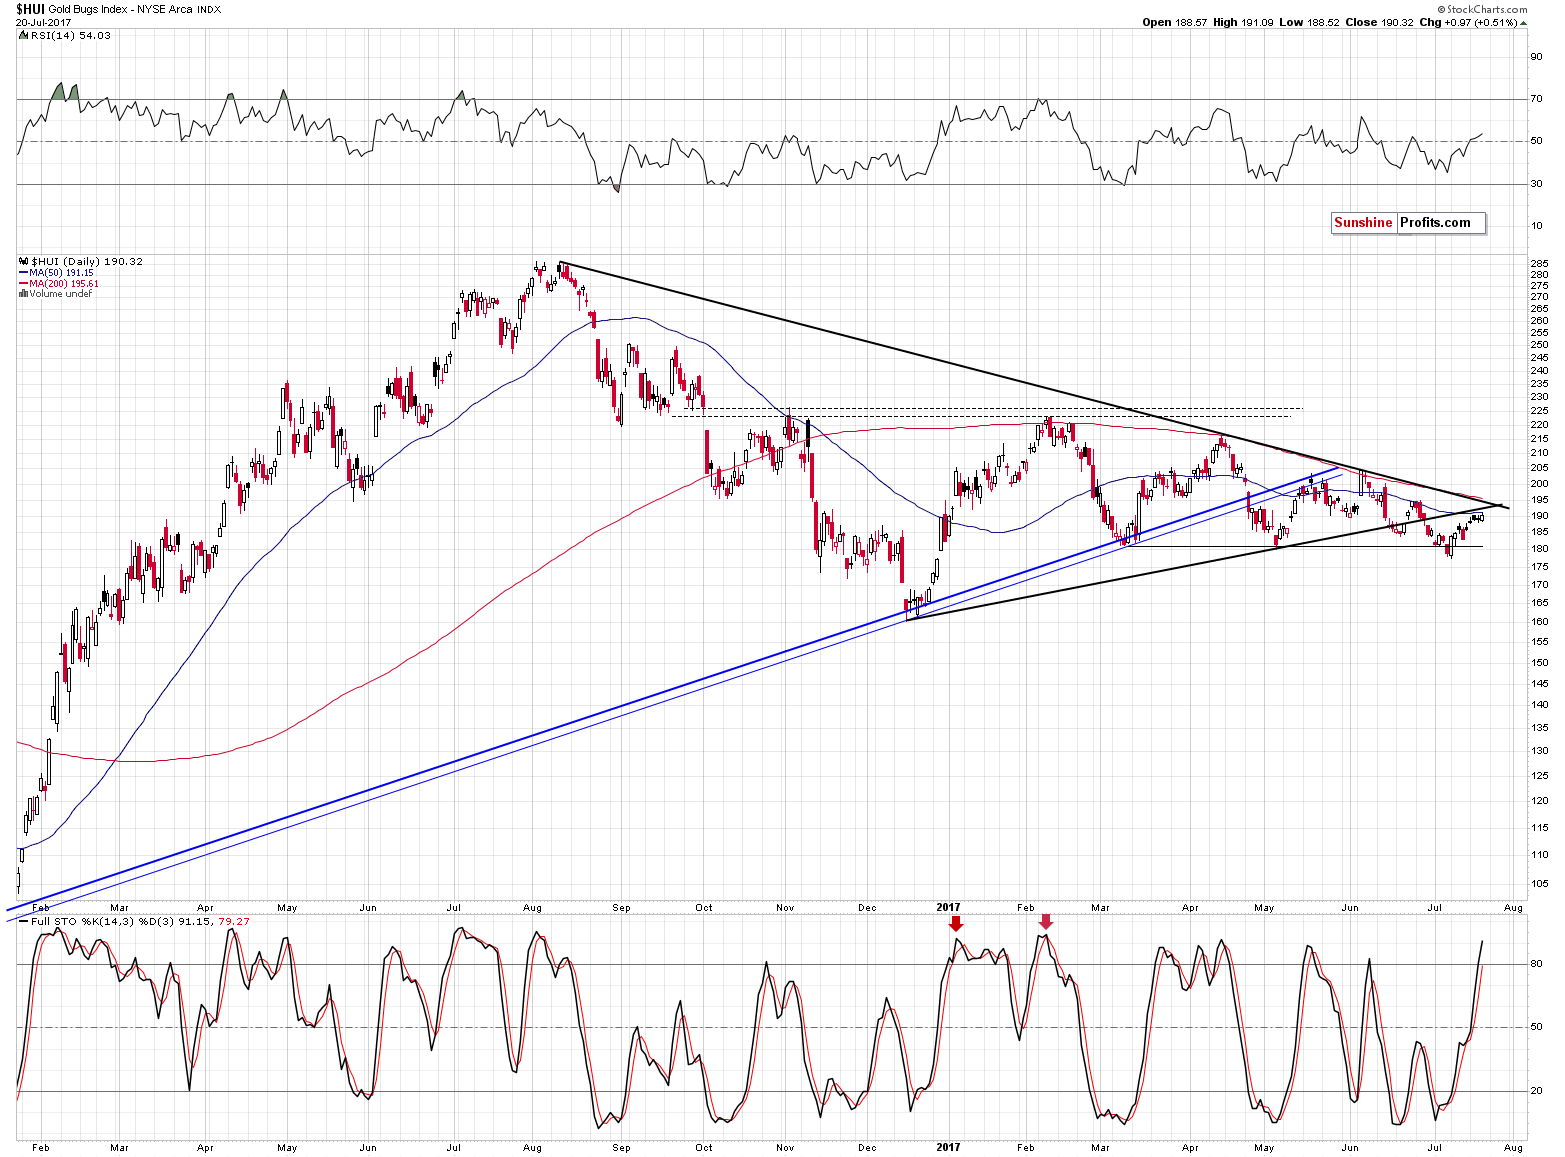
The gold stocks’ reaction to yesterday’s decline in the USD and gold’s upswing was once again very weak. If a market doesn’t want to move in the way it “should” given what’s taking place in the case of its drivers (and there’s no doubt that the price of gold is the key driver behind gold stocks’ profits and thus prices), it is a strong indication that the market wants to move in the opposite direction and it’s waiting for a trigger.
For now, the trigger is absent as the USD Index continues to decline – however, the point is that since the USD Index is likely to reverse eventually which is likely to translate into a big plunge in miners and until it does… Miners don’t seem to be going anywhere. The nothing-or-big-decline situation is naturally a bearish one.
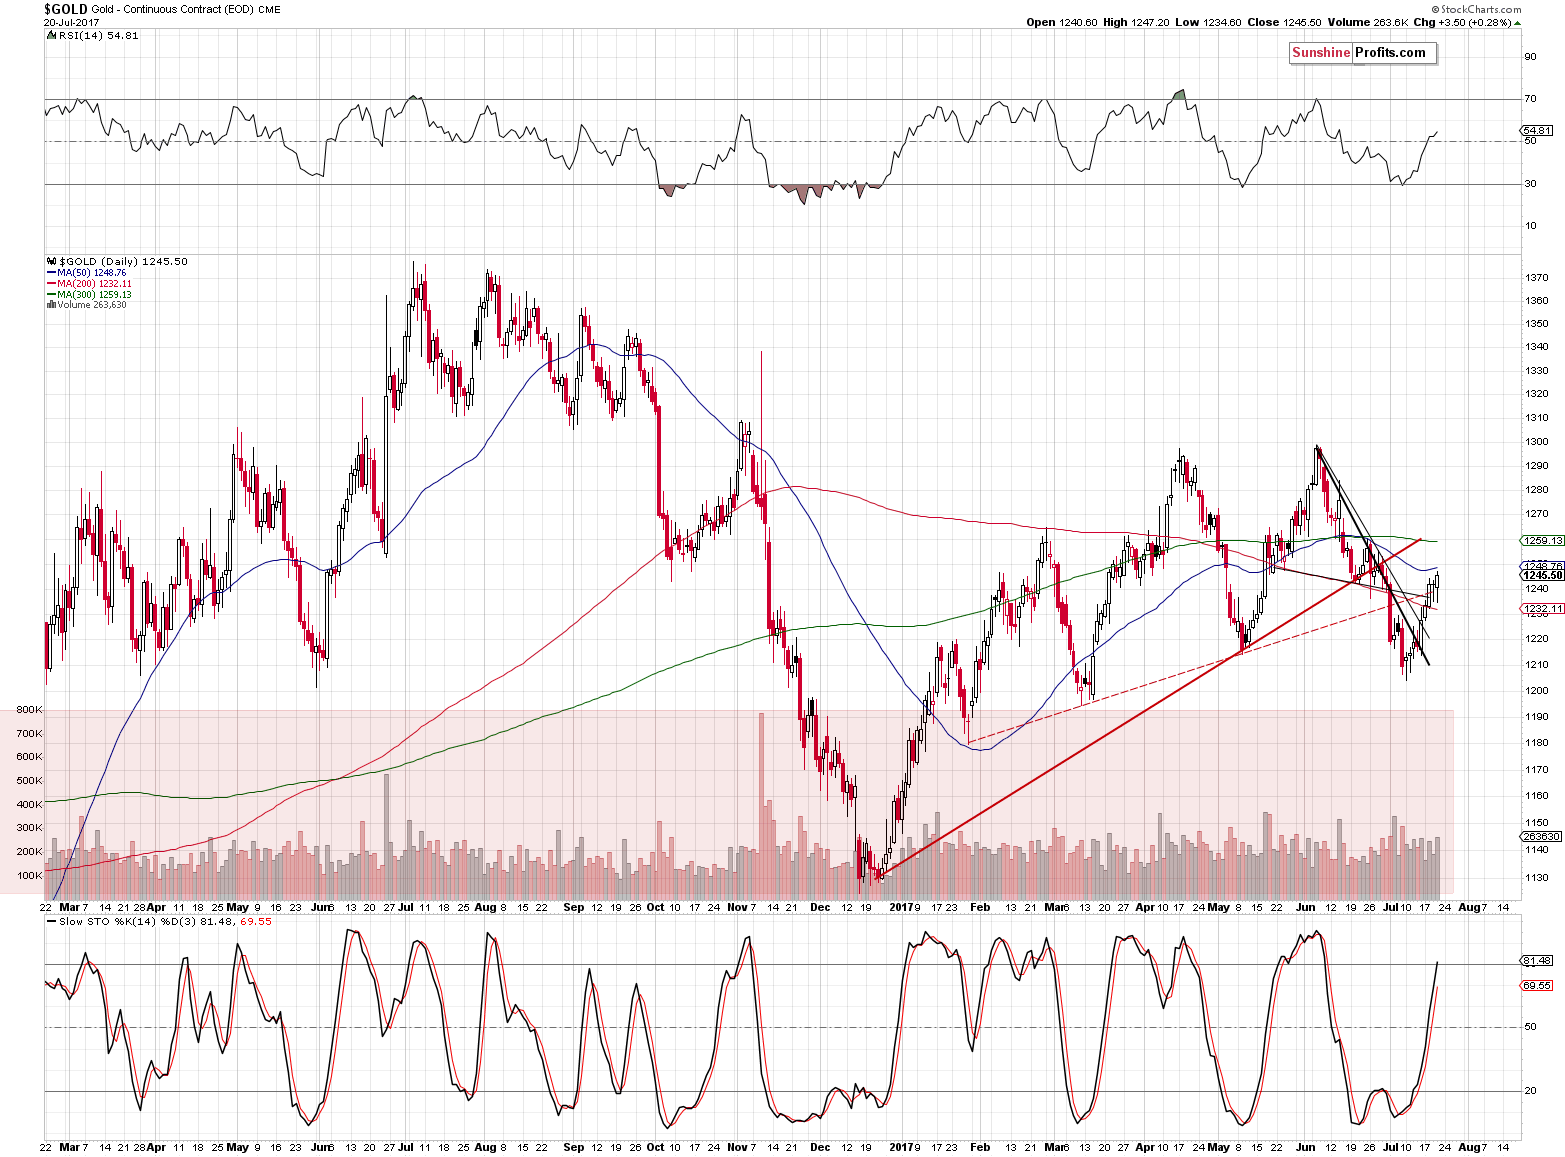
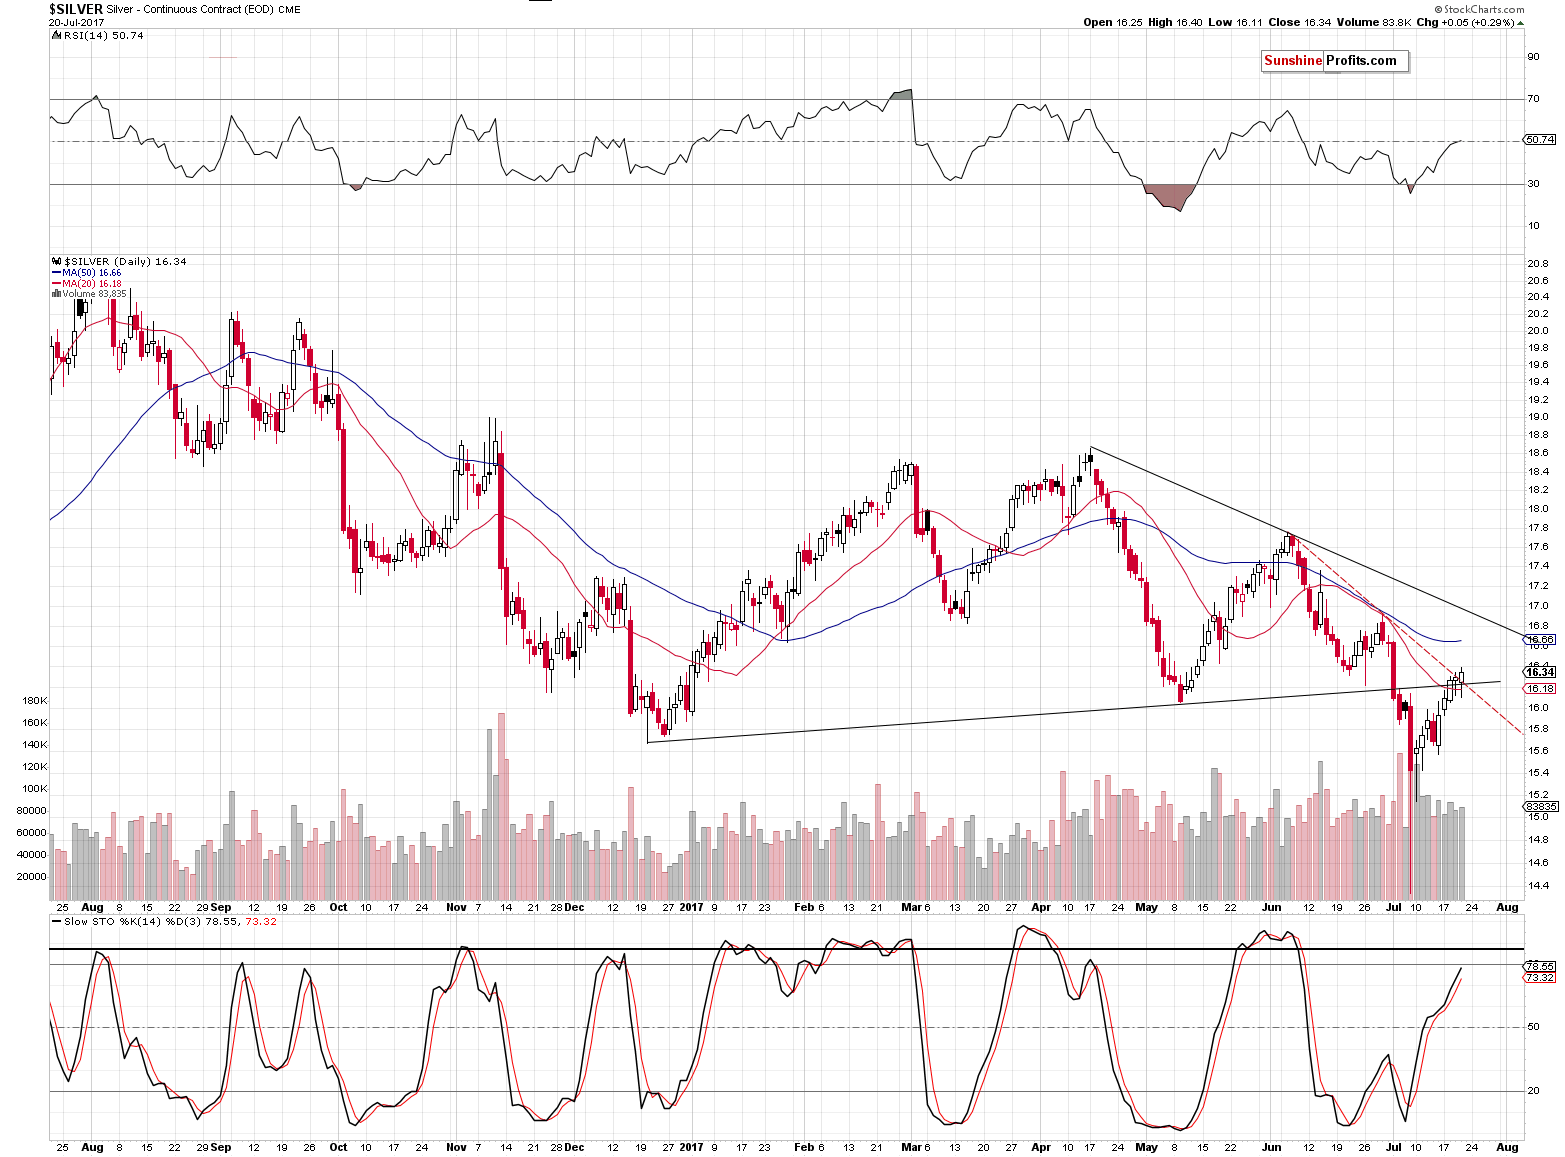
Gold and silver moved higher yesterday ($3.50 and 5 cents, respectively), but – as we wrote above – the move was very small compared to the sizable decline in the USD. The breakout in silver was relatively small and gold was once again moving back and forth around the rising dashed resistance line. It finally closed the session above it, but it will be more important how it closes the entire week.
For now, the precious metals’ weak reaction to the USD’s decline and the mining stocks’ weak decline in light of the action in precious metals seem to be the key developments to keep in mind – they seem even more important than the fact that the USD Index is extremely oversold on a short- and medium-term basis, which also has profound bearish implications for the precious metals market for the following months.
Summing up, yesterday’s session didn’t invalidate multiple bearish points that we had made in our previous alerts and – despite the bullish nature of the session (after all, gold, silver and mining stocks closed higher yesterday than on Wednesday), it was yet another case of the metals and miners’ underperformance given the action in their key drivers. Overall, the outlook remains very bearish for the following weeks. As we had already written previously, we could see higher prices in the coming days, but much lower prices in the coming weeks and months. Any strength here is likely to be only temporary.
As always, we will keep you – our subscribers – informed.
To summarize:
Trading capital (supplementary part of the portfolio; our opinion): Short positions (150% of the full position) in gold, silver and mining stocks are justified from the risk/reward perspective with the following stop-loss orders and initial target price levels / profit-take orders:
- Gold: initial target price level: $1,063; stop-loss: $1,317; initial target price for the DGLD ETN: $81.88; stop-loss for the DGLD ETN $44.57
- Silver: initial target price: $13.12; stop-loss: $19.22; initial target price for the DSLV ETN: $46.18; stop-loss for the DSLV ETN $17.93
- Mining stocks (price levels for the GDX ETF): initial target price: $9.34; stop-loss: $26.34; initial target price for the DUST ETF: $143.56; stop-loss for the DUST ETF $21.37
In case one wants to bet on junior mining stocks' prices (we do not suggest doing so – we think senior mining stocks are more predictable in the case of short-term trades – if one wants to do it anyway, we provide the details), here are the stop-loss details and initial target prices:
- GDXJ ETF: initial target price: $14.13; stop-loss: $45.31
- JDST ETF: initial target price: $417.04; stop-loss: $43.12
Long-term capital (core part of the portfolio; our opinion): No positions (in other words: cash)
Insurance capital (core part of the portfolio; our opinion): Full position
Important Details for New Subscribers
Whether you already subscribed or not, we encourage you to find out how to make the most of our alerts and read our replies to the most common alert-and-gold-trading-related-questions.
Please note that the in the trading section we describe the situation for the day that the alert is posted. In other words, it we are writing about a speculative position, it means that it is up-to-date on the day it was posted. We are also featuring the initial target prices, so that you can decide whether keeping a position on a given day is something that is in tune with your approach (some moves are too small for medium-term traders and some might appear too big for day-traders).
Plus, you might want to read why our stop-loss orders are usually relatively far from the current price.
Please note that a full position doesn’t mean using all of the capital for a given trade. You will find details on our thoughts on gold portfolio structuring in the Key Insights section on our website.
As a reminder – “initial target price” means exactly that – an “initial” one, it’s not a price level at which we suggest closing positions. If this becomes the case (like it did in the previous trade) we will refer to these levels as levels of exit orders (exactly as we’ve done previously). Stop-loss levels, however, are naturally not “initial”, but something that, in our opinion, might be entered as an order.
Since it is impossible to synchronize target prices and stop-loss levels for all the ETFs and ETNs with the main markets that we provide these levels for (gold, silver and mining stocks – the GDX ETF), the stop-loss levels and target prices for other ETNs and ETF (among other: UGLD, DGLD, USLV, DSLV, NUGT, DUST, JNUG, JDST) are provided as supplementary, and not as “final”. This means that if a stop-loss or a target level is reached for any of the “additional instruments” (DGLD for instance), but not for the “main instrument” (gold in this case), we will view positions in both gold and DGLD as still open and the stop-loss for DGLD would have to be moved lower. On the other hand, if gold moves to a stop-loss level but DGLD doesn’t, then we will view both positions (in gold and DGLD) as closed. In other words, since it’s not possible to be 100% certain that each related instrument moves to a given level when the underlying instrument does, we can’t provide levels that would be binding. The levels that we do provide are our best estimate of the levels that will correspond to the levels in the underlying assets, but it will be the underlying assets that one will need to focus on regarding the signs pointing to closing a given position or keeping it open. We might adjust the levels in the “additional instruments” without adjusting the levels in the “main instruments”, which will simply mean that we have improved our estimation of these levels, not that we changed our outlook on the markets. We are already working on a tool that would update these levels on a daily basis for the most popular ETFs, ETNs and individual mining stocks.
Our preferred ways to invest in and to trade gold along with the reasoning can be found in the how to buy gold section. Additionally, our preferred ETFs and ETNs can be found in our Gold & Silver ETF Ranking.
As a reminder, Gold & Silver Trading Alerts are posted before or on each trading day (we usually post them before the opening bell, but we don't promise doing that each day). If there's anything urgent, we will send you an additional small alert before posting the main one.
=====
Latest Free Trading Alerts:
Yesterday, gold hit a three-week high. What does it mean for the precious metals market?
Historically palladium has been generally cheaper than platinum. However, the ratio between these two metals has been approaching parity recently. We invite you to read our today’s article about the supply and demand dynamics of palladium and find out whether it is worth investing.
Is It Worth Investing in Palladium?
=====
Hand-picked precious-metals-related links:
India's Paytm aims to sell gold worth $200 million this year
Indian government's green signal for MMTC to auction Rs 1700 crore worth Gold
Investors are pouring money into silver ETFs
South Africa intends to suspend issuing mining rights
=====
In other news:
ECB policymakers see October as most likely date for QE decision: sources
Euro Advance Persists as Politics Sink Dollar: Markets Wrap
That was fun; now comes the slowdown
Greece Approved for $1.8 Billion Conditional Loan From IMF
The Upside and Downside of Liquidity-Driven Markets
It's not bitcoin or ethereum: This digital currency rose 3,977% in the first half of 2017
How To Actually Buy Bitcoin Or Ethereum
Hackers Steal Staggering $32 Million In Ethereum
=====
Thank you.
Sincerely,
Przemyslaw Radomski, CFA
Founder, Editor-in-chief, Gold & Silver Fund Manager
Gold & Silver Trading Alerts
Forex Trading Alerts
Oil Investment Updates
Oil Trading Alerts

