

Briefly: In our opinion, full (100% of the regular size of the position) speculative short positions in gold, silver and mining stocks are justified from the risk/reward perspective at the moment of publishing this alert.
The USD Index moved to new lows on Friday and when almost everyone (not us) assumed that it was breaking below the key support levels, it rallied back up, closing the week above the key long-term support levels. The rally continues also today confirming the bullish nature of Friday’s action. In yesterday’s message, we provided you with an early heads-up regarding the situation on the precious metals market and in today’s alert, we’ll expand the analysis and we’ll back it up with charts. Let’s move right to them (chart courtesy of http://stockcharts.com), beginning with the currency sector.
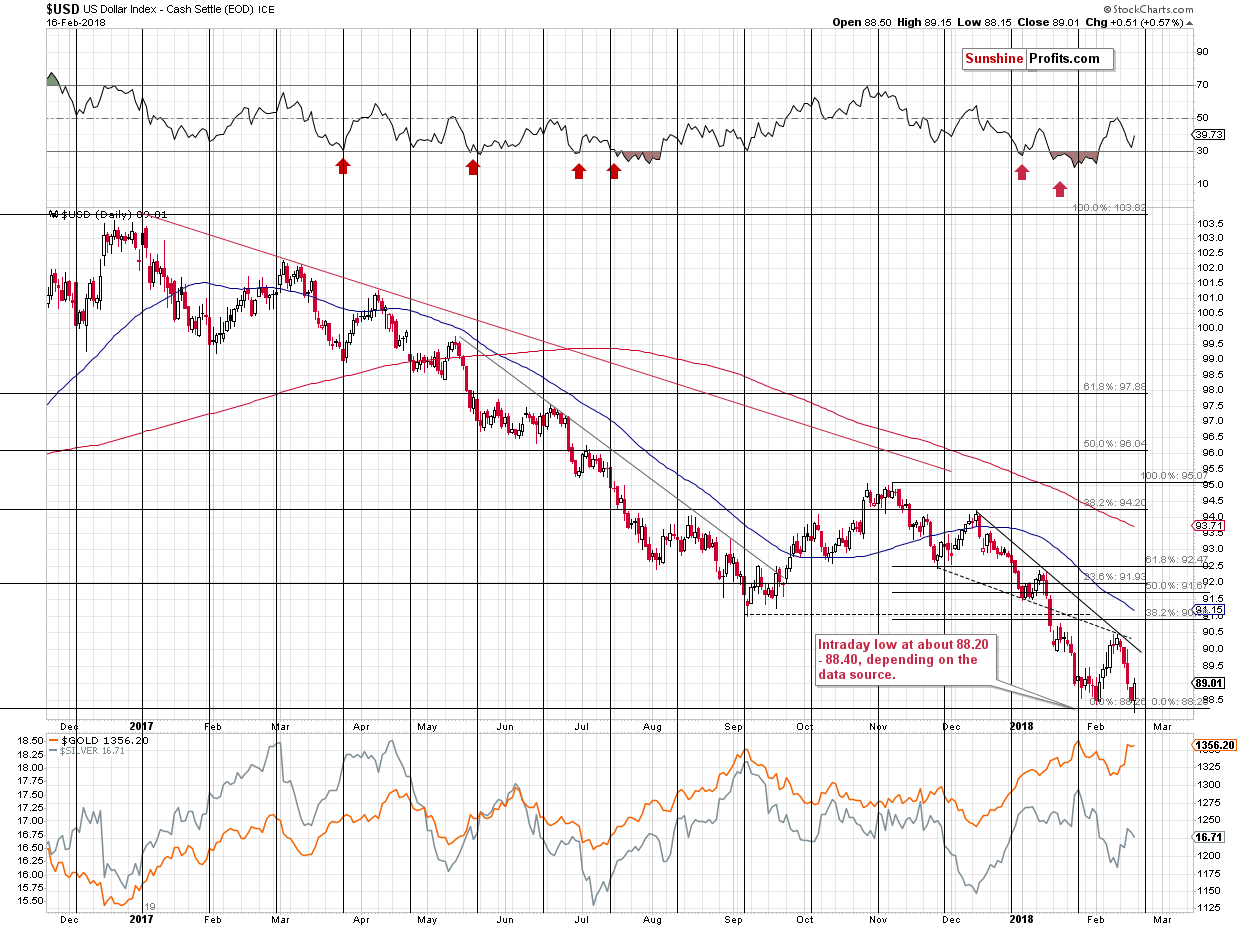
During Friday’s trading, The USD Index moved very insignificantly below the previous 2018 low and rallied back up, invalidating almost all breakdowns below important support levels. The short-term outlook for the USD therefore improved greatly. In today’s pre-market trading we’re seeing the continuation of the upswing. At the moment of writing these words, the USD Index is after a 0.23 rally, which may seem insignificant until one realizes that it means the invalidation of the last of major breakdowns. The outlook has just improved further.
The preceding decline was actually not that bad for the short-term outlook – in light of the cyclical turning point, it has bullish implications at this time. If it weren’t for the preceding decline, we would be expecting a downward correction, instead of a bigger rally.
The chart above shows how significant the mentioned support levels actually are. Key tops and key Fibonacci retracements based on the key price extremes. Each of them is important and their combination is even more important. The same goes for the invalidation of breakdowns – the implications are bullish.
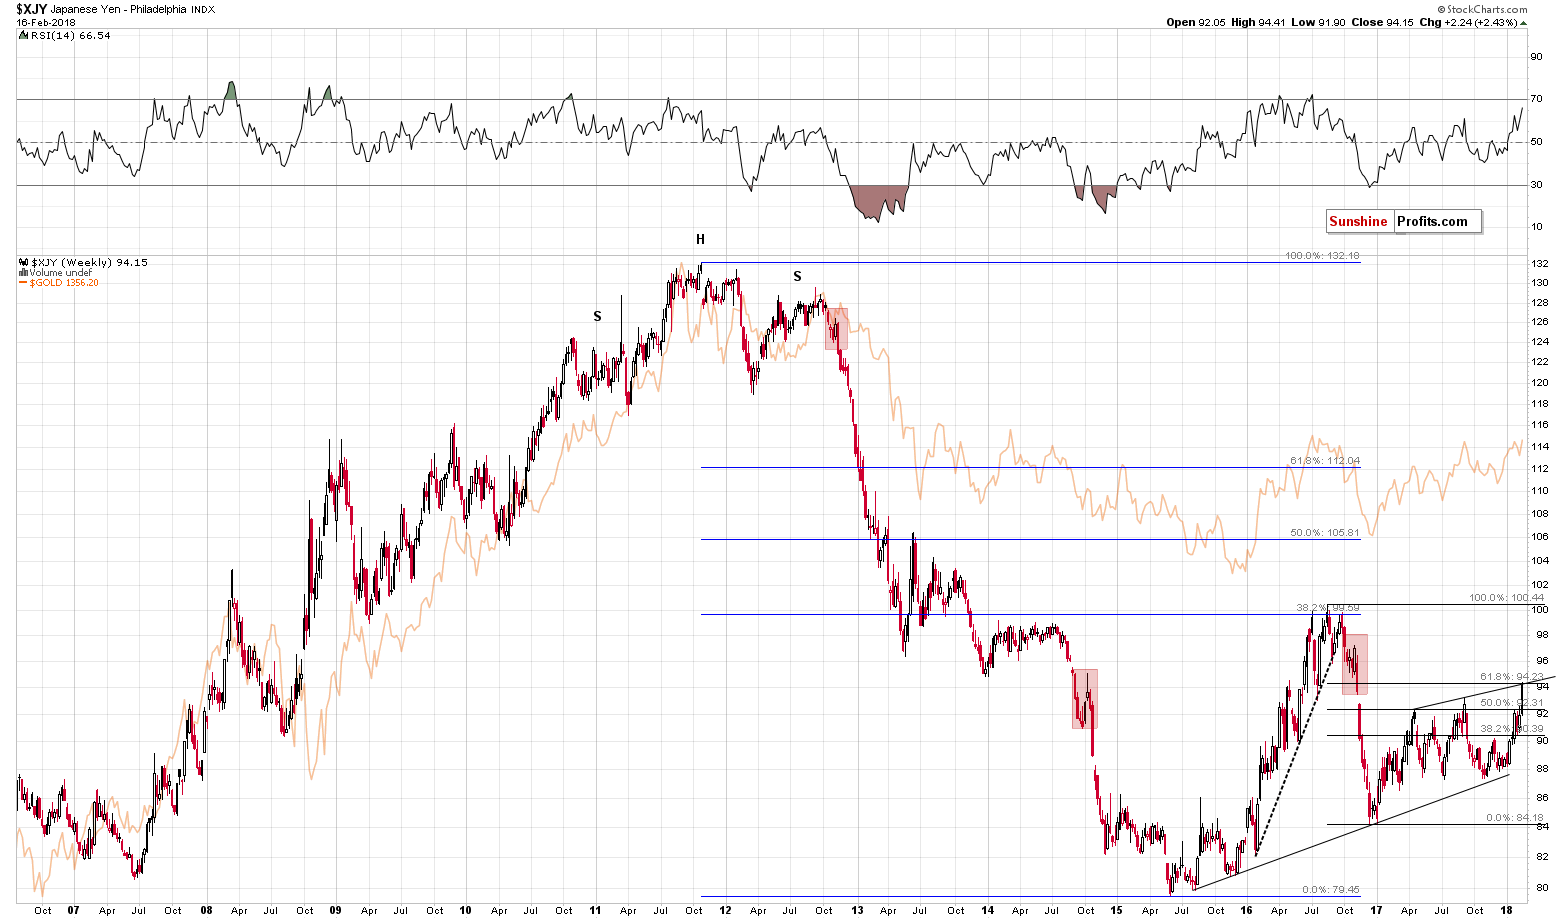
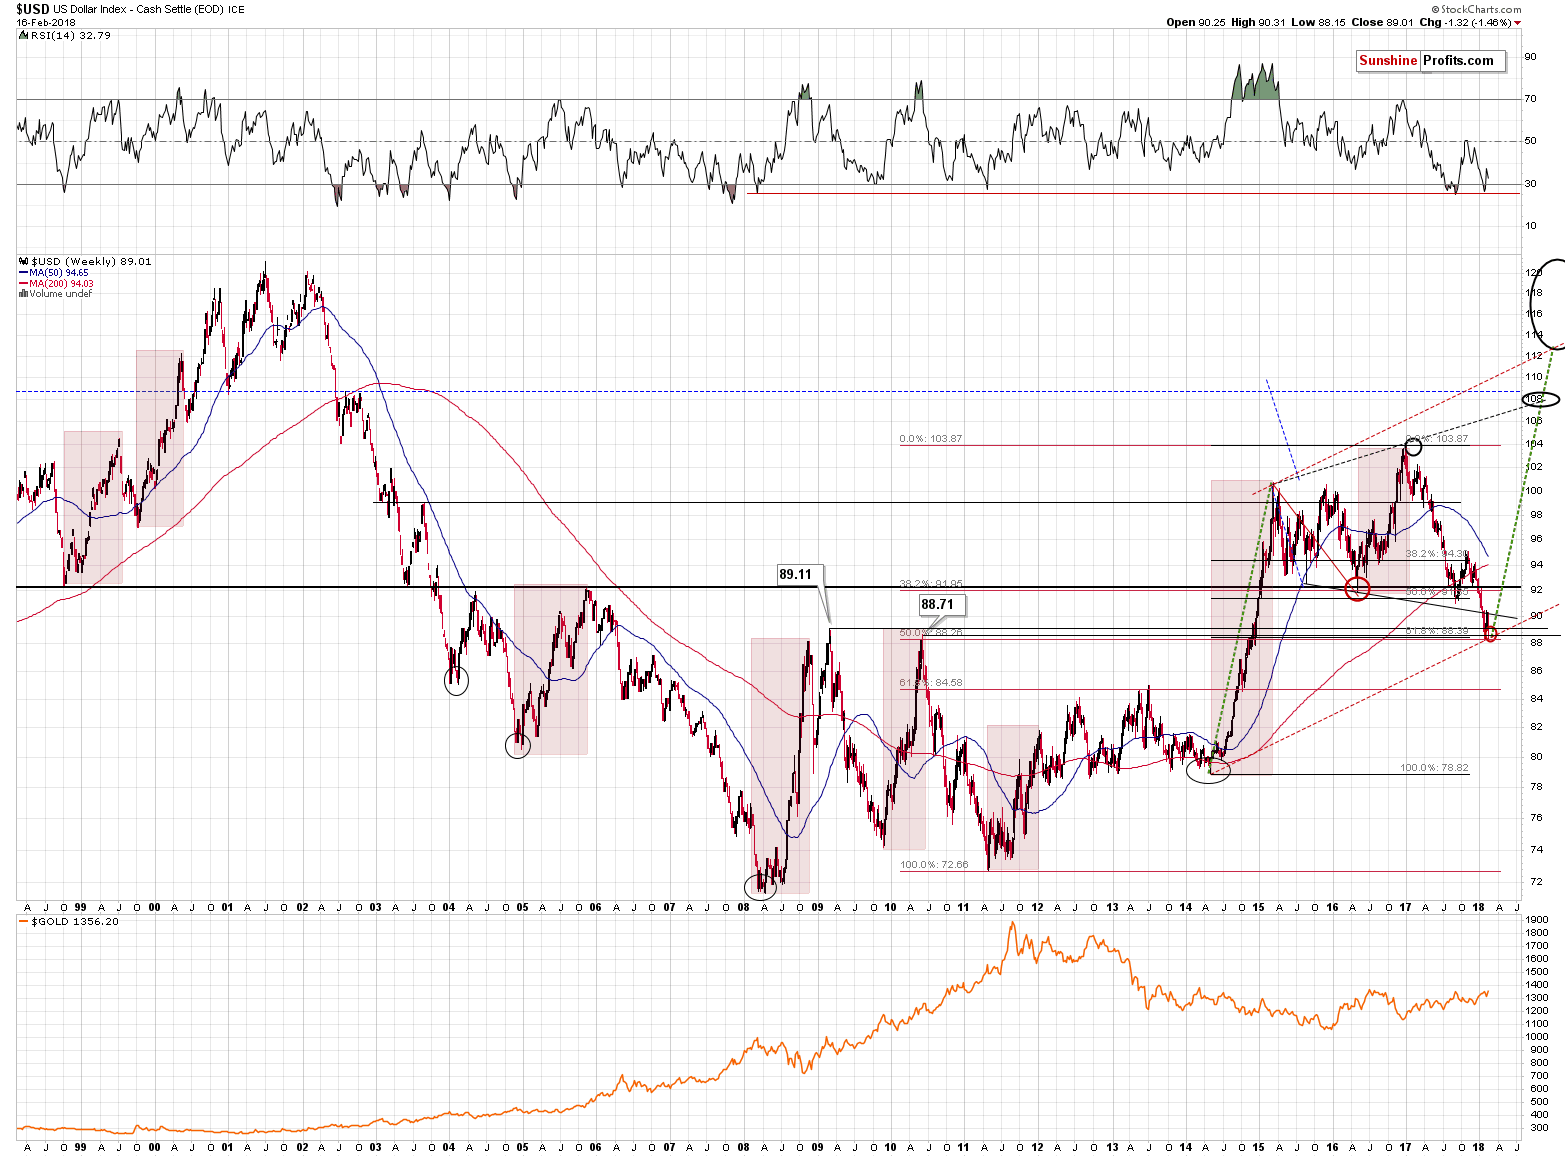
It’s not just the entire USD Index’s picture that points to a reversal – one of its most important (the second most important) components is pointing to a reversal as well.
We wrote the following in our Thursday’s alert:
Finally, let’s look at the Japanese yen. It moved above its 2018 and 2017 highs, so it’s now likely to either invalidate the breakdown or to move to the rising resistance line. The latter seems more likely as this resistance is strengthened by the 61.8% Fibonacci retracement and this is exactly the retracement that worked so perfectly from the bigger perspective in the case of the 2016 top.
The Japanese yen reached the mentioned combination of strong resistance levels, which is quite likely to trigger a reversal. Knowing that the Japanese yen and gold very often move in tandem suggests that precious metals are currently topping or – based on today’s pre-market decline – have already topped.
Speaking of precious metals, let’s take a look at gold.
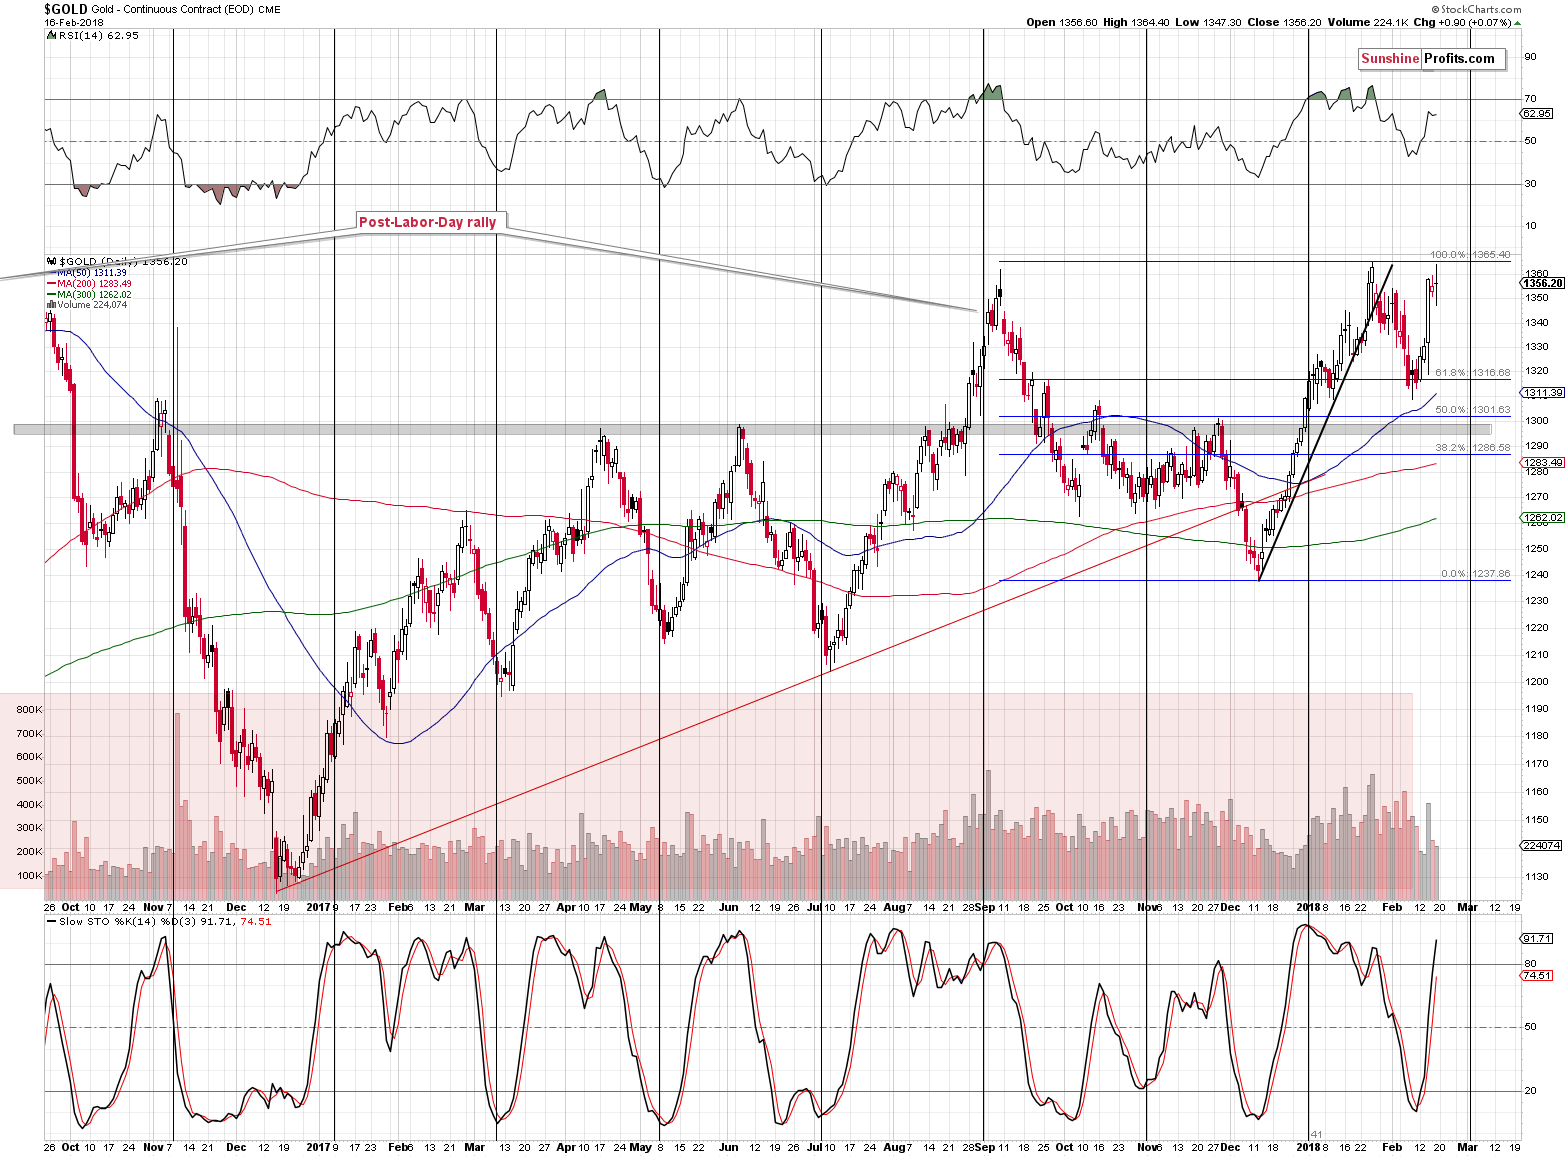
Gold, on the other hand, moved temporarily higher - to the September 2017 and January 2018 highs and then it reversed and - based on GLD and kitco's intraday data - declined. The reversal is not visible on the above Stockcharts' chart, but it should be. The implications are bearish and they seem to be already in play. Gold declined about $7 today and is currently at $1,339. This is the price level to which gold approximately (a little below $1,340) declined right after both the September 2017 high and the January 2018 high. The implications are bearish as gold declined more visibly in both past cases.
There was some back and forth movement close to the $1,335 in both cases, so we might also see the same here. This might serve as a chance for silver to shine and outperform gold during one of the daily upswings. If that happens, it could be the bearish confirmation that is needed for the short-term outlook to deteriorate further and for us to consider adding to our short positions (we previously cut it in half right after the Feb 9 bottom, taking some profits off the table).
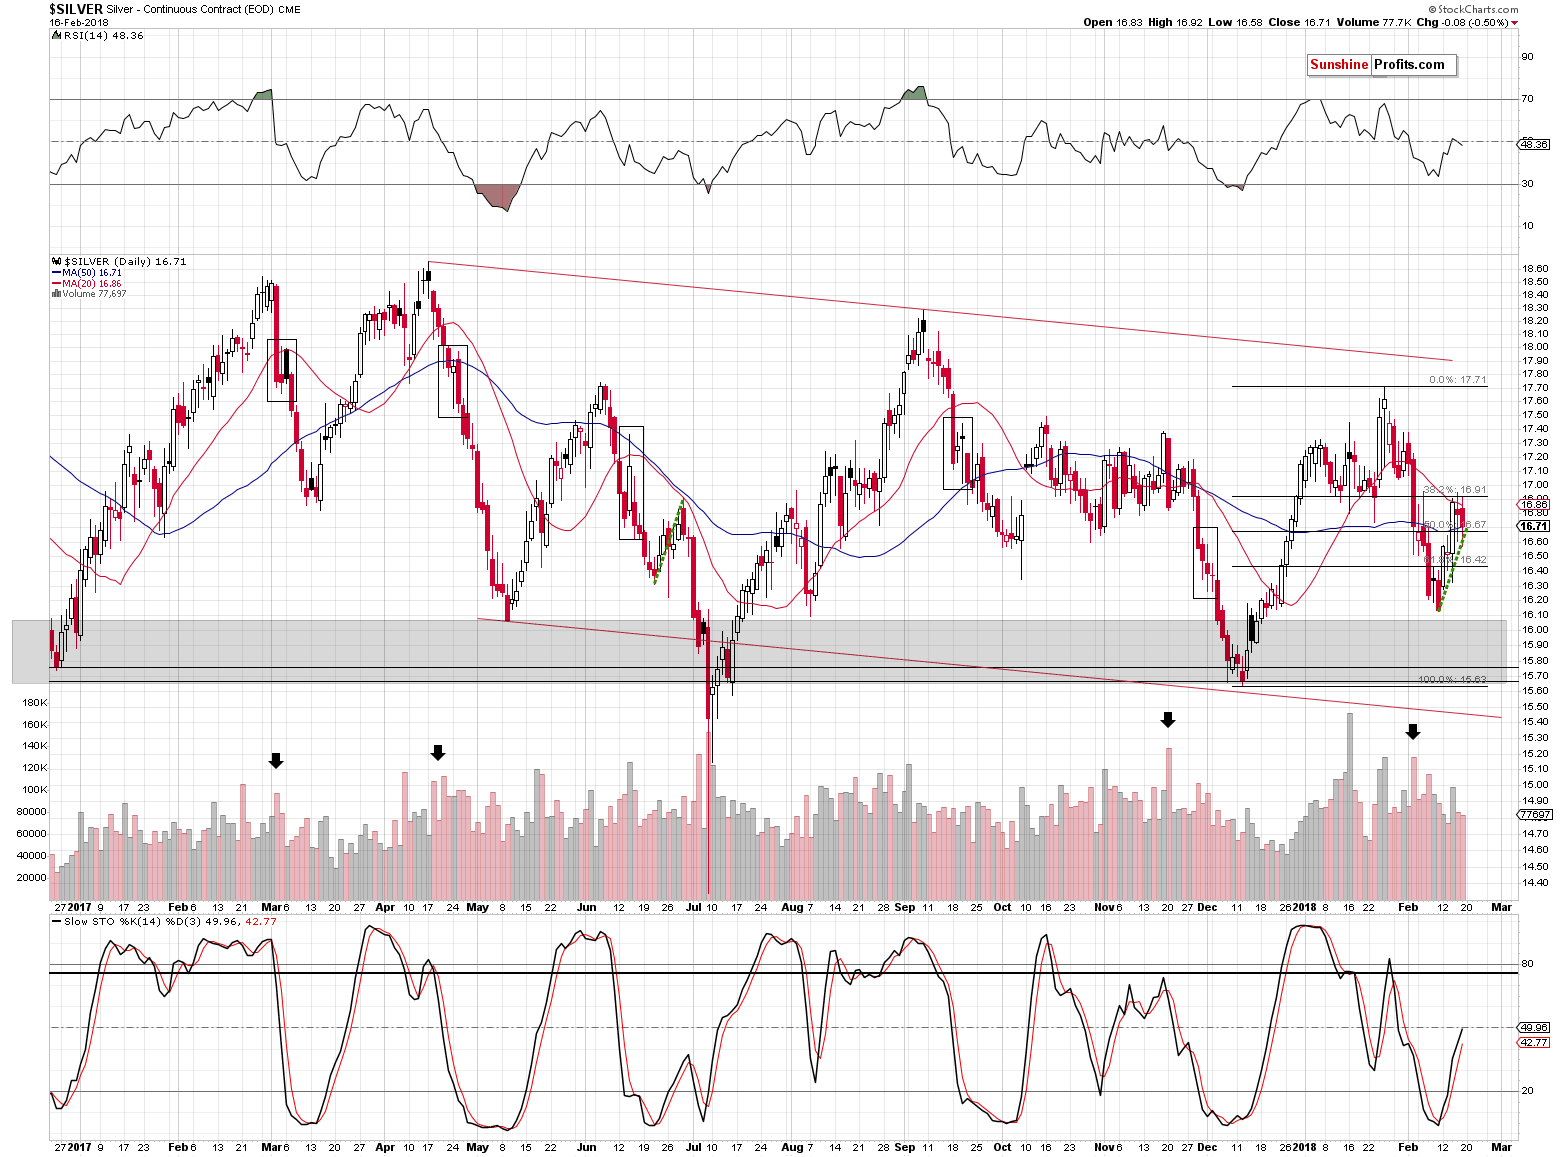
At the moment of writing these words, silver is trading at $16.52, which is below both the 20-day and 50-day moving averages. It’s also below the 50% Fibonacci retracement and below the green, dashed line that we used to mark the analogy to the late-July correction.
The implications of the mentioned breakdowns is bearish. As far as the similarity to the late-June correction is concerned, please note that silver moved a bit higher this time (the USD’s impact – silver had little choice), but in terms of time, the corrections are still alike. The decline that followed in June and July was very sharp and significant, so the implications of the analogy are bearish.
But didn’t the recent upswing invalidate some kind of long-term bearish price pattern?
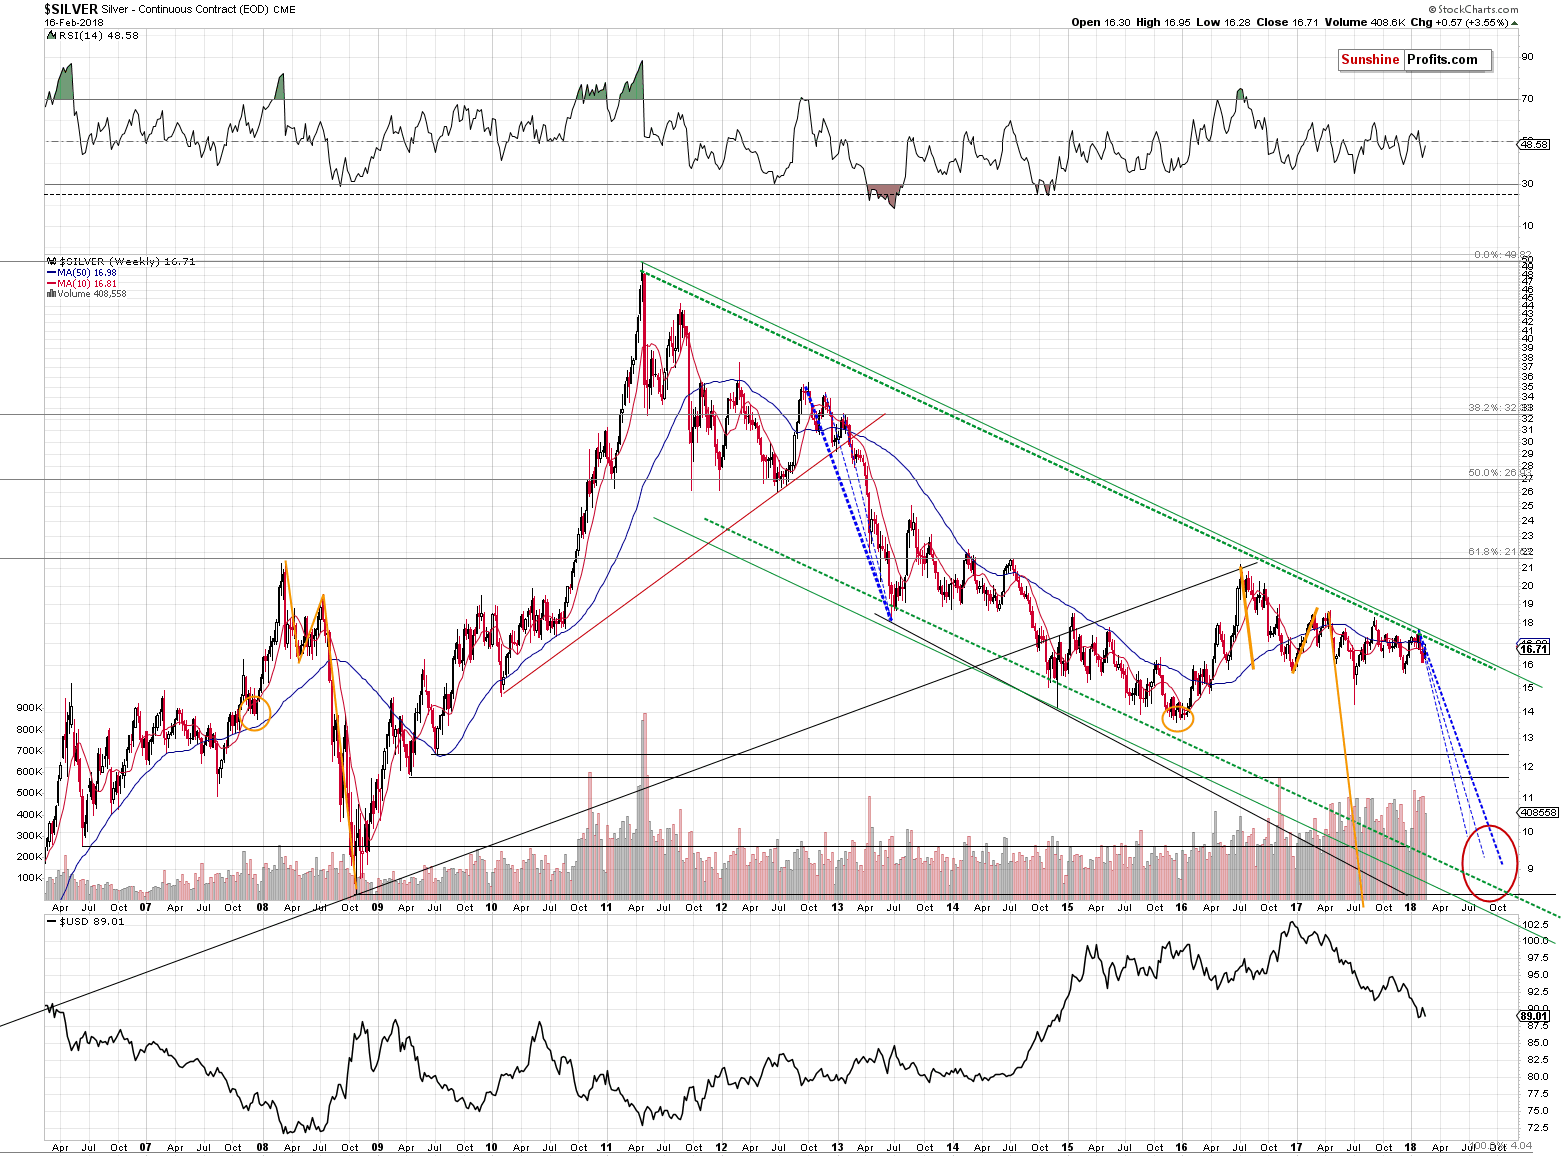
Not at all. The pace of the decline is currently very similar to what we saw during the 2012 – 2013 decline – it’s quite normal.
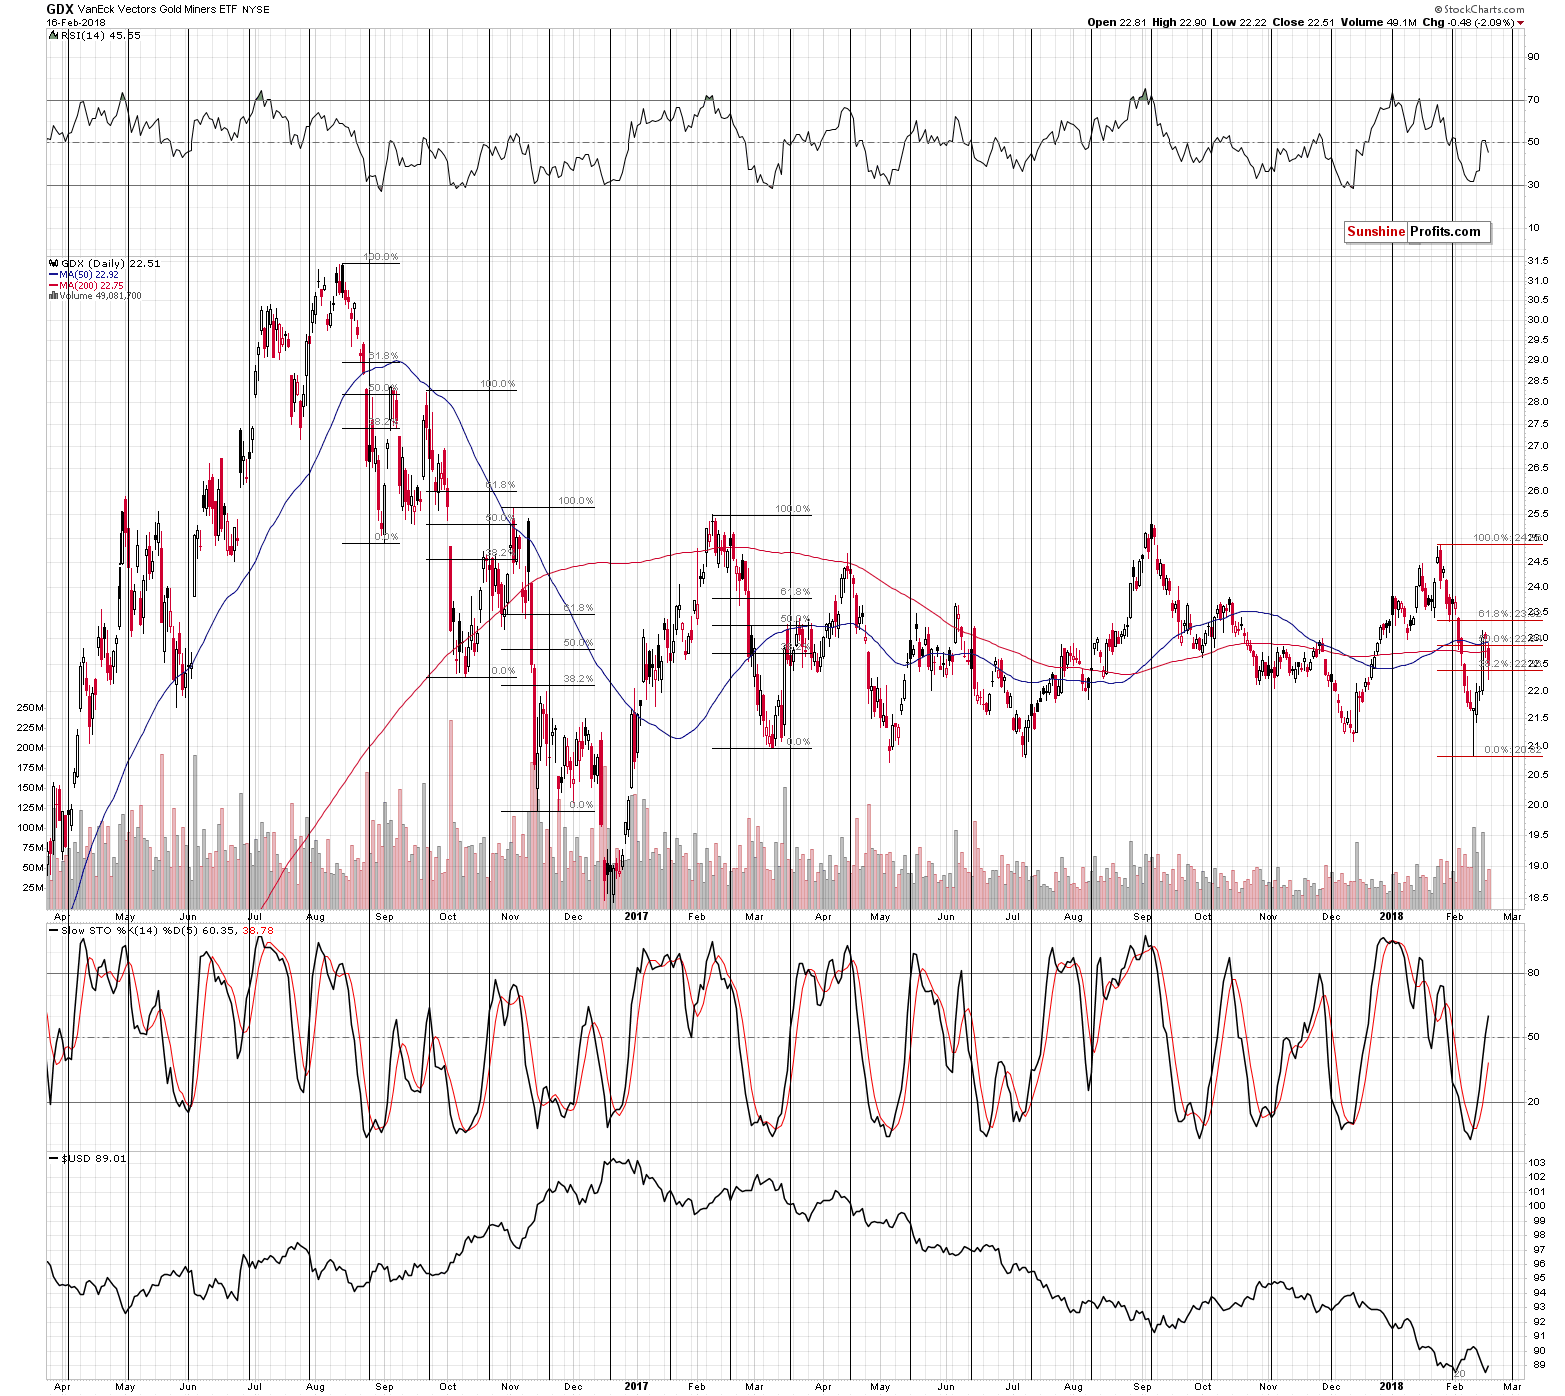
The decline in mining stocks is quite similar to the January 25, 2018 performance (the first decline after the top). Back then the big rally took 2 days to be completed and the initial decline erased about half of it. This time, the rally was a one-day phenomenon, but still, the initial decline erased about half of it.
Naturally, the above is a sign of underperformance of mining stocks relatively to gold, which is a bearish factor.
The 50% retracement along with the 50- and 200-day moving averages seem to have stopped the rally, just like we indicated previously:
[Valentine’s Day] rally in the mining stocks may seem like the end of the world or at least like a tremendous change in the situation on the precious metals world. In reality, however, it’s something that we’ve seen multiple times - only not very recently.
The last big and volatile downswing that was followed by a sharp upswing in GDX was seen in February and March 2017. The upswing took miners to about 50% Fibonacci retracement, before stopping. The preceding similar situations took place in the second half of 2016. When GDX declined sharply in August, it rallied back up just a little above the 50% Fibonacci retracement. The decline that started in September corrected initially to the 38.2% retracement, but ended only after miners moved a bit above the 50% retracement. The November decline was corrected to the 38.2% retracement.
At this time, GDX corrected a bit more than 50% of the recent sharp decline, which is well in line with the historical norms for a volatile corrective upswing WITHIN a bigger decline. In other words, even though the mining stocks are up by about 5% today, it’s not necessarily a bullish sign.
During [Thursday’s] session, mining stocks were trading back and forth around the 50% Fibonacci retracement and two of their moving averages: the 50-day and 200-day one. The breakouts above all three resistance levels are not confirmed yet, so we might be currently seeing a topping pattern, just as the currency markets suggest.
We have most likely indeed seen a topping pattern. That’s based not only on today’s pre-market decline and invalidations in the USD Index, but also based on Friday’s underperformance in the miners.
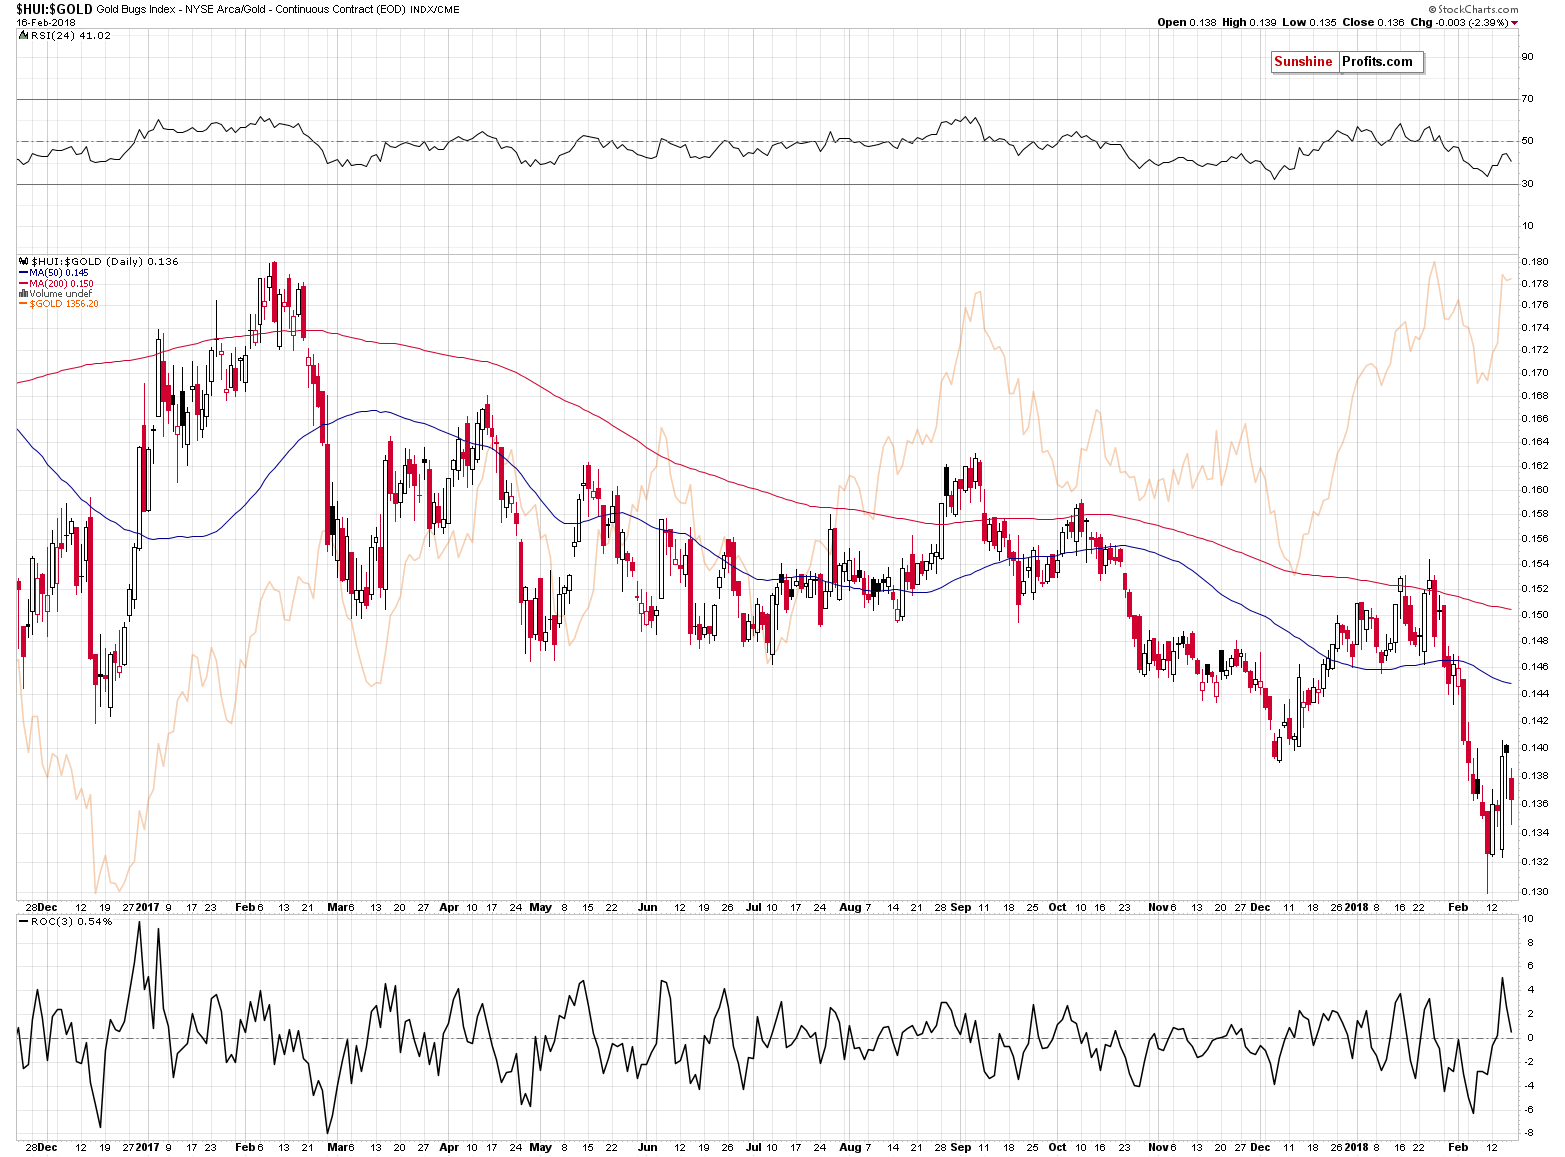
The underperformance of gold stocks can be clearly seen on the above HUI to gold ratio chart. After the miners’ Feb 9 reversal, we wrote the following:
From the short-term point of view, however, we also saw a reversal and it would not be uncommon for the breakdown below the 2016 and 2017 lows to be verified by a move back to them.
We have indeed seen a move back to the previously broken lows. The price verified the breakdown by declining shortly thereafter. The verification seems to be completed and the ratio and the precious metals sector seem ready to decline further.
Before summarizing, let’s take a look at the gold to S&P 500 ratio chart.
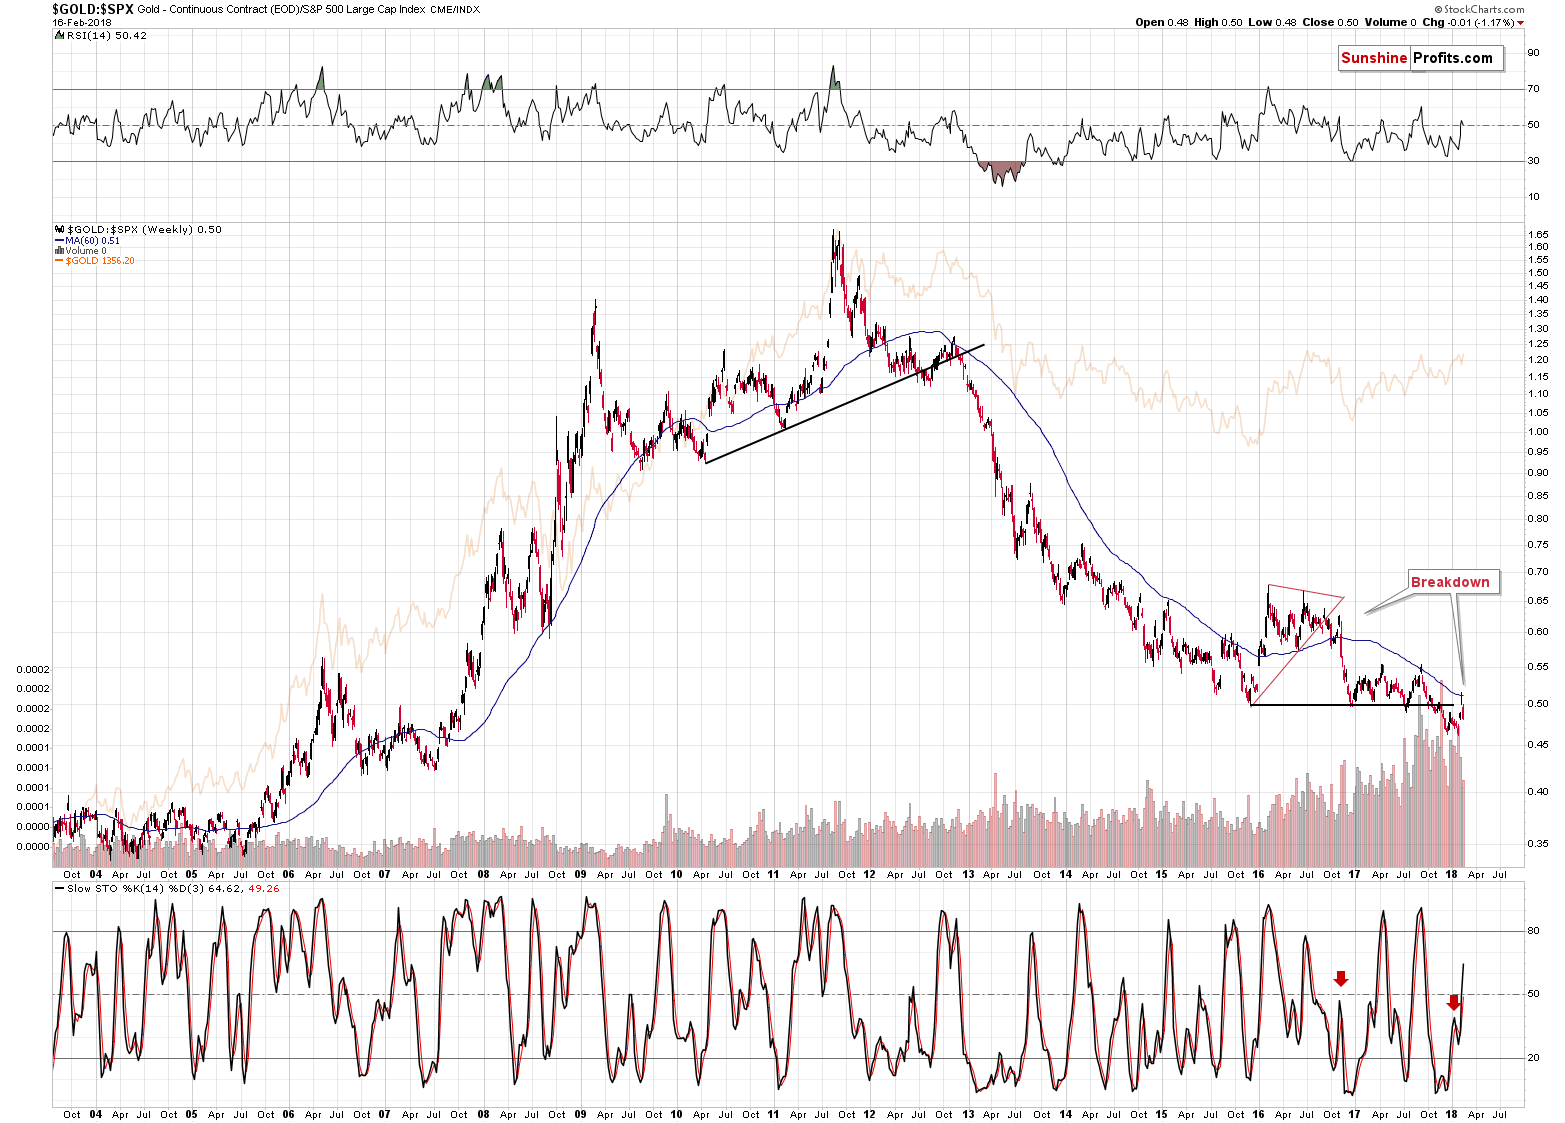
On February 12th, we wrote the following on the above chart:
The breakdown was invalidated based on last week’s closing prices. However, it seems to have short-term implications for the stock market, not for gold. Besides, the ratio already reached its 60-week moving average, which served as support and resistance quite a few times (including during the previous top), so the rally might be over anyway.
The ratio declined after reaching its 60-week moving average, just like it did several times in the past. That’s the first time when we’re seeing a decisive move back below the 2015, 2016 and most of the 2017 lows right after the rally. It seems that the move higher in the ratio was rather accidental and perhaps based on incorrect futures price data. Whether that was the case or not, the implications are bearish as the ratio is now once again below the medium-term support, which now turned into resistance. Since the above ratio and gold move in tandem in the case of big moves, the implications for the following weeks and months are bearish.
Summing up, the precious metals sector moved higher last week, but that is not – by itself – a bullish sign, especially that a large part of the rally was erased in the case of silver and mining stocks. PMs simply reacted to the very weak performance of the USD Index and since the USD Index just broke below the key support levels and invalidated all the breakdowns, it could be the case that the rally in metals and miners is already over. The Japanese yen reached a combination of 2 important resistance levels, which could also cause the precious metals sector to decline. This is a combination of factors that favors short positions, not long ones.
If we’re lucky, we’ll see another small upswing in gold which is accompanied by a bigger daily rally in silver and disappointing performance in mining stocks. This would serve as a perfect bearish confirmation for the short term that would likely make us double the size of the current short position. At this time, however, the above is just a possibility, not a certainty, so we’ll need to keep monitoring the market and act accordingly. We may see this kind of action if gold trades back and forth close to the $1,330 - $1,340 range as it did in the past.
As always, we will keep you – our subscribers – informed.
To summarize:
Trading capital (supplementary part of the portfolio; our opinion): Full short positions (100% of the full position) in gold, silver and mining stocks are justified from the risk/reward perspective with the following stop-loss orders and initial target price levels:
- Gold: initial target price: $1,218; stop-loss: $1,382; initial target price for the DGLD ETN: $53.98; stop-loss for the DGLD ETN $37.68
- Silver: initial target price: $14.63; stop-loss: $17.82; initial target price for the DSLV ETN: $33.88; stop-loss for the DSLV ETN $20.88
- Mining stocks (price levels for the GDX ETF): initial target price: $19.22; stop-loss: $26.14; initial target price for the DUST ETF: $39.88; stop-loss for the DUST ETF $15.78
In case one wants to bet on junior mining stocks' prices (we do not suggest doing so – we think senior mining stocks are more predictable in the case of short-term trades – if one wants to do it anyway, we provide the details), here are the stop-loss details and initial target prices:
- GDXJ ETF: initial target price: $27.82; stop-loss: $38.22
- JDST ETF: initial target price: $94.88 stop-loss: $37.78
Long-term capital (core part of the portfolio; our opinion): No positions (in other words: cash)
Insurance capital (core part of the portfolio; our opinion): Full position
Important Details for New Subscribers
Whether you already subscribed or not, we encourage you to find out how to make the most of our alerts and read our replies to the most common alert-and-gold-trading-related-questions.
Please note that the in the trading section we describe the situation for the day that the alert is posted. In other words, it we are writing about a speculative position, it means that it is up-to-date on the day it was posted. We are also featuring the initial target prices, so that you can decide whether keeping a position on a given day is something that is in tune with your approach (some moves are too small for medium-term traders and some might appear too big for day-traders).
Plus, you might want to read why our stop-loss orders are usually relatively far from the current price.
Please note that a full position doesn’t mean using all of the capital for a given trade. You will find details on our thoughts on gold portfolio structuring in the Key Insights section on our website.
As a reminder – “initial target price” means exactly that – an “initial” one, it’s not a price level at which we suggest closing positions. If this becomes the case (like it did in the previous trade) we will refer to these levels as levels of exit orders (exactly as we’ve done previously). Stop-loss levels, however, are naturally not “initial”, but something that, in our opinion, might be entered as an order.
Since it is impossible to synchronize target prices and stop-loss levels for all the ETFs and ETNs with the main markets that we provide these levels for (gold, silver and mining stocks – the GDX ETF), the stop-loss levels and target prices for other ETNs and ETF (among other: UGLD, DGLD, USLV, DSLV, NUGT, DUST, JNUG, JDST) are provided as supplementary, and not as “final”. This means that if a stop-loss or a target level is reached for any of the “additional instruments” (DGLD for instance), but not for the “main instrument” (gold in this case), we will view positions in both gold and DGLD as still open and the stop-loss for DGLD would have to be moved lower. On the other hand, if gold moves to a stop-loss level but DGLD doesn’t, then we will view both positions (in gold and DGLD) as closed. In other words, since it’s not possible to be 100% certain that each related instrument moves to a given level when the underlying instrument does, we can’t provide levels that would be binding. The levels that we do provide are our best estimate of the levels that will correspond to the levels in the underlying assets, but it will be the underlying assets that one will need to focus on regarding the signs pointing to closing a given position or keeping it open. We might adjust the levels in the “additional instruments” without adjusting the levels in the “main instruments”, which will simply mean that we have improved our estimation of these levels, not that we changed our outlook on the markets. We are already working on a tool that would update these levels on a daily basis for the most popular ETFs, ETNs and individual mining stocks.
Our preferred ways to invest in and to trade gold along with the reasoning can be found in the how to buy gold section. Additionally, our preferred ETFs and ETNs can be found in our Gold & Silver ETF Ranking.
As a reminder, Gold & Silver Trading Alerts are posted before or on each trading day (we usually post them before the opening bell, but we don't promise doing that each day). If there's anything urgent, we will send you an additional small alert before posting the main one.
=====
Latest Free Trading Alerts:
The doomsayers have been calling for recession for years. Mainstream economists laughed at them, painting a rosy picture. However, the recent plunge in the stock market strengthened the pessimists’ hand. They interpret the dive as a signal of a coming recession. Is the end of the stock market boom really near?
=====
Hand-picked precious-metals-related links:
PRECIOUS-Gold falls for third session ahead of big U.S. debt auction
US 2017 Gold Bar and Coin demand falls to lowest since 2007: WGC
Battery-technology metals to leave gold, silver in the dust: readers
=====
In other news:
Fed Minutes May Give Clues to 2018 Interest Rate Word Puzzle
Morgan Stanley Says Stock Slide Was Appetizer for Real Deal
Venezuela about to pre-sell ‘petro’ cryptocurrency, and other countries could follow
Anonymous trader buys $400 million in bitcoin
=====
Thank you.
Sincerely,
Przemyslaw Radomski, CFA
Founder, Editor-in-chief, Gold & Silver Fund Manager
Gold & Silver Trading Alerts
Forex Trading Alerts
Oil Investment Updates
Oil Trading Alerts

