

Briefly: In our opinion, full (150% of the regular size of the position) speculative short positions in gold, silver and mining stocks are justified from the risk/reward perspective at the moment of publishing this alert.
It was moving higher early in the day, suggesting the bullish nature of the session. But only for a short while. The implications changed once it started to be obvious that silver is moving higher at a much greater pace than gold. The early outperformance seemed like a promise that something big was going to take place during the session.
It was tempting to bet on lower precious metals prices early in the day, but we were sitting on our hands impatiently waiting for the signal of greater clarity.
And we got it.
The FOMC triggered a decline in the USD and a rally in gold, silver and mining stocks. The general stock market rallied as well. The stock market and precious metals bulls were cheering for several minutes.
We knew that this was it.
As soon as silver rallied above $16.70, we decided to send the alert that we had mostly prepared in advance. In this alert we took an extra-large bet on lower precious metals prices, viewing the FOMC rally as a bluff. Less than 2 hours later, silver was already below $16.50. Today’s pre-market low was $16.39.
In today’s alert, we explain in detail not only what happened, but what’s likely waiting just around the corner, as yesterday’s specific action in silver and mining stocks has a lot to tell.
Let’s start with yesterday’s intraday action in gold and silver.
Gold managed to correct about 50% of the previous day’s decline, while silver moved well above yesterday’s high. The white metal’s outperformance was very clear and so was the bearish signal.
Let’s see how it looked from the broader perspective (chart courtesy of http://stockcharts.com).
Bigger Picture
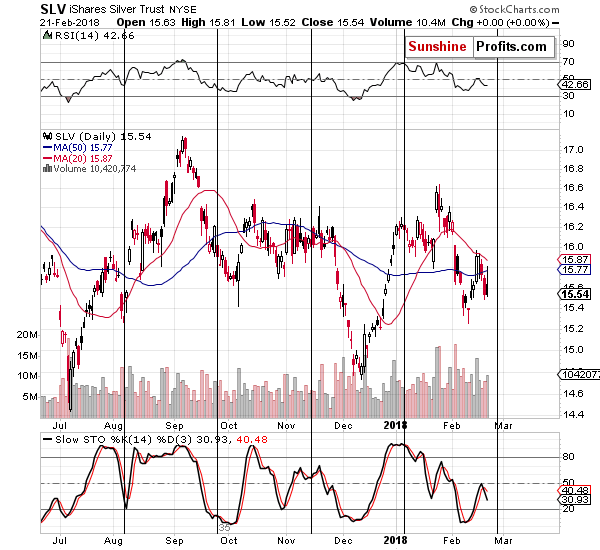
SLV (silver’s data on Stockcharts seems to be imprecise today) rallied a bit above its 50-day moving average and declined once again, verifying the breakdown below it. The intraday high was somewhat close to the February high – yesterday’s upswing can be viewed as silver’s (failed) attempt to move back to it.
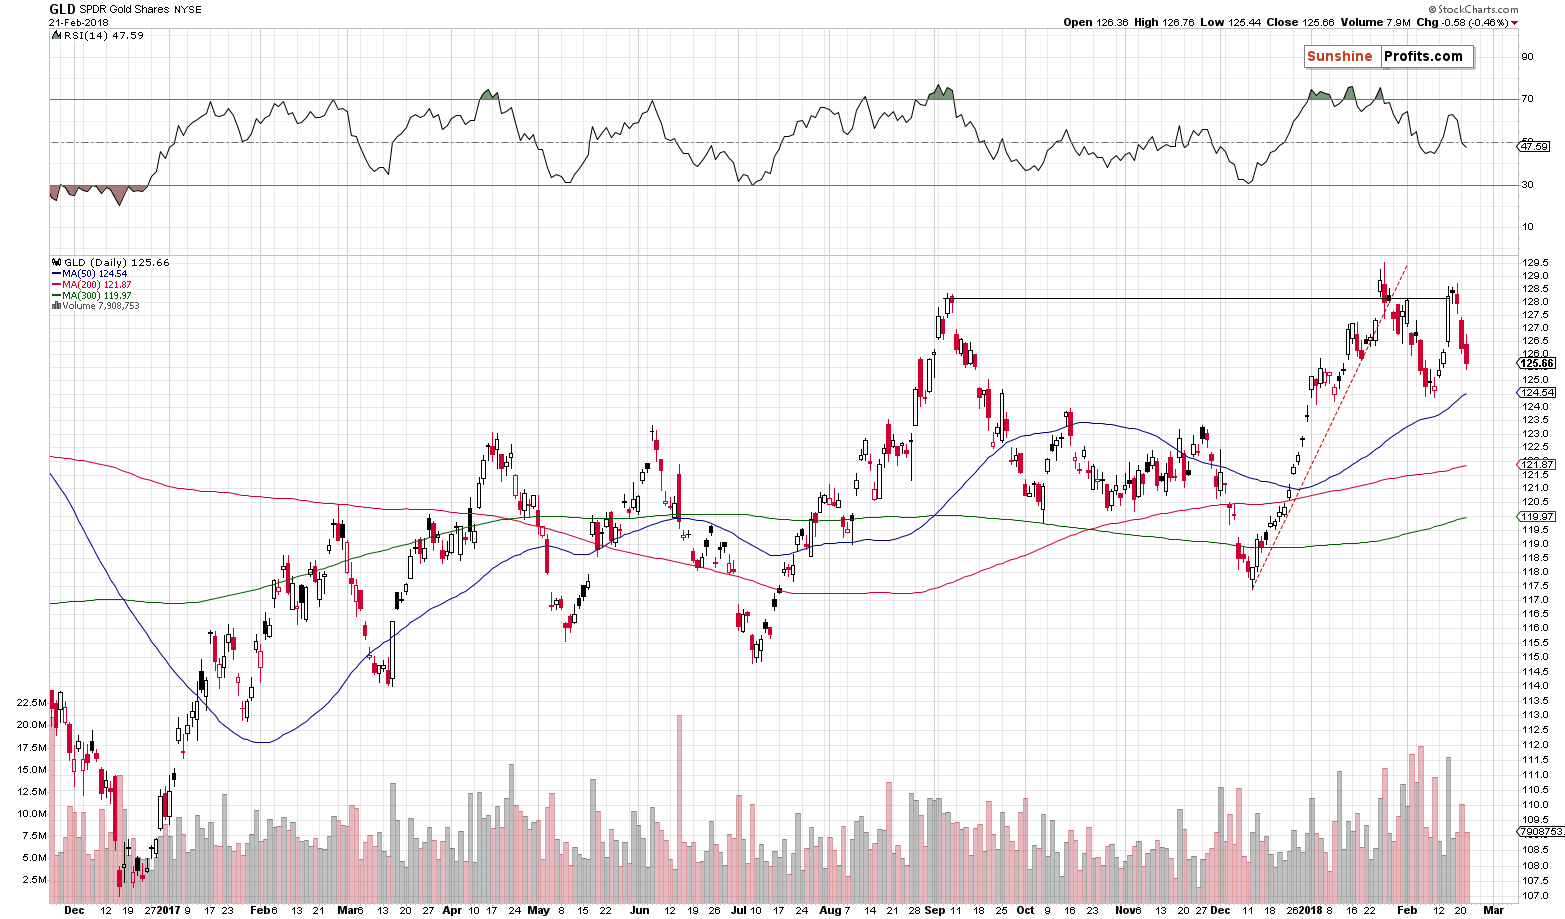
We can’t say anything like that about GLD. The yellow precious metal moved higher, but the size of the upswing was negligible. Consequently, silver’s outperformance is confirmed also in relation to the previous price moves.
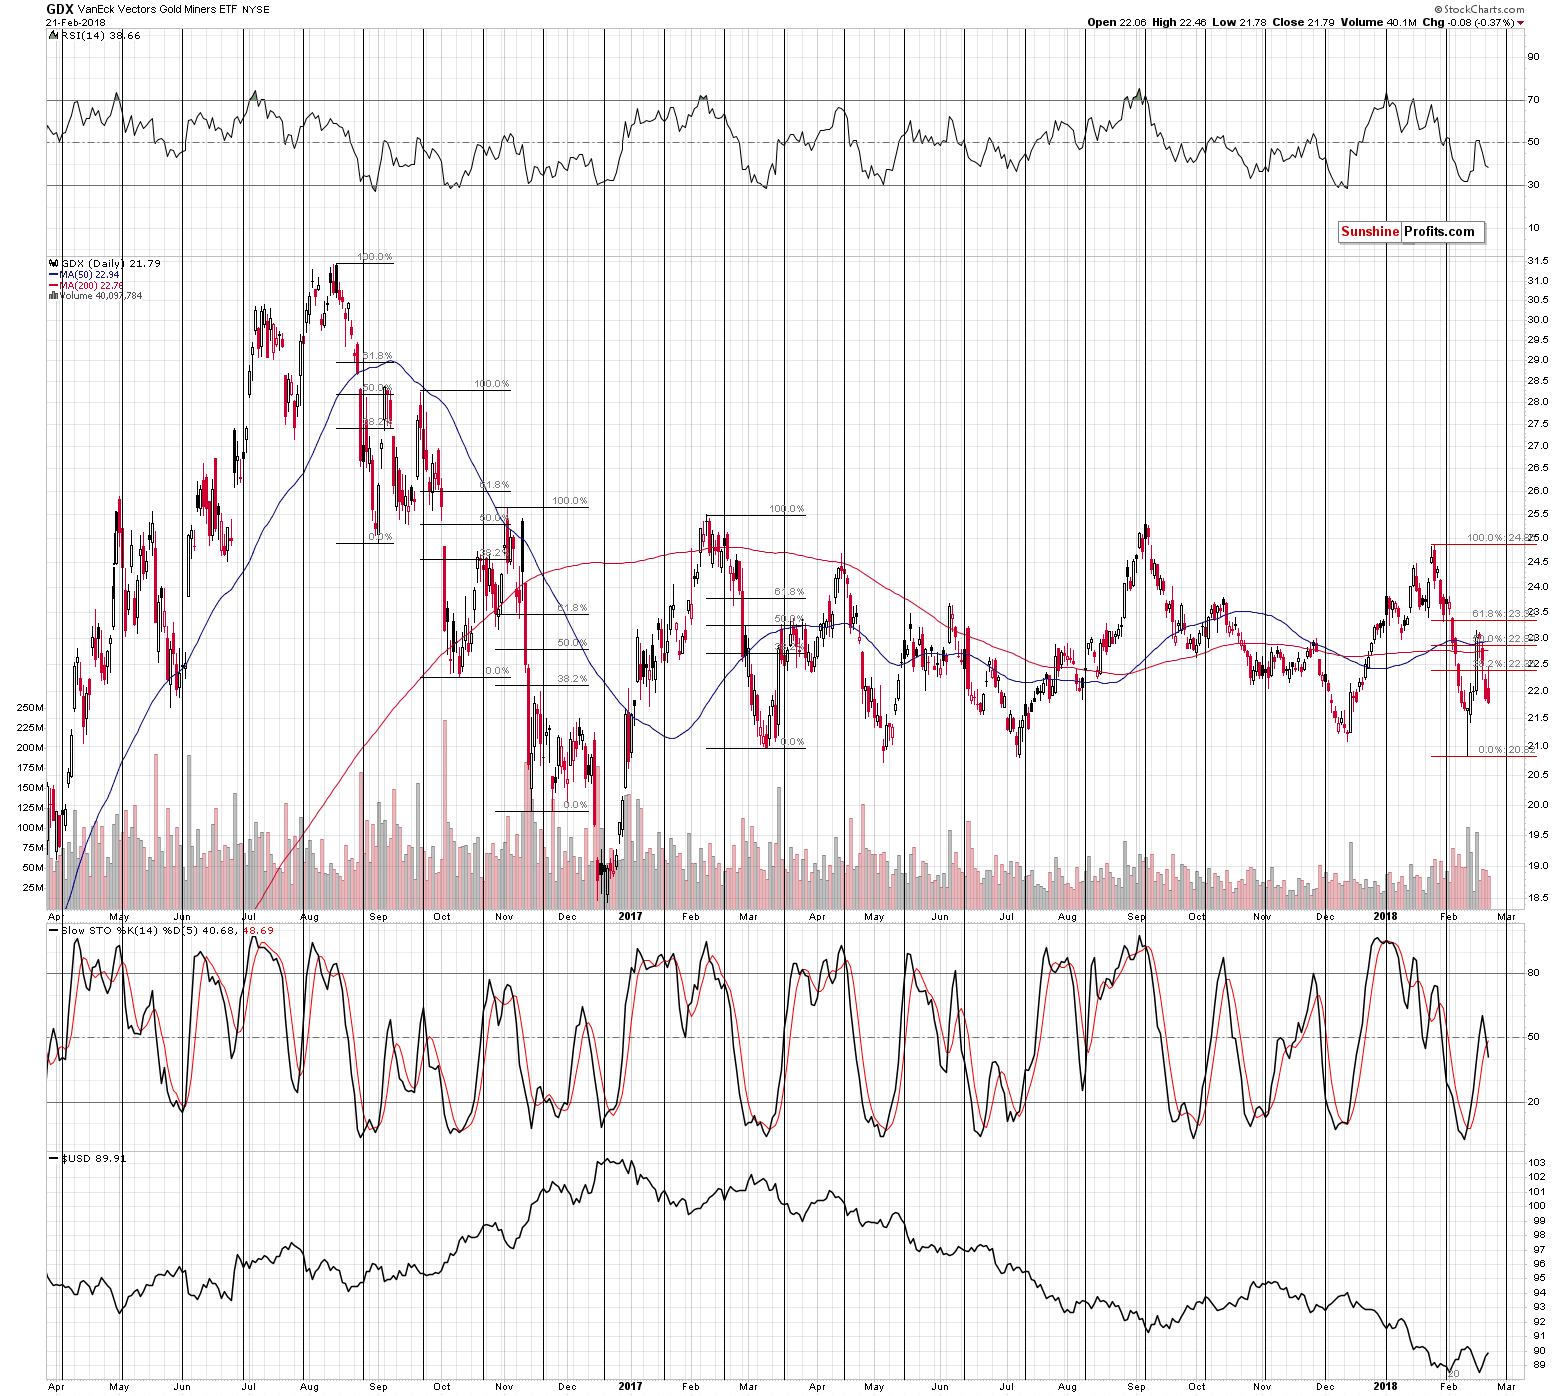
Mining stocks didn’t really underperform as they were following the general stock market both higher and lower. This kind of impact is temporary, but it made yesterday’s session difficult to analyze with regard to mining stocks’ relative valuation. Fortunately, the silver sign was very clear, so the overall implications were clear as well.
The above chart shows that mining stocks made another attempt to rally above the lowest of the Fibonacci retracement levels and failed even that, by closing lower despite the intraday rally.
Moreover, we have just seen a sell signal from the Stochastic indicator.
The outlook is clearly bearish for the medium term, but let’s keep in mind that we may see another rebound and temporary upswing as similar things happened during previous big declines.
So if that happens, we’ll drop the short positions and go long?
Perhaps. Perhaps not. We would need to see very powerful bullish forces to go long in this market environment. The reason is that the analogy to the 2012 – 2013 decline is well in place and back then trying to go long was not something that was justified by the risk to reward ratio (in hindsight). Please take a look at the chart below for details.
Gold’s Getting Tricky
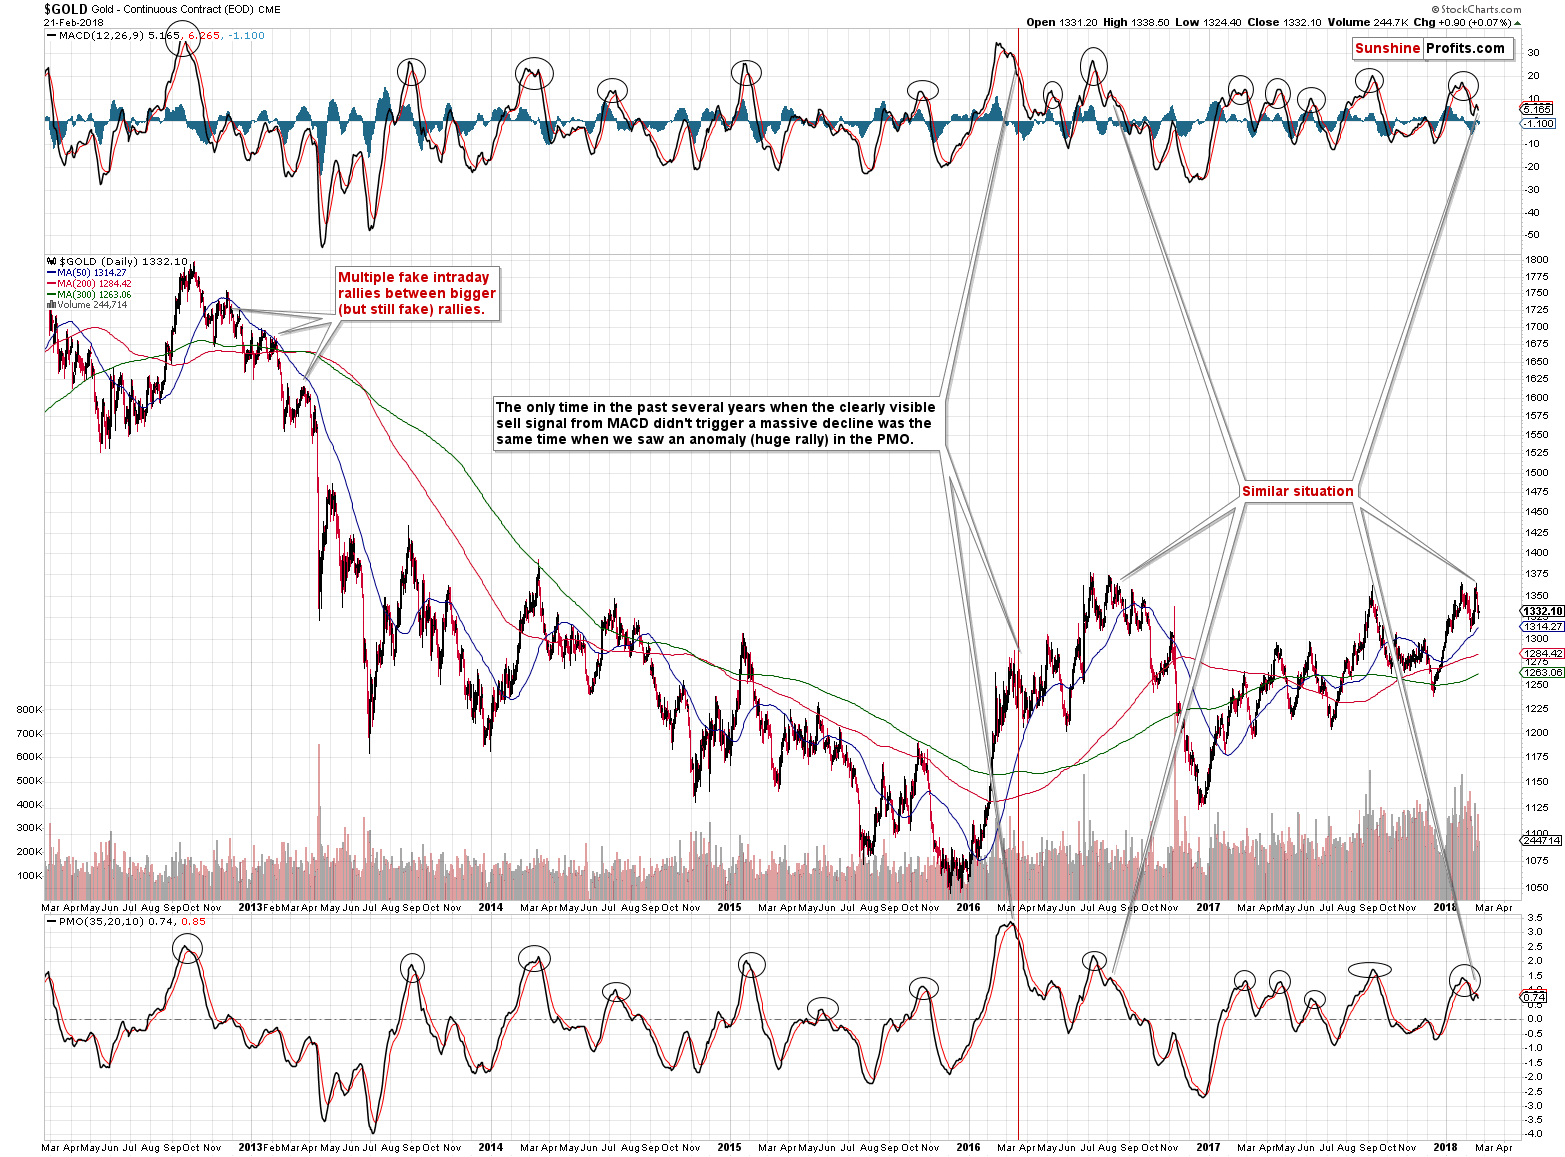
The late-2012 and early-2013 decline was extremely tricky to trade it, especially the beginning of February 2013. Gold was moving back and forth in a chaotic way. The sizes of intraday rallies were not necessarily alike and there were quick bigger moves in both directions – the beginning of 2013 serves as a very good example. One might have been lucky to trade in and out of this market once or twice, but overall it would have probably done more harm than good as it would have made one go long at the moments when gold appeared to be oversold from a very short-term point of view. The problem is that these times were exactly the times when gold started the biggest and most volatile declines. If positioned correctly, one would have gained the most from these moves – not from the few trades during gold’s very short-term or short-term consolidation.
Right before the biggest of the quick declines – in April 2013 – gold invalidated a breakdown, which is a classic buy signal. Going long was exactly the opposite of what was necessary to reap the biggest short-term trading profits of the decade.
But, was one able to clearly say that this invalidation of a breakdown was any different than other similar actions? Well, mining stocks had been underperforming in a very clear way at that time, which was a quite meaningful sign, but other than that, a lot seemed to point to higher gold prices, at least in the short term. And yet – gold plunged.
We are most likely seeing a repeat of the 2012 – 2013 decline, so we should be prepared for all these tricky attempts.
The Strategy for Gold’s Trickiness
We’re keeping this key context in mind and that’s why we didn’t entirely exit our short positions when the situation improved. Sure, we now know that the rally was quite big and it would have been ideal to drop the short positions and enter huge long ones, but it’s impossible to tell how tricky a given move is going to be in light of all that we wrote above. It might have been something like what we saw in April 2013 – after all, the USD is extremely oversold and it could soar suddenly, just like it did in 2008 or 2010.
Consequently, instead of being extreme in changing positions, we simply cut the profitable position in half and waited for a better moment to add to the position. As a result, we both took advantage of the rebound, and stayed prepared for a bigger and tricky downswing.
We didn’t let our guard down and at the same time we actually managed to deliver a well-placed punch by adding to the short position at higher prices.
We are not describing the above to simply boast about this trade. We’re describing it so that you can thoroughly understand the risks that we are facing from the market and to better understand our strategy in dealing with it, so that you are not surprised when something like the recent rebound happens in the future.
Naturally, the situation and our strategy will not always be like that as not all declines will be similar to the 2012 – 2013 one, but for now it seems the best way to go.
Before summarizing, we would like to provide you with an update on the currency market, as the situation in it will likely determine the PMs’ performance in the short- and medium term.
USD’s Outlook
In short, our yesterday’s comments on the short- and long-term charts remain up-to-date:
During Friday’s trading, the USD Index moved very insignificantly below the previous 2018 low and rallied back up, invalidating almost all breakdowns below important support levels. The remaining breakdown was invalidated yesterday in a clear way, so the outlook improved further.
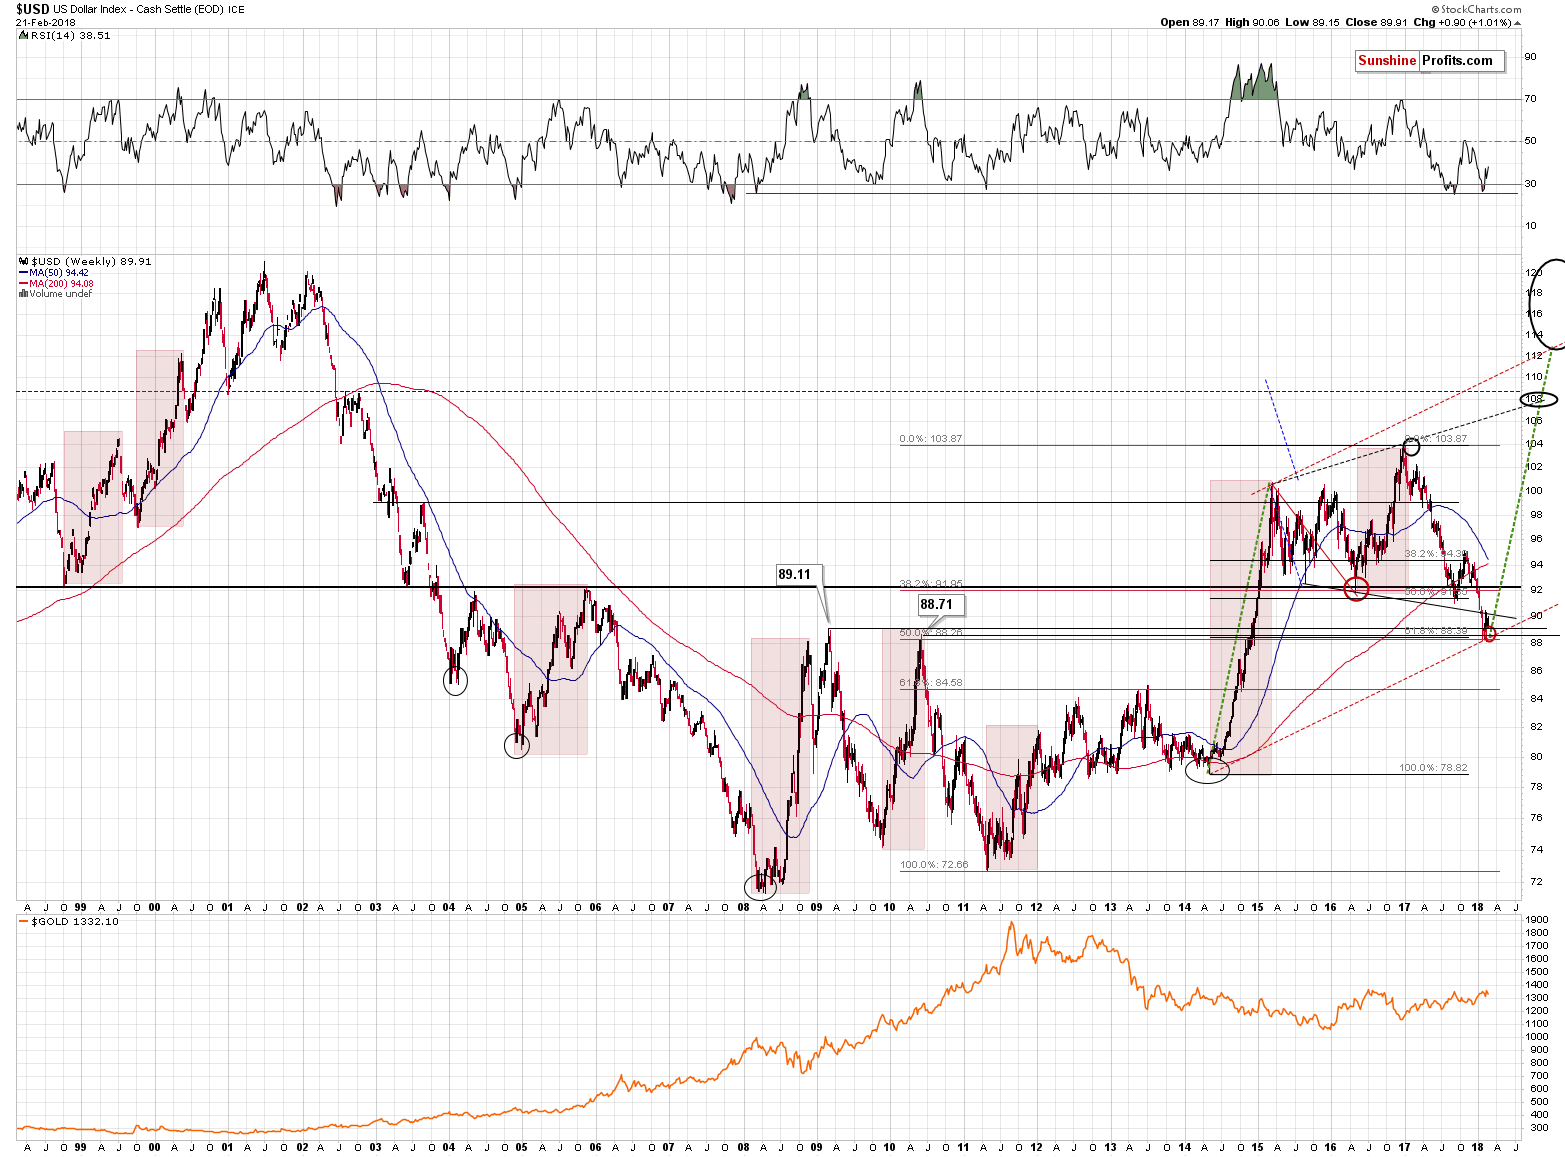
The chart above shows how significant the mentioned support levels actually are. Key tops and key Fibonacci retracements based on the key price extremes. Each of them is important and their combination is even more important. The same goes for the invalidation of breakdowns – the implications are bullish.
Please note that earlier this year the USD Index broke below the declining support / resistance line based on the mid-2015 and 2016 lows and this breakdown was verified recently. This is a bearish technical development, however, the combination of the 2009 and 2010 tops along with 2 major retracements based on major extremes (marked in red and black on the above chart) is much stronger than the mentioned declining line. The reason is that the mid-2015 and 2016 lows are less prominent than the 2009 and 2010 tops and the line based on the former is not strengthened by key Fibonacci retracements, while the latter is.
Consequently, the invalidation of breakdowns below the key, long-term support levels is far more important than the declining shorter-term line. That’s why, all in all, the outlook is bullish, but not bearish. At the moment of writing these words, the USD Index is trading at 89.82, so it’s very close to the mentioned line – it could even be the case that USD breaks decisively above 90 (the mentioned line is currently a bit above 90) later today. Actually, we hope that the 90 level doesn’t give up without a fight, but we expect that whether it happens shortly or in a week or so, the decisive breakout above 90 will be seen followed by a bigger rally.
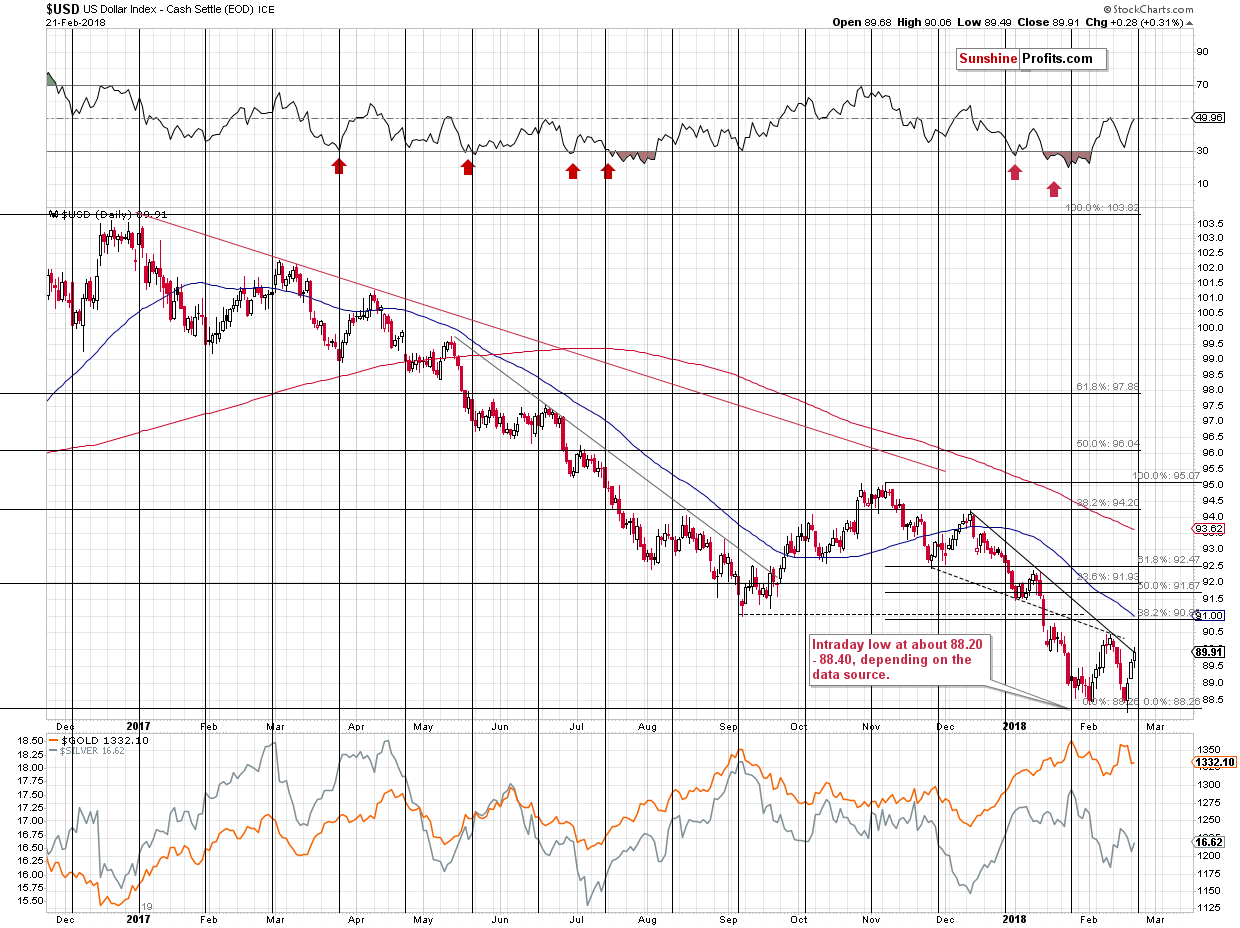
Let’s take a look at the mentioned line in greater detail.
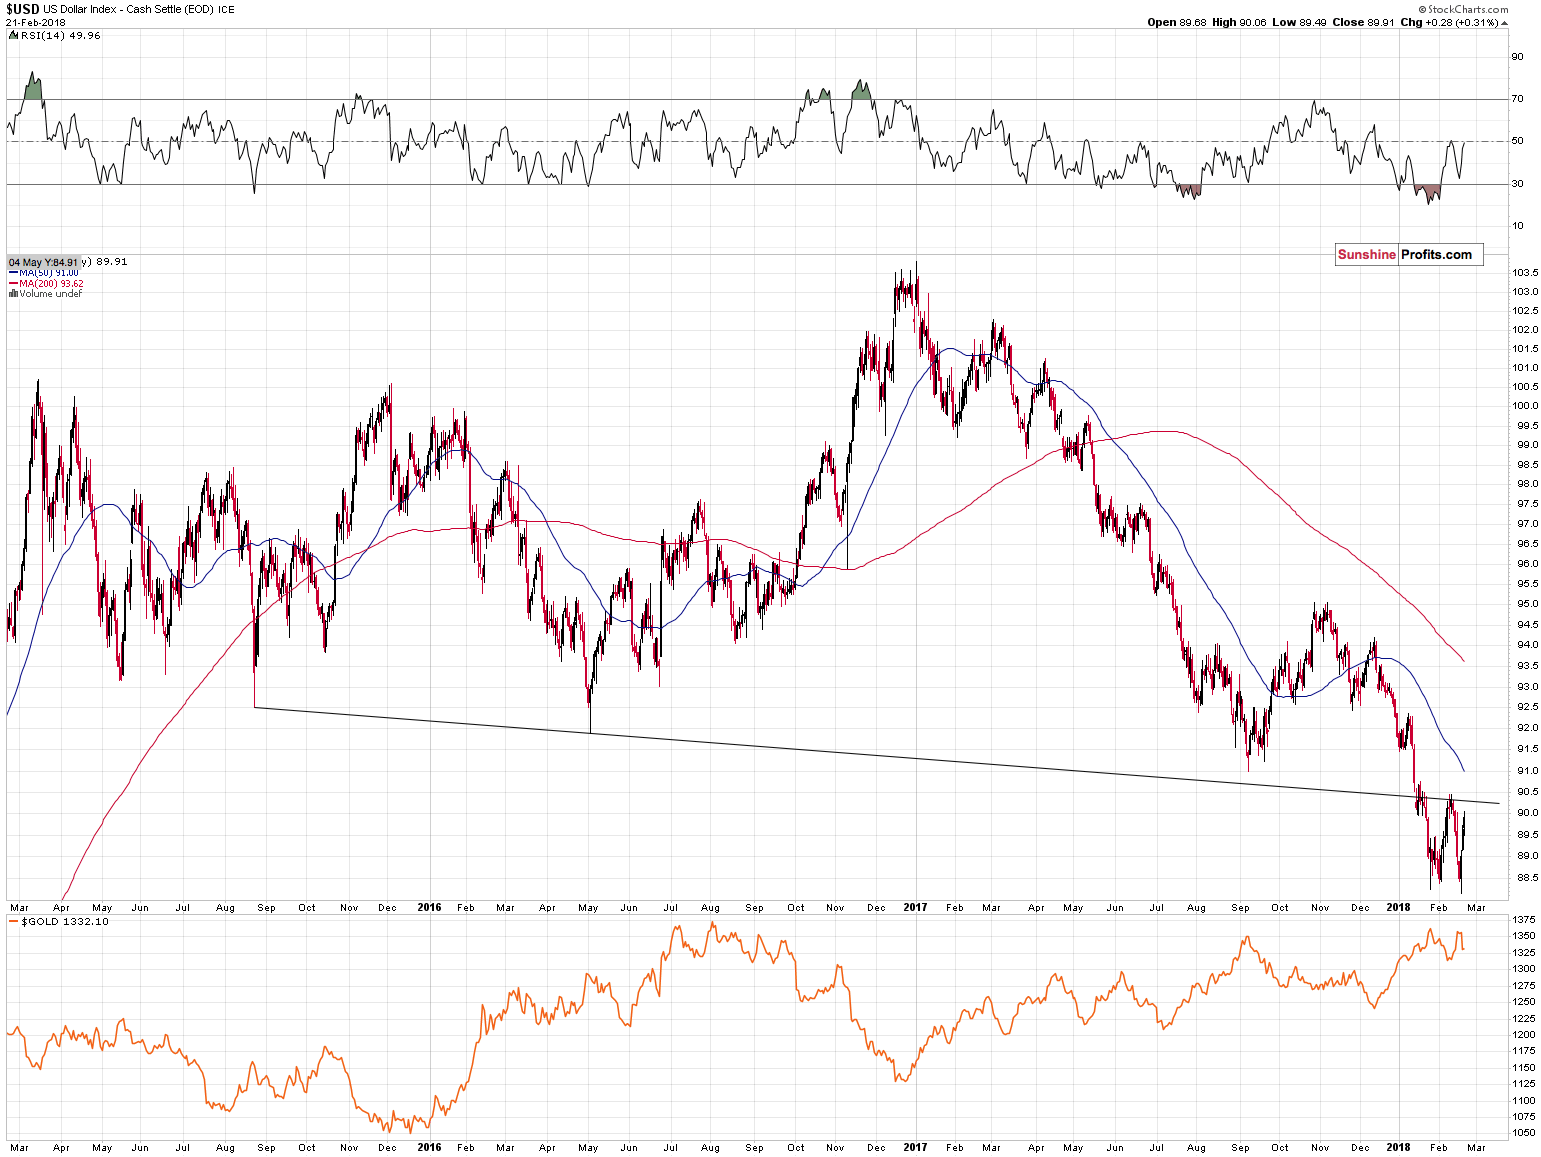
To be more precise: the declining support / resistance line is currently at about 90.20. Today’s pre-market high according to finance.yahoo.com is 90.24 and the current price at the moment of writing these words is 90.05. The USD Index is now fighting for a breakout. Still, if we see one, we won’t view the outlook as dramatically improved until the breakout is verified – preferably by a close above the previous February 2018 high (90.45).
There was already a failed attempt to move above this line, so we are skeptical toward a small breakout above it. After all, if the previous small breakout was followed by invalidation several days ago, it becomes unclear if the next breakout will be successful. We might see another small move lower or we might see a breakout right away. The latter is more probable, but based on the previous failed breakout, we wouldn’t dismiss something similar to it just yet. A confirmed breakout above 90.5 (approximation of the mentioned 90.45) will be a very good sign that the breakout above the support/resistance line is going to hold and that the final bottom is definitely in for the USD Index.
Summing up, the top in gold, silver and mining stocks is most likely in and the underperformance of mining stocks confirms it along with silver’s very quick outperformance that we saw yesterday. Moreover, since the USD Index just invalidated breakdowns below its key support levels, it’s likely to rally, which is likely to contribute to lower precious metals prices in the coming weeks.
As always, we will keep you – our subscribers – informed.
To summarize:
Trading capital (supplementary part of the portfolio; our opinion): Full short positions (150% of the full position) in gold, silver and mining stocks are justified from the risk/reward perspective with the following stop-loss orders and initial target price levels:
- Gold: initial target price: $1,218; stop-loss: $1,382; initial target price for the DGLD ETN: $53.98; stop-loss for the DGLD ETN $37.68
- Silver: initial target price: $14.63; stop-loss: $17.82; initial target price for the DSLV ETN: $33.88; stop-loss for the DSLV ETN $20.88
- Mining stocks (price levels for the GDX ETF): initial target price: $19.22; stop-loss: $26.14; initial target price for the DUST ETF: $39.88; stop-loss for the DUST ETF $15.78
In case one wants to bet on junior mining stocks' prices (we do not suggest doing so – we think senior mining stocks are more predictable in the case of short-term trades – if one wants to do it anyway, we provide the details), here are the stop-loss details and initial target prices:
- GDXJ ETF: initial target price: $27.82; stop-loss: $38.22
- JDST ETF: initial target price: $94.88 stop-loss: $37.78
Long-term capital (core part of the portfolio; our opinion): No positions (in other words: cash)
Insurance capital (core part of the portfolio; our opinion): Full position
Important Details for New Subscribers
Whether you already subscribed or not, we encourage you to find out how to make the most of our alerts and read our replies to the most common alert-and-gold-trading-related-questions.
Please note that the in the trading section we describe the situation for the day that the alert is posted. In other words, it we are writing about a speculative position, it means that it is up-to-date on the day it was posted. We are also featuring the initial target prices, so that you can decide whether keeping a position on a given day is something that is in tune with your approach (some moves are too small for medium-term traders and some might appear too big for day-traders).
Plus, you might want to read why our stop-loss orders are usually relatively far from the current price.
Please note that a full position doesn’t mean using all of the capital for a given trade. You will find details on our thoughts on gold portfolio structuring in the Key Insights section on our website.
As a reminder – “initial target price” means exactly that – an “initial” one, it’s not a price level at which we suggest closing positions. If this becomes the case (like it did in the previous trade) we will refer to these levels as levels of exit orders (exactly as we’ve done previously). Stop-loss levels, however, are naturally not “initial”, but something that, in our opinion, might be entered as an order.
Since it is impossible to synchronize target prices and stop-loss levels for all the ETFs and ETNs with the main markets that we provide these levels for (gold, silver and mining stocks – the GDX ETF), the stop-loss levels and target prices for other ETNs and ETF (among other: UGLD, DGLD, USLV, DSLV, NUGT, DUST, JNUG, JDST) are provided as supplementary, and not as “final”. This means that if a stop-loss or a target level is reached for any of the “additional instruments” (DGLD for instance), but not for the “main instrument” (gold in this case), we will view positions in both gold and DGLD as still open and the stop-loss for DGLD would have to be moved lower. On the other hand, if gold moves to a stop-loss level but DGLD doesn’t, then we will view both positions (in gold and DGLD) as closed. In other words, since it’s not possible to be 100% certain that each related instrument moves to a given level when the underlying instrument does, we can’t provide levels that would be binding. The levels that we do provide are our best estimate of the levels that will correspond to the levels in the underlying assets, but it will be the underlying assets that one will need to focus on regarding the signs pointing to closing a given position or keeping it open. We might adjust the levels in the “additional instruments” without adjusting the levels in the “main instruments”, which will simply mean that we have improved our estimation of these levels, not that we changed our outlook on the markets. We are already working on a tool that would update these levels on a daily basis for the most popular ETFs, ETNs and individual mining stocks.
Our preferred ways to invest in and to trade gold along with the reasoning can be found in the how to buy gold section. Additionally, our preferred ETFs and ETNs can be found in our Gold & Silver ETF Ranking.
As a reminder, Gold & Silver Trading Alerts are posted before or on each trading day (we usually post them before the opening bell, but we don't promise doing that each day). If there's anything urgent, we will send you an additional small alert before posting the main one.
=====
Latest Free Trading Alerts:
Are they? As usual, the FOMC minutes provoked diverse interpretations, both dovish and hawkish. Let’s analyze them, separating the wheat from the chaff. What do the recent minutes really mean for the gold market?
Gold Bulls, Brace Yourselves – Fed Hikes Are Coming!
The first part of yesterday's trading session was controlled by the bulls and the S&P 500 index was gaining ahead of the FOMC Minutes release at 2:00 p.m. Then the uptrend reversed and stocks fell below Tuesday's closing prices. Investors continued taking short-term profits off the table after week-long move up from previous Friday's lows. The market trades around 6% below its late January all-time high. Stocks are expected to open slightly higher today, but will they extend their yesterday's late session sell-off or bounce and continue trading within three-day-long consolidation?
Stocks Fail to Hold Gains, But Still No Correction
Since Friday, the USD Index extends increases and makes up for lost points. Looking at the daily chart you can even conclude that the bulls use every opportunity to push away their opponents from the recent lows. Why are they so important to them? We took a closer look at the situation and we already know the Achilles’ heel of the bulls. Do you also want to know it? We invite you to read today's alert.
Why Recent Lows Are Crucial for Greenback?
=====
Hand-picked precious-metals-related links:
PRECIOUS-Gold dips on higher prospect of rising U.S. interest rates
Gold Wavers as Fed's Economic Optimism Boosts Yields, Dollar
Fremont to acquire property in world’s second richest gold province
=====
In other news:
Fed points upwards for rates, world stocks lurch downward
Markets are getting it wrong on rising inflation, economist warns
Fed policymakers show rising confidence on inflation, economic outlook
Inside Uncle Sam's Secret Bitcoin Hoard
=====
Thank you.
Sincerely,
Przemyslaw Radomski, CFA
Founder, Editor-in-chief, Gold & Silver Fund Manager
Gold & Silver Trading Alerts
Forex Trading Alerts
Oil Investment Updates
Oil Trading Alerts

