

Briefly: In our opinion, full (150% of the regular full position) speculative short positions in gold, silver and mining stocks are justified from the risk/reward perspective at the moment of publishing this alert.
Today’s alert is going to be shorter than the previous ones (yesterday’s price moves were rather insignificant so there’s little for us to comment on), but there is something that we can comment on that we think you will find interesting – the updated roadmap for gold. Naturally the “roadmap” here doesn’t mean that we promise that gold will behave in this way or another – nobody can do that. However, based on the recent developments a certain course of action became more probable, while the likelihood of other scenarios declined.
Let’s take a look at the gold chart for details (chart courtesy of http://stockcharts.com).
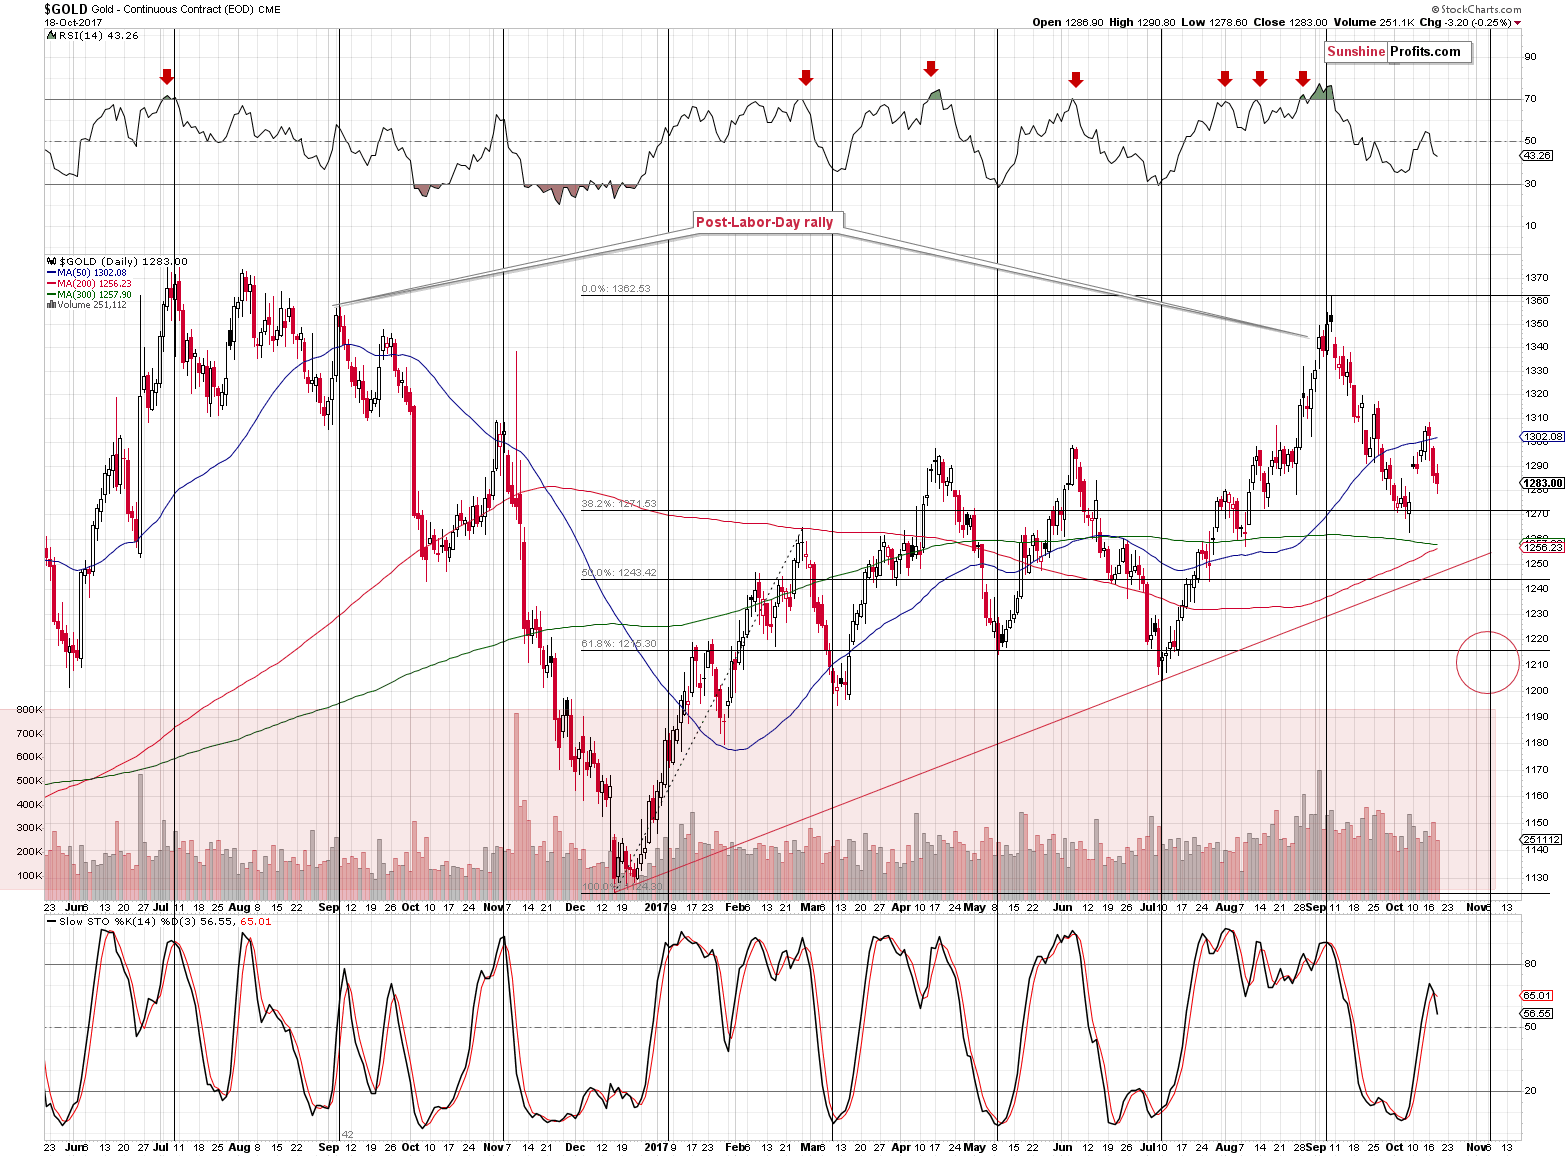
First of all, our previous comments on the above chart remain up-to-date:
The chart finally reflects the invalidation of the breakdown and since gold’s price is $1,281 at the moment of writing these words, it appears that the decline continues. The increase in the volume during yesterday’s decline confirms that this is the true direction in which the market is currently moving.
The sell signal from the Stochastic indicator is now crystal clear and the implications are bearish.
Now, moving on to the likely price path, let’s start with what’s not so likely anymore – a bigger correction from the 50% Fibonacci retracement level and/or the rising red support line. Both levels continue to provide support, but when gold reaches them, they are not likely to be perfectly aligned, and thus they will not necessarily confirm each other.
Moreover, gold is already after a visible weekly corrective upswing and thus it doesn’t need to cool down before another sizable move. Is it likely that in such an environment it would break below the previous lows to start another sizable (!) corrective action just $10-$20 below it? Not really. Gold could still move higher after reaching both levels, but it doesn’t seem that this upswing would be anything more than a daily or 2-day event.
What seems much more likely is gold’s continuation lower and a move toward the $1,200 - $1,220 range. This level is something that could trigger another visible upswing and this could be the final upswing before gold takes an even deeper dive, declining to the 2015 lows. The latter is not yet crystal clear, so let’s focus on the first part of the move for now.
Below the previously mentioned $1,240 - $1,250 range, there is no significant support that could stop the rally before the $1,200 - $1,220 area, but that’s not all that makes the latter a likely target.
One thing is the usual pace at which gold declines (note gold’s declines in March, May and June 2017 and in November 2016) and the existence of gold’s turning point close to November 6th – they correspond to each other with gold at about $1,200 - $1,220.
Another thing is the analogy to the likely decline in mining stocks.
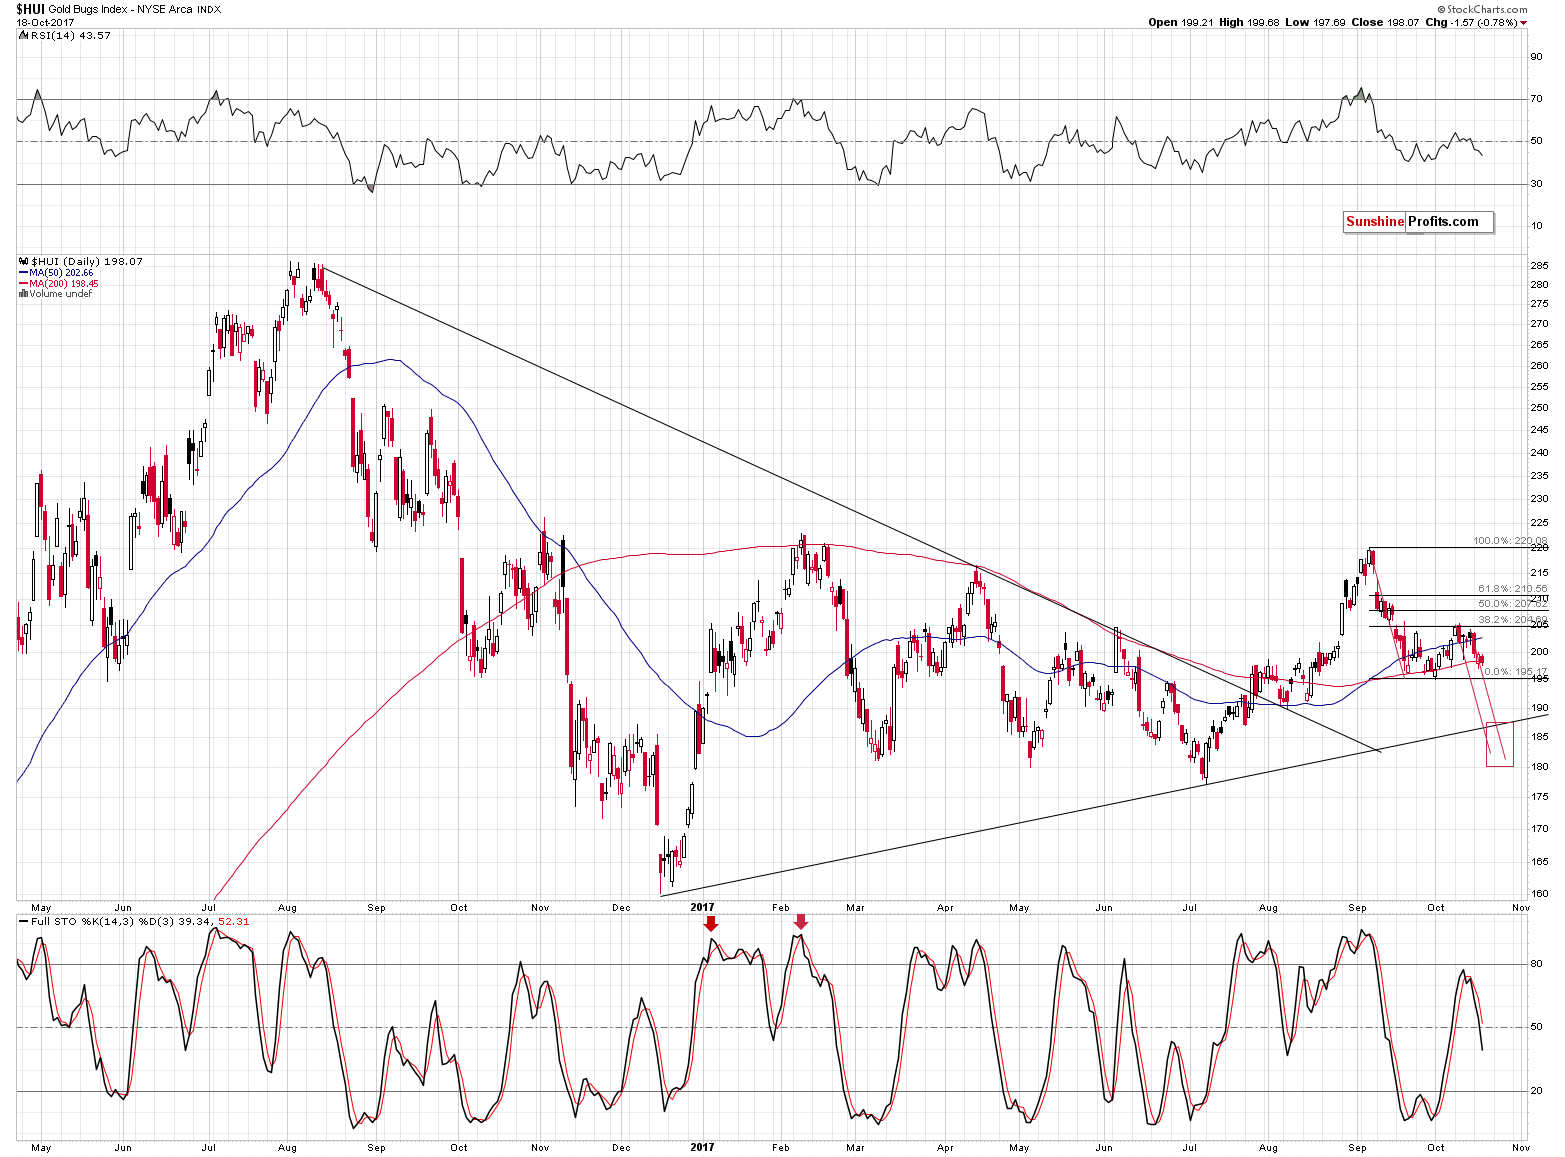
If gold stocks are likely to move to their July, May and March lows, then the same is quite likely for gold.
What’s even more interesting, we get an analogous price projection based on the USD Index.
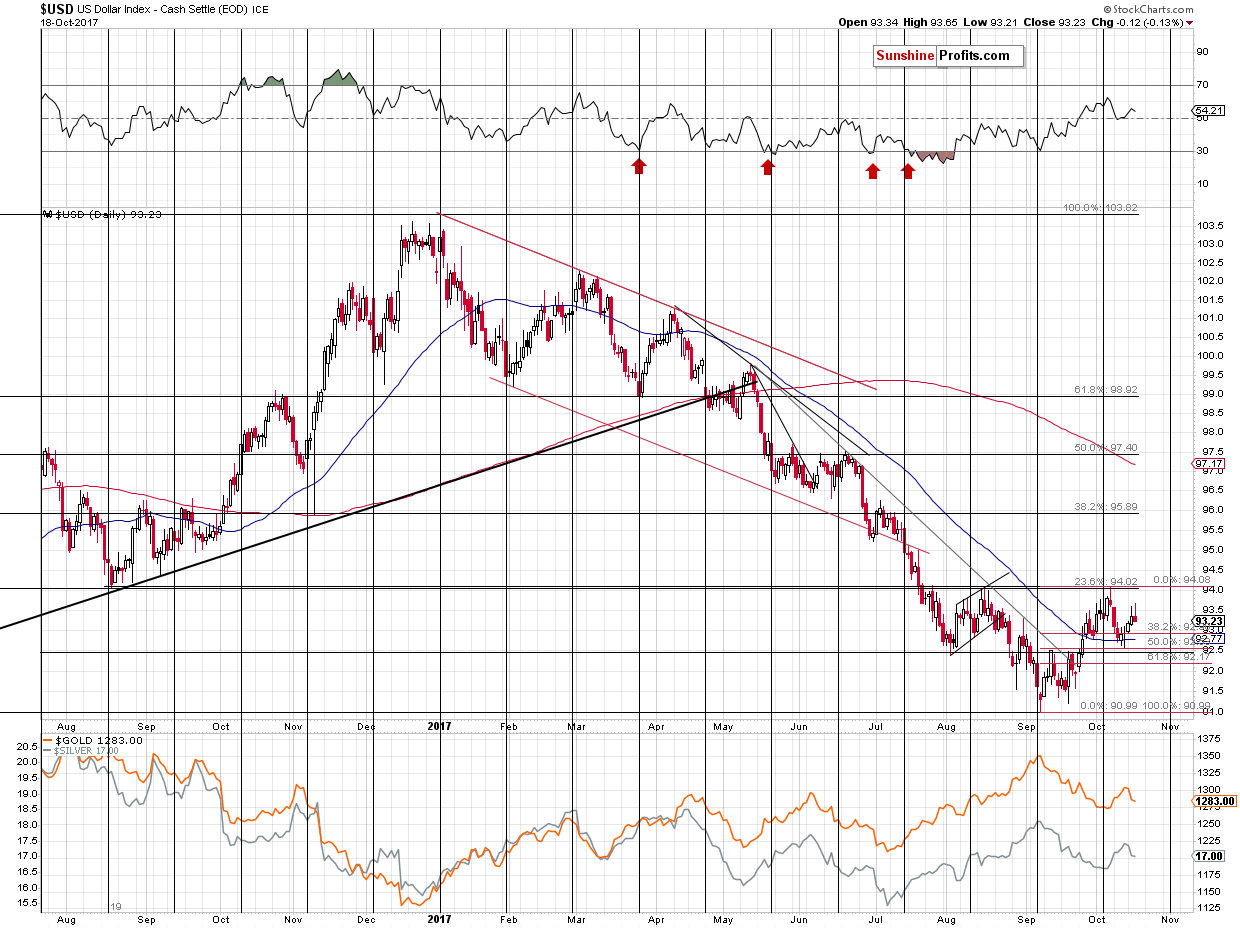
In this case one needs to be careful when applying the analogies, because the gold-USD link could deviate from its regular behavior (i.e. gold could rally along with the USD or decline along with the USD). So, let’s stick to the most recent data.
In yesterday’s alert we wrote the following:
If the 94 level is broken and the breakout is confirmed, the USD Index will be likely to rally rather quickly based on the reverse head-and-shoulders formation (August and October lows being the shoulders) to the 96 – 97.5 area. The implications for gold would be bearish.
In other words, we expect the USD Index to rally by approximately the same amount it rallied from the September low to the October high, starting at the 94 level. At this time, the USD Index is well below this level, so the likely size of the upswing is greater than the September – early October one. In analogy, if gold was to decline below the September low and then decline by more or less as much as it did from September to early October, it would be likely to move to $1,170 - $1,200. That’s still more or less in tune with the price target for gold that we described earlier.
Please note that the USD Index has resistance in the form of the previous lows and an intraday high at about 96.5 – if it moves to this level, gold could move to upper part of the $1,200-$1,220 target range.
All in all, the exact price targets based on this link are not clear, but on an approximate basis, the $1,200 - $1,220 range is well in tune with what’s going on in the USD Index.
Summing up, it seems that the top in gold, silver and mining stocks is already in. Multiple bearish signals (i.a. gold’s huge monthly volume, the analogy in the HUI Index, the analogy between the two most recent series of interest rate hikes, and a breakout in Nikkei) point to much lower gold prices in the following months and the short-term signals also confirm the bearish outlook.
As far as the following weeks are concerned, it seems that we could see another rebound during the decline, but not likely until gold moves to the $1,200 - $1,220 range, which is likely to take place in the first half of November.
As always, we will keep you – our subscribers – informed.
To summarize:
Trading capital (supplementary part of the portfolio; our opinion): Short positions (150% of the full position) in gold, silver and mining stocks are justified from the risk/reward perspective with the following stop-loss orders and initial target price levels / profit-take orders:
- Gold: initial target price level: $1,063; stop-loss: $1,366; initial target price for the DGLD ETN: $81.88; stop-loss for the DGLD ETN $38.74
- Silver: initial target price: $13.12; stop-loss: $19.22; initial target price for the DSLV ETN: $46.18; stop-loss for the DSLV ETN $17.93
- Mining stocks (price levels for the GDX ETF): initial target price: $9.34; stop-loss: $26.34; initial target price for the DUST ETF: $143.56; stop-loss for the DUST ETF $21.37
In case one wants to bet on junior mining stocks' prices (we do not suggest doing so – we think senior mining stocks are more predictable in the case of short-term trades – if one wants to do it anyway, we provide the details), here are the stop-loss details and initial target prices:
- GDXJ ETF: initial target price: $14.13; stop-loss: $45.31
- JDST ETF: initial target price: $417.04; stop-loss: $43.12
Long-term capital (core part of the portfolio; our opinion): No positions (in other words: cash)
Insurance capital (core part of the portfolio; our opinion): Full position
Important Details for New Subscribers
Whether you already subscribed or not, we encourage you to find out how to make the most of our alerts and read our replies to the most common alert-and-gold-trading-related-questions.
Please note that the in the trading section we describe the situation for the day that the alert is posted. In other words, it we are writing about a speculative position, it means that it is up-to-date on the day it was posted. We are also featuring the initial target prices, so that you can decide whether keeping a position on a given day is something that is in tune with your approach (some moves are too small for medium-term traders and some might appear too big for day-traders).
Plus, you might want to read why our stop-loss orders are usually relatively far from the current price.
Please note that a full position doesn’t mean using all of the capital for a given trade. You will find details on our thoughts on gold portfolio structuring in the Key Insights section on our website.
As a reminder – “initial target price” means exactly that – an “initial” one, it’s not a price level at which we suggest closing positions. If this becomes the case (like it did in the previous trade) we will refer to these levels as levels of exit orders (exactly as we’ve done previously). Stop-loss levels, however, are naturally not “initial”, but something that, in our opinion, might be entered as an order.
Since it is impossible to synchronize target prices and stop-loss levels for all the ETFs and ETNs with the main markets that we provide these levels for (gold, silver and mining stocks – the GDX ETF), the stop-loss levels and target prices for other ETNs and ETF (among other: UGLD, DGLD, USLV, DSLV, NUGT, DUST, JNUG, JDST) are provided as supplementary, and not as “final”. This means that if a stop-loss or a target level is reached for any of the “additional instruments” (DGLD for instance), but not for the “main instrument” (gold in this case), we will view positions in both gold and DGLD as still open and the stop-loss for DGLD would have to be moved lower. On the other hand, if gold moves to a stop-loss level but DGLD doesn’t, then we will view both positions (in gold and DGLD) as closed. In other words, since it’s not possible to be 100% certain that each related instrument moves to a given level when the underlying instrument does, we can’t provide levels that would be binding. The levels that we do provide are our best estimate of the levels that will correspond to the levels in the underlying assets, but it will be the underlying assets that one will need to focus on regarding the signs pointing to closing a given position or keeping it open. We might adjust the levels in the “additional instruments” without adjusting the levels in the “main instruments”, which will simply mean that we have improved our estimation of these levels, not that we changed our outlook on the markets. We are already working on a tool that would update these levels on a daily basis for the most popular ETFs, ETNs and individual mining stocks.
Our preferred ways to invest in and to trade gold along with the reasoning can be found in the how to buy gold section. Additionally, our preferred ETFs and ETNs can be found in our Gold & Silver ETF Ranking.
As a reminder, Gold & Silver Trading Alerts are posted before or on each trading day (we usually post them before the opening bell, but we don't promise doing that each day). If there's anything urgent, we will send you an additional small alert before posting the main one.
=====
Latest Free Trading Alerts:
This week, quite a few interesting things happened. How could they affect the gold market?
Tax Reform, Beige Book, Fed Chief, and Gold
S&P 500 index gained 0.1% on Wednesday, after reaching new record high, slightly above Tuesday's record. Expectations before the opening of today's trading session are negative, but will they lead to a downward correction?
Negative Expectations, Will Stock Market Correct?
=====
Hand-picked precious-metals-related links:
PRECIOUS-Gold hits over 1-week low as dollar holds firm
India ‘Formalizes’ Gold Trade With First Ever Gold Options Contract
India Tightens Gold-Import Rules to Curb Trade Irregularities
Scotiabank to offload gold trading unit
First Majestic Silver output climbs
AngloGold Sells Mines to Cut Losses, Halving South Africa Output
=====
In other news:
European Stocks Fall, Wall Street Futures Slip As Spain Invokes Catalan Rule
Dow closes above 23,000 as IBM surges
China's central bank just warned of a sudden collapse in asset prices
Stock market crash inevitable, financial historian says
=====
Thank you.
Sincerely,
Przemyslaw Radomski, CFA
Founder, Editor-in-chief, Gold & Silver Fund Manager
Gold & Silver Trading Alerts
Forex Trading Alerts
Oil Investment Updates
Oil Trading Alerts

