

Briefly: In our opinion, full (150% of the regular full position) speculative short positions in gold, silver and mining stocks are justified from the risk/reward perspective at the moment of publishing this alert.
The last couple of years and – in particular – the last couple of months were very difficult for gold traders – i.e. they were boring. Despite several huge daily price swings, the precious metals market has not been going anywhere, moving in and around the $1,100 - $1,300 price range. Gold got to the point where this lack of volatility is by itself an extreme sign pointing to a much bigger price swing in the market, as the periods of very high and very low volatility tend to follow each other. Gold seems to have once again topped after moving to a long-term resistance line and the previous highs. Will the upcoming decline be any different than the previous local downswings that were simply followed by yet another rally up to $1,300?
This time could really be different and in the following paragraphs we explain why. Let’s start with gold’s long-term chart (chart courtesy of http://stockcharts.com).
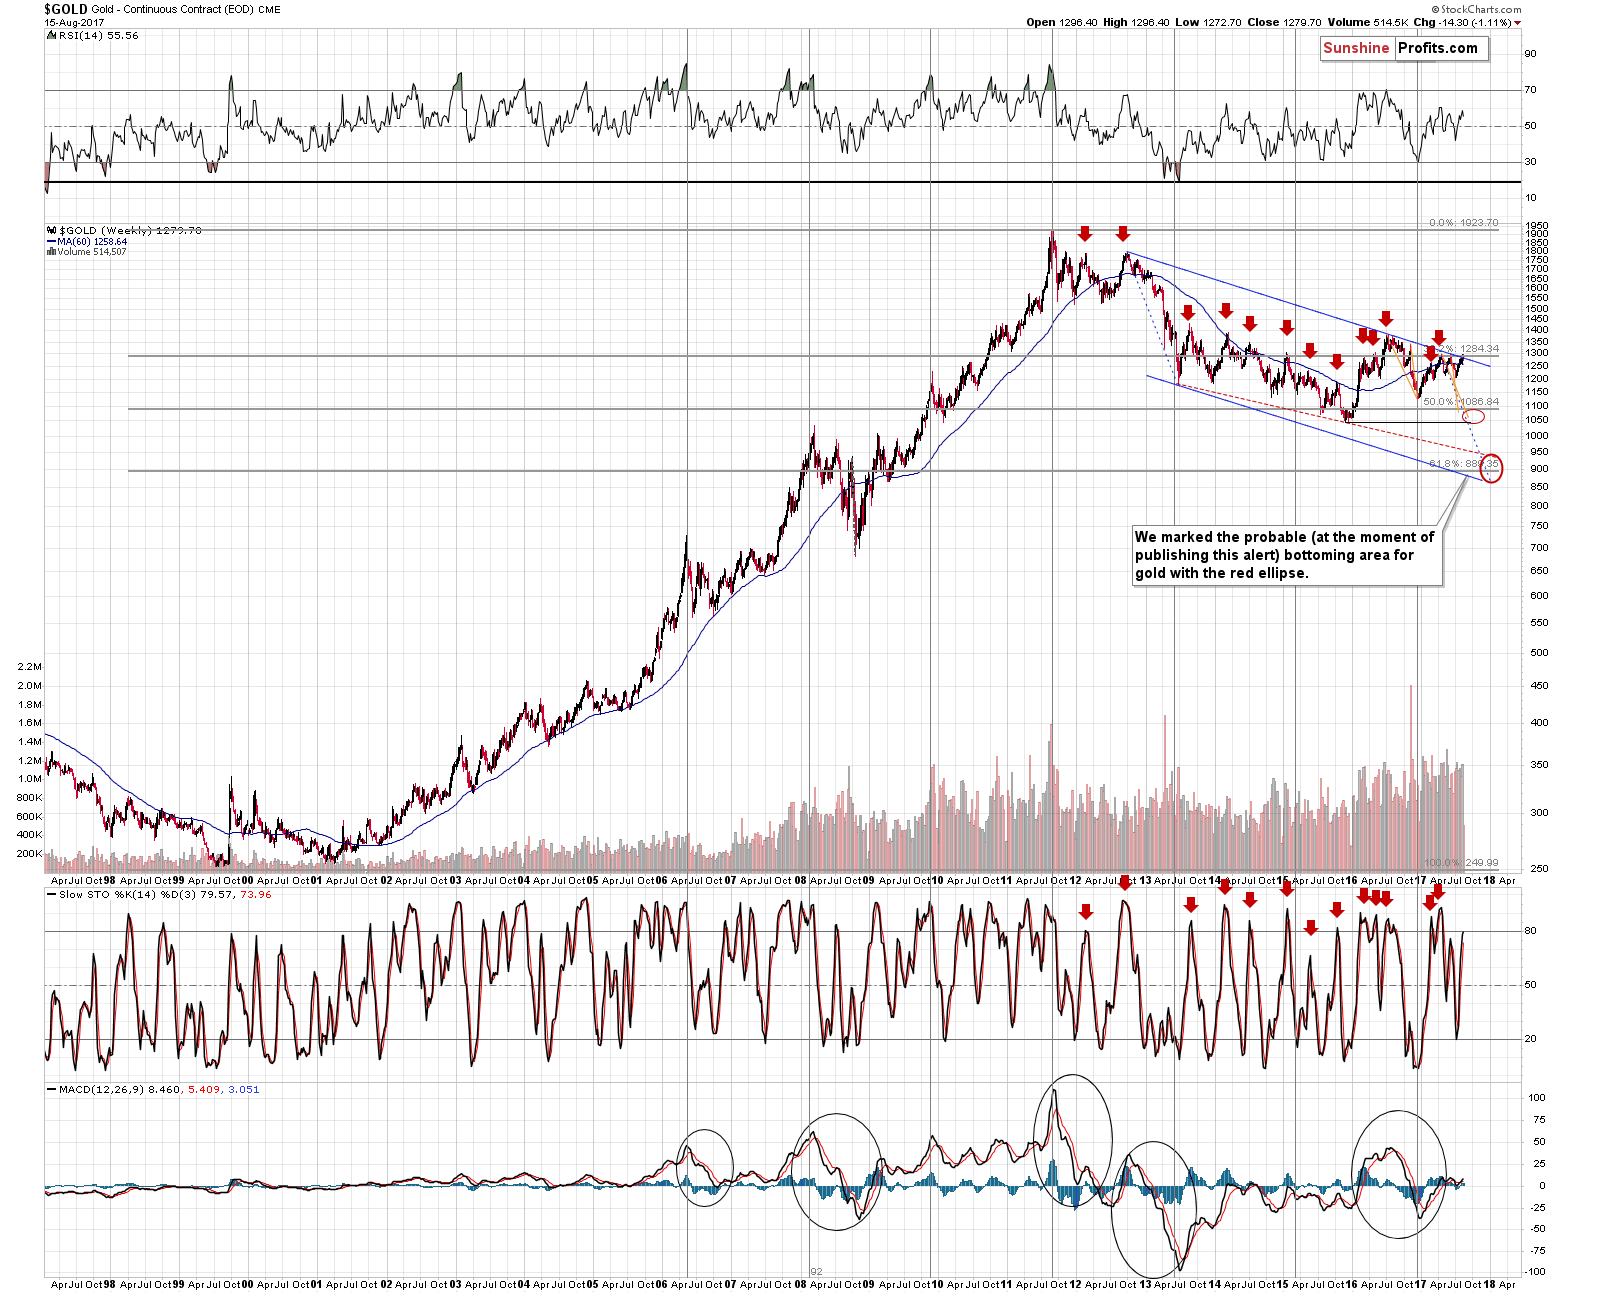
The resistance line is based on the 2012 and 2016 tops. Since both of them are very important from the long-term point of view, the resistance line is also very important. This line, along with the previous 2017 tops seems to have stopped the rally – at the moment of writing these words, gold is back below $1,270.
You can see the proximity of the previous tops more clearly on the short-term chart.
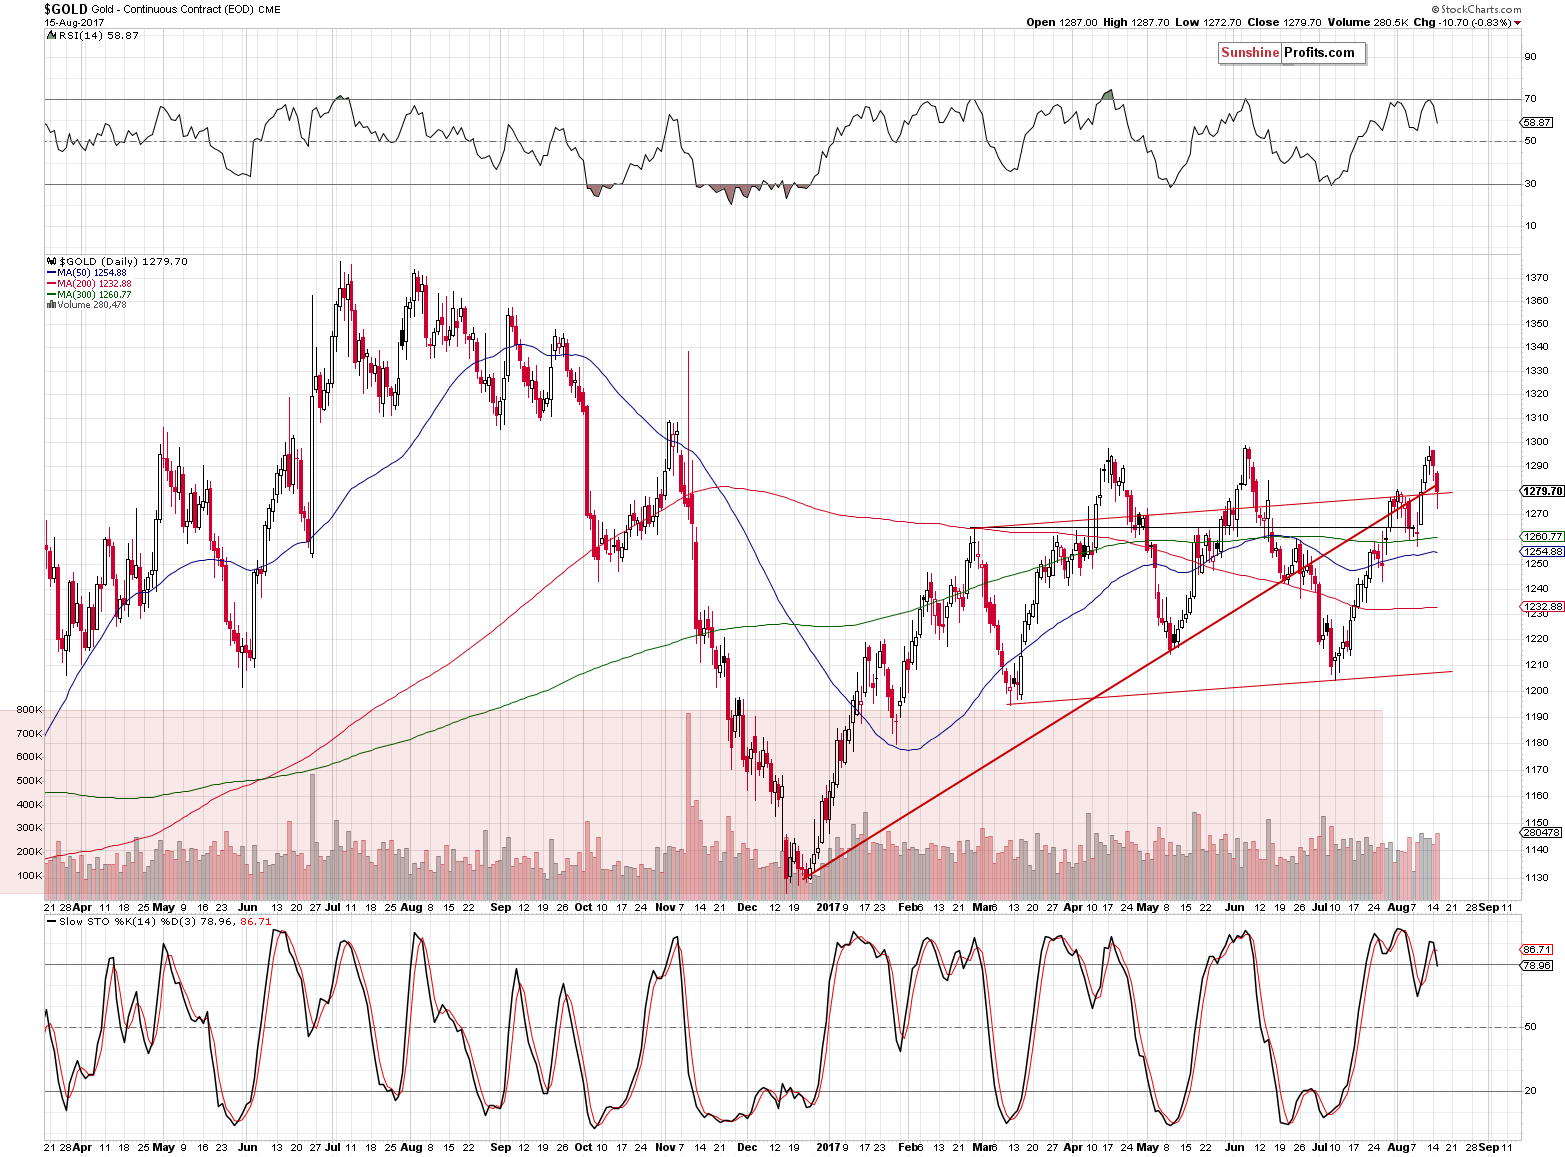
As discussed above, gold is currently a few dollars below the $1,270 level, which means that the yellow metal moved back below the rising red support line, the early August high and that the April and June highs were likely successful in stopping the rally.
The bearish outlook is further confirmed by the RSI indicator – the gold RSI was just at the 70 level which is a classic sell signal – gold’s tops followed quite often after such readings. The same goes for the sell signal from the Stochastic indicator – the latter moved below its red signal line, which is a classic confirmation of a top.
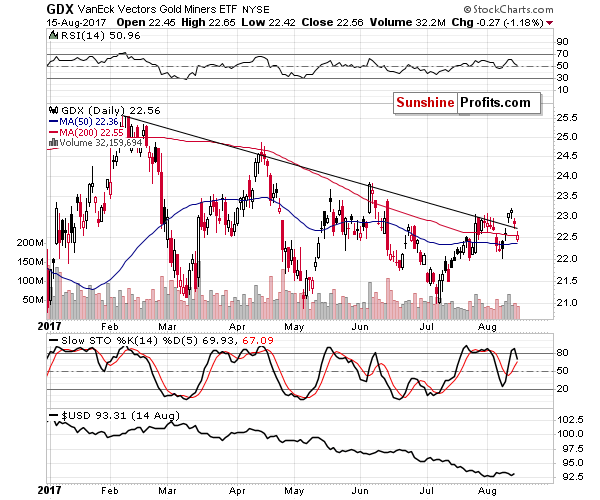
Based on yesterday’s session, we have seen a new important sell signal for the following weeks – the invalidation of a small breakout in the case of mining stocks (the GDX ETF serves as a proxy here).
Miners gave gold bulls false hope for a sustainable rally, but the bullish implications are all gone based on yesterday’s invalidation – in fact, the invalidation by itself serves as a strong sell signal.
Increased geopolitical tensions regarding North Korea were the likely reason for the small breakout in the first place. As we explained numerous times, the impact of geopolitical tensions on gold is rarely a lasting factor – things usually get back to the normal course of action relatively soon. This seems to have been the case one more time and the fact that miners were not able to hold the gains despite a good reason to do so (after all, nuclear tensions are a rather important issue), shows that the market is not ready to move higher.
What we have written so far today has important bearish implications for the following weeks, but it doesn’t say anything regarding the size of the decline. In particular, the above doesn’t indicate whether this time the decline will be able to take gold below the 2017, 2016, and – ultimately – the 2015 lows.
Still, exactly this kind of decline might have just begun.
The above chart shows gold’s volatility. Putting aside the very recent upswing, it’s been trading below the previous years’ lows, which is another way of saying that the gold market has not been this boring in a long time. This is not something that should make you give up on it, but rather something that should make you pay extra attention to gold’s actions as what we’ve been seeing recently is quite likely the calm before the storm.
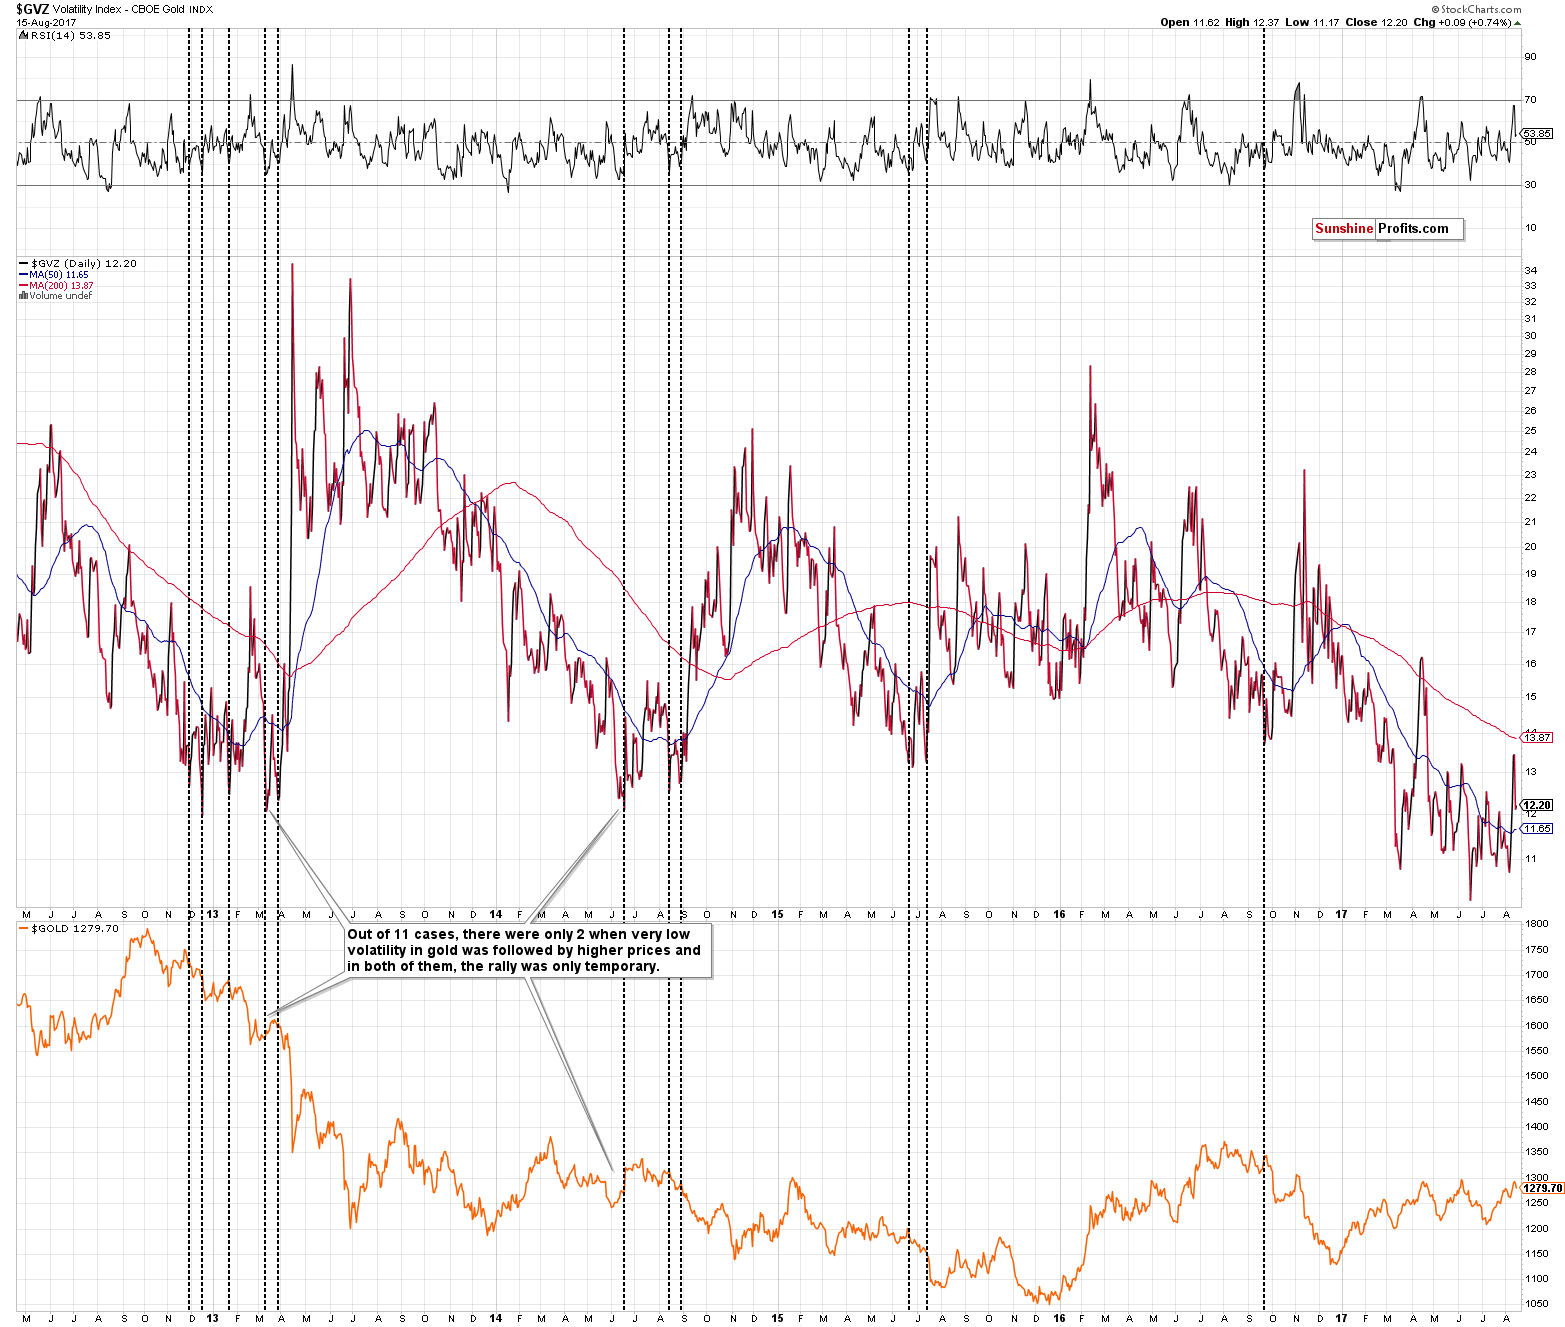
The chart below shows a bigger history of the same phenomenon.
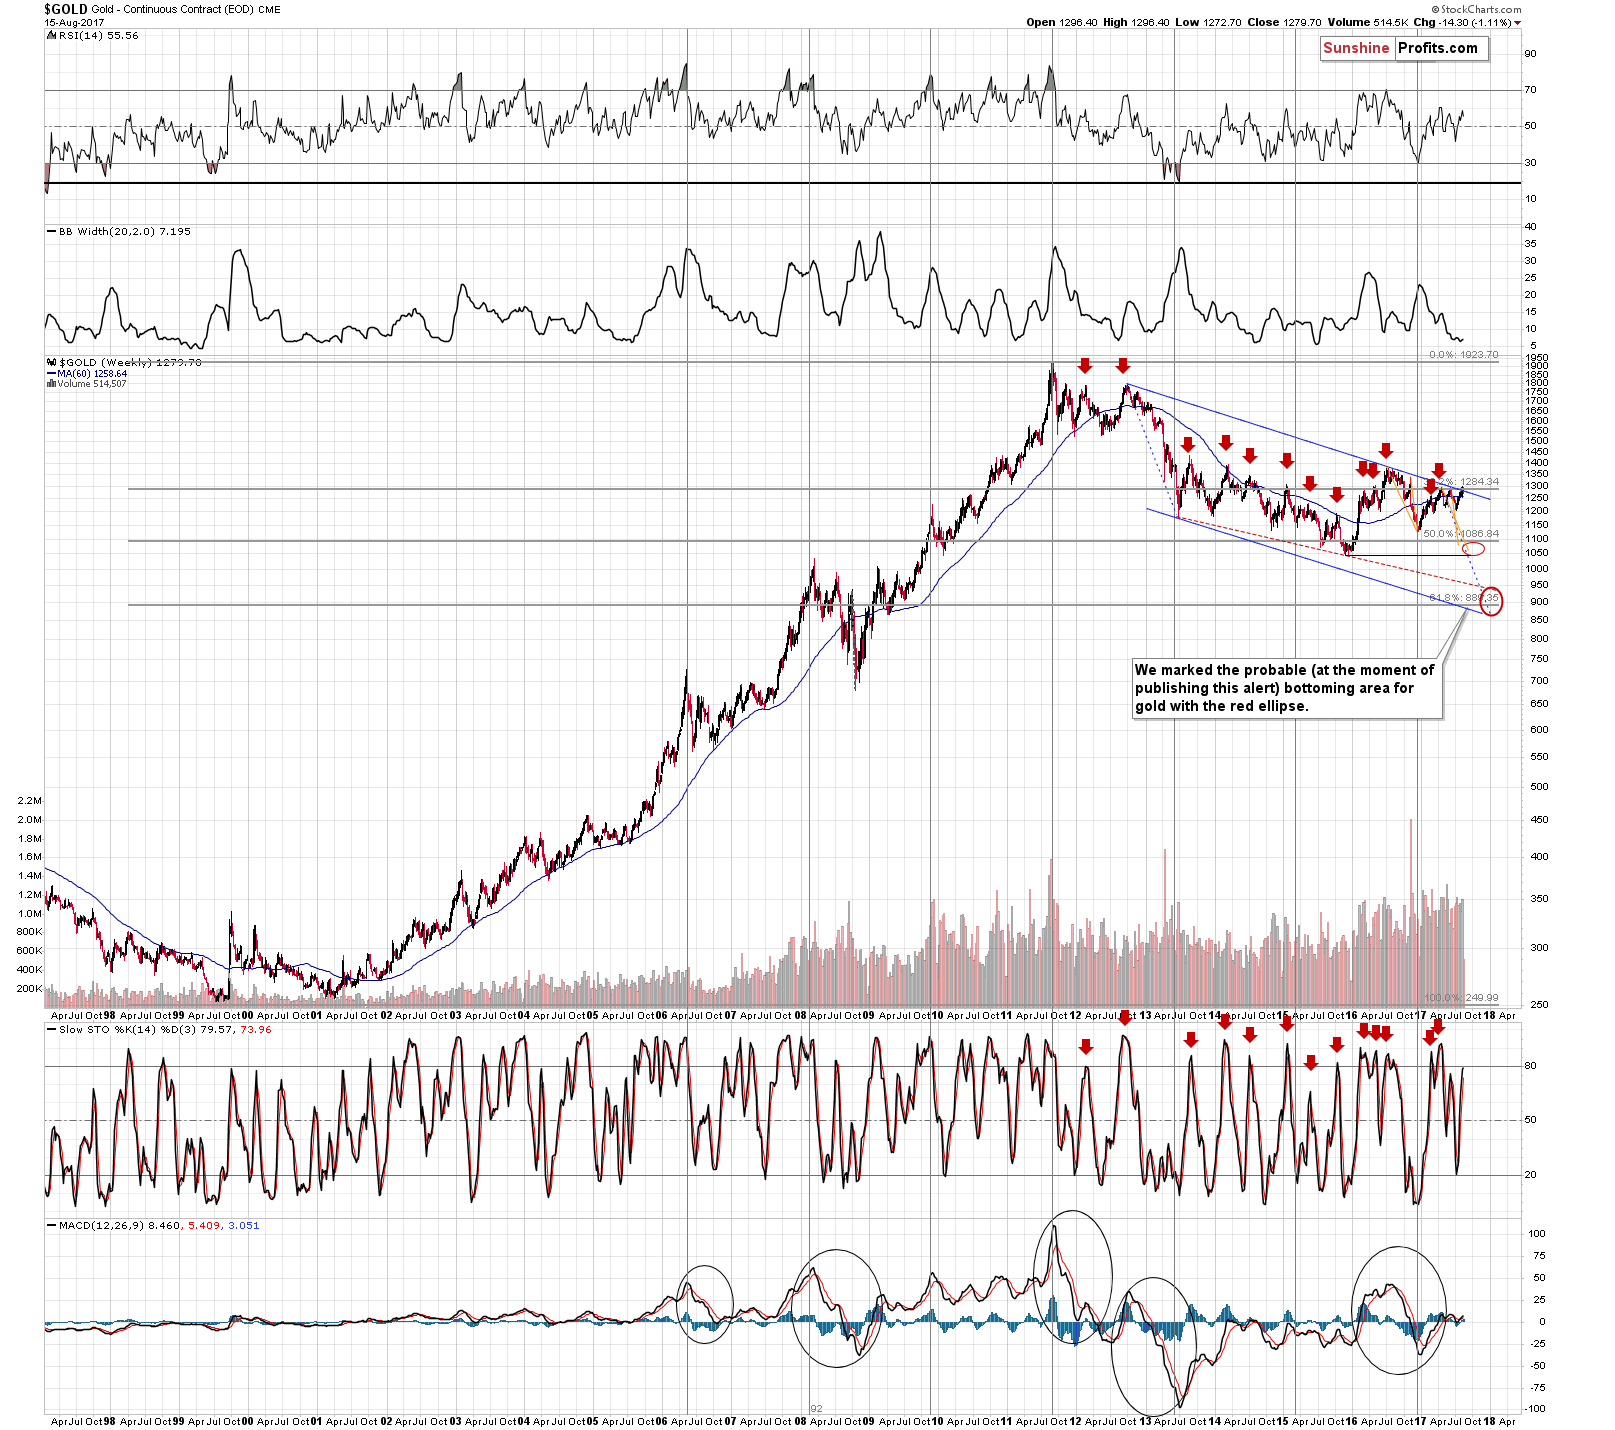
Right above the price chart, we added the Bollinger Band’s Width indicator, which is a proxy for an asset’s (here: gold’s) volatility. As you can see, the major bottoms in the indicator and in the gold volatility index correspond to each other.
What happened after volatility moved to the very low levels and stayed there for a considerable amount of time? A huge move usually followed. The 1999 bottom, the 2002-2003 spike, the 2005-2006 rally, the 2007-2008 rally, the mid-2012 rally, the huge 2013 slide, the mid-2014 slide, the mid-2015 slide were all preceded by extremely low volatility, similar to the one that we’re experiencing right now.
To be clear, the above – by itself – is not enough to say that gold will move below its previous lows this time, but it very strongly suggests that such a move is likely to happen sooner rather than later and that this is not the time to stop paying attention to what’s going on in gold.
The thing that makes a huge difference this time is the situation in the USD Index.
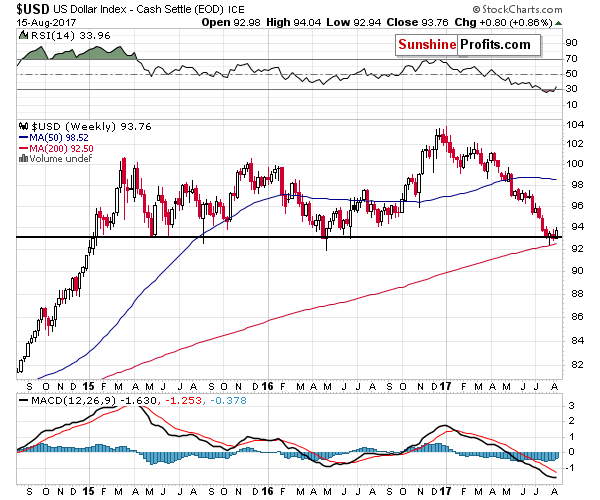
In the July 31 Gold & Silver Trading Alert, we wrote the following on the above chart:
The USD Index closed the week in tune with the 2015 and 2016 bottoms. Both previous bottoms took place close to the middle of the year, so the timing for the current move lower also supports that reversal theory.
The USD Index reached the previous weekly bottoms and it suggests that the bottom is in – in weekly terms. In other words, this week’s closing price is very likely to be higher than 93.11. What the above does not say is how the USD Index will perform before the end of the week – even if we saw a temporary downswing to about 92 and then a big comeback (just like the one we saw in 2016 after the weekly bottom), it would still not invalidate the bullish implications or the analogy in general.
The situation developed in tune with our expectations – the USD moved a bit lower, but reversed and ended the week higher. It’s also higher this week, trading at about 94 at the moment of writing these words. The bottom in the USD Index seems to be in. The implications thereof are particularly significant, because gold has generally refused to follow in the USD’s footsteps earlier this year – the latter has declined for the entire 2017, while gold moved higher only in the first quarter – it’s been moving back and forth since that time, ignoring the big moves in the USD.
If gold has been refusing to rally following one of its key drivers, this strongly suggests that the yellow metal “wants to move” in the opposite direction. The USD’s continued and accelerating decline made it impossible for gold to move in tune with its current major trend. However, if the USD Index has bottomed – and it seems to be the case – then gold may be ready for a massive decline in the coming weeks.
Summing up, the extremely low volatility in gold makes it likely that the upcoming move will be huge. The situation in the USD Index also makes it likely that the move in gold will be huge, and that it will be to the downside. The resistance levels on gold’s long-term chart along with confirmations from the short-term signals and the mining stock sector make it likely that the final decline has just started.
As always, we will keep you – our subscribers – informed.
To summarize:
Trading capital (supplementary part of the portfolio; our opinion): Short positions (150% of the full position) in gold, silver and mining stocks are justified from the risk/reward perspective with the following stop-loss orders and initial target price levels / profit-take orders:
- Gold: initial target price level: $1,063; stop-loss: $1,317; initial target price for the DGLD ETN: $81.88; stop-loss for the DGLD ETN $44.57
- Silver: initial target price: $13.12; stop-loss: $19.22; initial target price for the DSLV ETN: $46.18; stop-loss for the DSLV ETN $17.93
- Mining stocks (price levels for the GDX ETF): initial target price: $9.34; stop-loss: $26.34; initial target price for the DUST ETF: $143.56; stop-loss for the DUST ETF $21.37
In case one wants to bet on junior mining stocks' prices (we do not suggest doing so – we think senior mining stocks are more predictable in the case of short-term trades – if one wants to do it anyway, we provide the details), here are the stop-loss details and initial target prices:
- GDXJ ETF: initial target price: $14.13; stop-loss: $45.31
- JDST ETF: initial target price: $417.04; stop-loss: $43.12
Long-term capital (core part of the portfolio; our opinion): No positions (in other words: cash)
Insurance capital (core part of the portfolio; our opinion): Full position
Important Details for New Subscribers
Whether you already subscribed or not, we encourage you to find out how to make the most of our alerts and read our replies to the most common alert-and-gold-trading-related-questions.
Please note that the in the trading section we describe the situation for the day that the alert is posted. In other words, it we are writing about a speculative position, it means that it is up-to-date on the day it was posted. We are also featuring the initial target prices, so that you can decide whether keeping a position on a given day is something that is in tune with your approach (some moves are too small for medium-term traders and some might appear too big for day-traders).
Plus, you might want to read why our stop-loss orders are usually relatively far from the current price.
Please note that a full position doesn’t mean using all of the capital for a given trade. You will find details on our thoughts on gold portfolio structuring in the Key Insights section on our website.
As a reminder – “initial target price” means exactly that – an “initial” one, it’s not a price level at which we suggest closing positions. If this becomes the case (like it did in the previous trade) we will refer to these levels as levels of exit orders (exactly as we’ve done previously). Stop-loss levels, however, are naturally not “initial”, but something that, in our opinion, might be entered as an order.
Since it is impossible to synchronize target prices and stop-loss levels for all the ETFs and ETNs with the main markets that we provide these levels for (gold, silver and mining stocks – the GDX ETF), the stop-loss levels and target prices for other ETNs and ETF (among other: UGLD, DGLD, USLV, DSLV, NUGT, DUST, JNUG, JDST) are provided as supplementary, and not as “final”. This means that if a stop-loss or a target level is reached for any of the “additional instruments” (DGLD for instance), but not for the “main instrument” (gold in this case), we will view positions in both gold and DGLD as still open and the stop-loss for DGLD would have to be moved lower. On the other hand, if gold moves to a stop-loss level but DGLD doesn’t, then we will view both positions (in gold and DGLD) as closed. In other words, since it’s not possible to be 100% certain that each related instrument moves to a given level when the underlying instrument does, we can’t provide levels that would be binding. The levels that we do provide are our best estimate of the levels that will correspond to the levels in the underlying assets, but it will be the underlying assets that one will need to focus on regarding the signs pointing to closing a given position or keeping it open. We might adjust the levels in the “additional instruments” without adjusting the levels in the “main instruments”, which will simply mean that we have improved our estimation of these levels, not that we changed our outlook on the markets. We are already working on a tool that would update these levels on a daily basis for the most popular ETFs, ETNs and individual mining stocks.
Our preferred ways to invest in and to trade gold along with the reasoning can be found in the how to buy gold section. Additionally, our preferred ETFs and ETNs can be found in our Gold & Silver ETF Ranking.
As a reminder, Gold & Silver Trading Alerts are posted before or on each trading day (we usually post them before the opening bell, but we don't promise doing that each day). If there's anything urgent, we will send you an additional small alert before posting the main one.
=====
Latest Free Trading Alerts:
Recently, Fischer made an assessment of financial stability in the United States. What can we learn from it?
U.S. Financial Stability and Gold
On Monday, official data showed that Chinese demand for crude oil declined in July, which together with a stronger U.S. dollar and concerns over a rise in OPEC output weighed on investors’ sentiment and pushed the price of the black gold lower. As a result, light crude lost 2.52% and closed the day below $48. How low could the commodity go in the coming days?
Sharp Decline in Crude Oil and Its Consequences
=====
Hand-picked precious-metals-related links:
PRECIOUS-Gold Pressured By Firmer Dollar, Easing Of N.Korea Tensions
India Bans Gold Exports Above 22 Carats to Plug Trade Loopholes
=====
In other news:
Dollar holds firm before Fed minutes, stocks rise
Fed Minutes May Show Battle Lines Hardening Over Soft Inflation
ECB's Draghi will not deliver fresh policy steer at Jackson Hole: Sources
There’s a Reason People Are Worried About Low Volatility
Bitcoin Is Literally Soaring Into Space After Rocket-Like Surge
=====
Thank you.
Sincerely,
Przemyslaw Radomski, CFA
Founder, Editor-in-chief, Gold & Silver Fund Manager
Gold & Silver Trading Alerts
Forex Trading Alerts
Oil Investment Updates
Oil Trading Alerts

