

Briefly: in our opinion, full (250% of the regular size of the position) speculative short position in gold, silver, and mining stocks are justified from the risk/reward perspective at the moment of publishing this Alert.
Gold stocks just ended the week at a new 2019 high, while gold confirmed its breakdown in the most important - weekly closing price - terms. Who should one believe? Are gold miners leading gold higher just like it was the case many times, or "this time is different"? In addition to replying to the above question, today's Alert includes the updated gold price path that includes our thoughts on both the gold downswings and upswings. Sure, gold is likely to break above $2,000 eventually, but when and how this is going to happen will likely have profound impact on your savings. And it's up to you to make it affect you in a very positive way. So, are things this time really different?
Actually, this time does indeed appear to be different. Why? Because all the other important markets and gold stocks' own long-term perspective point to lower prices, just like gold does. Let's take a closer look.
Topping Signs in Gold and Silver

First of all, we see that gold has broken below the rising support line based on Friday's closing prices. It can be clearly seen on the above chart, even though the previous several days' action is particularly clear. On a side note, we invite you to take a look at Friday's analysis for a chart from other provider, where it's clear that gold had already broken and confirmed this breakdown in the previous days. Either way, we know have the most profound confirmation of the breakdown - the weekly closing price, and the implications are very bearish.
Also, please note that the volume that accompanied Friday's upswing was the lowest that we've seen in about a month. It was not small in absolute terms, but the relative comparison suggests that the buying power for gold is drying up.
Let's check what's happening in the silver world.
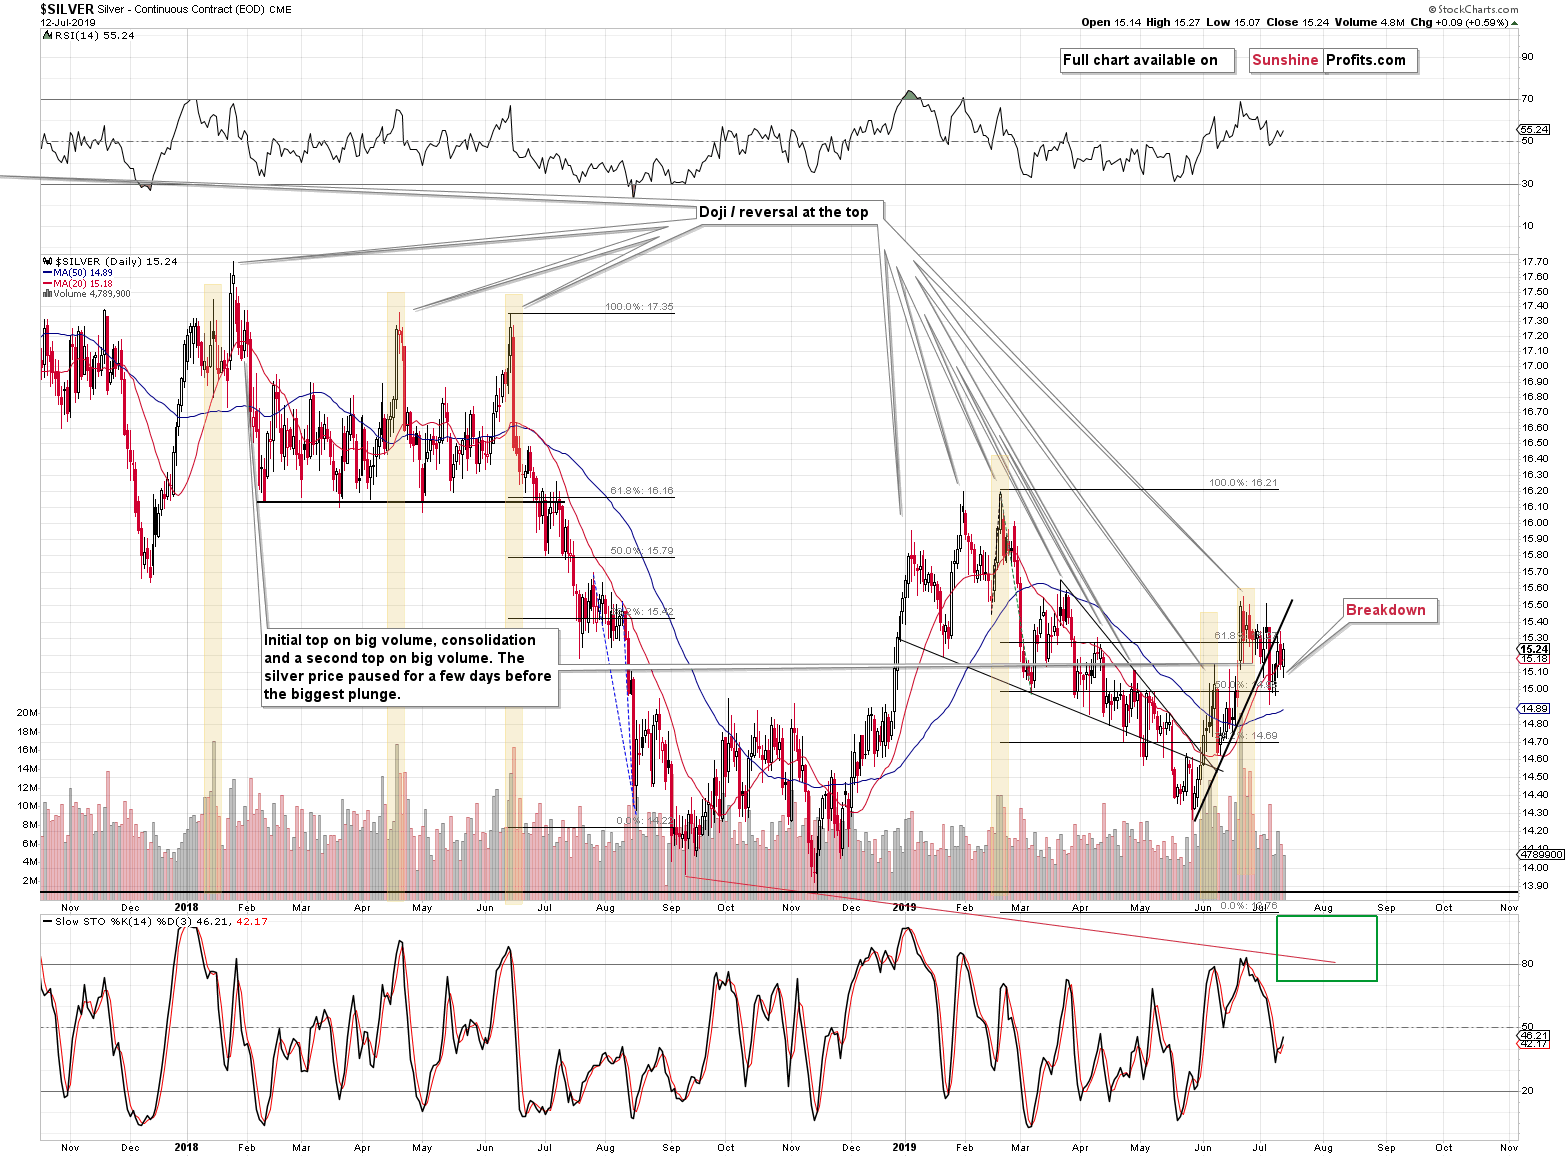
Pretty much the same thing. Silver confirmed the breakdown below its rising support line, then confirmed it in all possible ways, including by last week's weekly closing price. The implications are clearly bearish, especially that the breakdown materialized right after the highly effective topping sign - silver's outperformance of gold that was accompanied by huge volume. We marked similar cases with yellow rectangles, and they were all major tops.
The outlook based on the short-term gold and silver charts is clearly bearish. But that's not the case when one looks at the gold stocks' chart.
Meanwhile in the Mining Stocks...
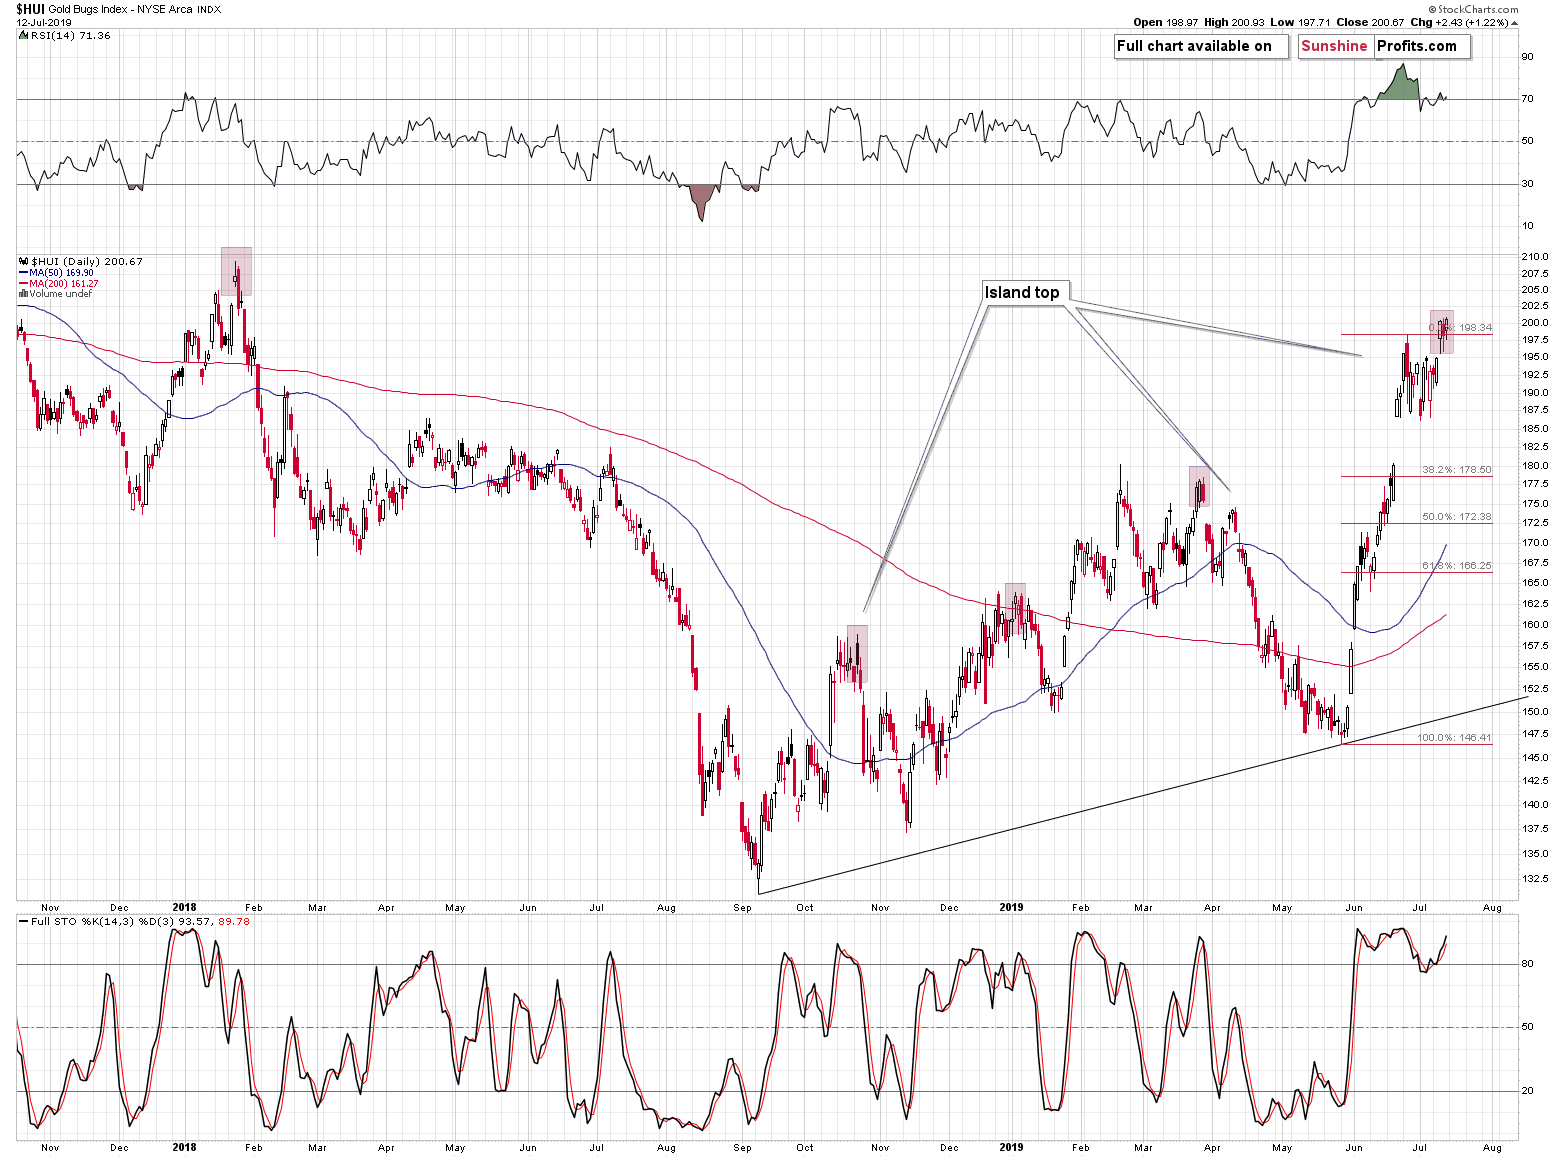
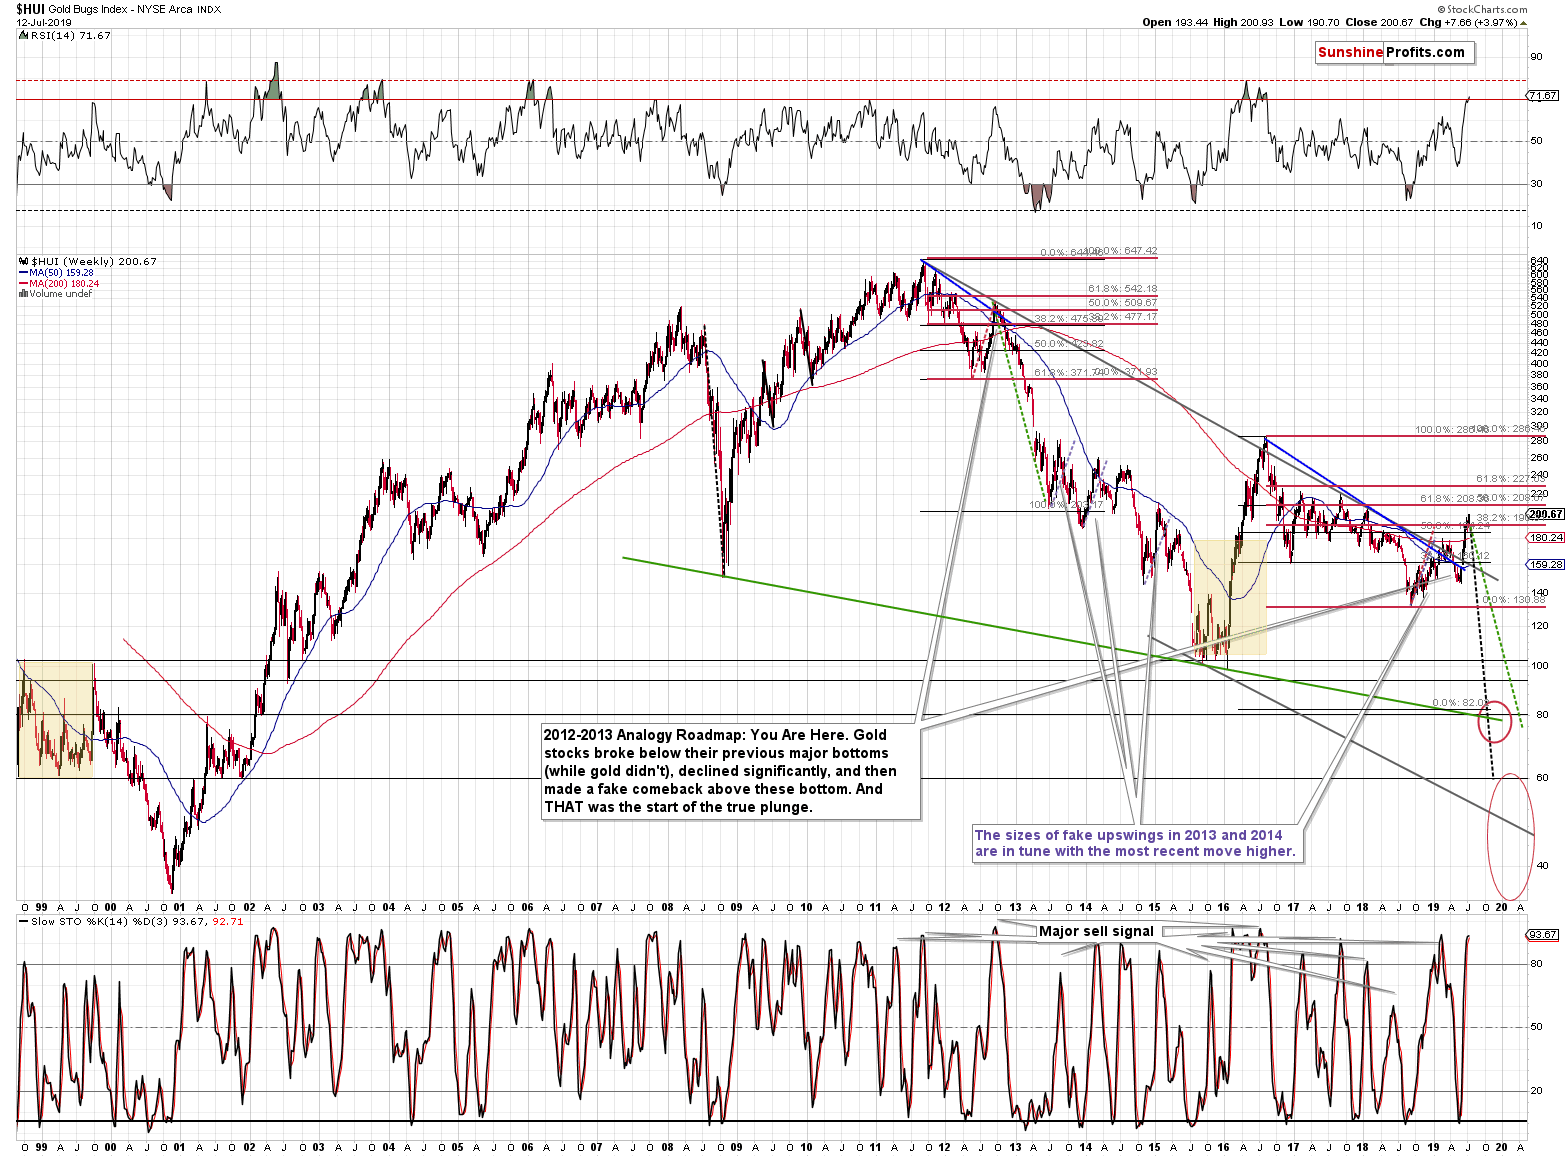
The HUI Index closed above the previous highs, and most importantly, it closed above the June high for three consecutive trading days. It also closed above it in terms of the weekly prices. Whatever bearish words we wrote about the breakdowns in gold and silver, turns to bullish in case of the gold mining companies.
Either metals, or miners will have to give in to the other.
But, is the mining stock sector comprised of just gold miners that are included in the HUI Index? Absolutely not. In case of the broader (i.e. covering more stocks) GDX ETF, there was no confirmed breakdown. We saw just another daily attempt to break above the June high after Wednesday's attempt was invalidated on Thursday. GDX does not confirm the bullish nature of the HUI's breakout.
And what about the silver stocks?
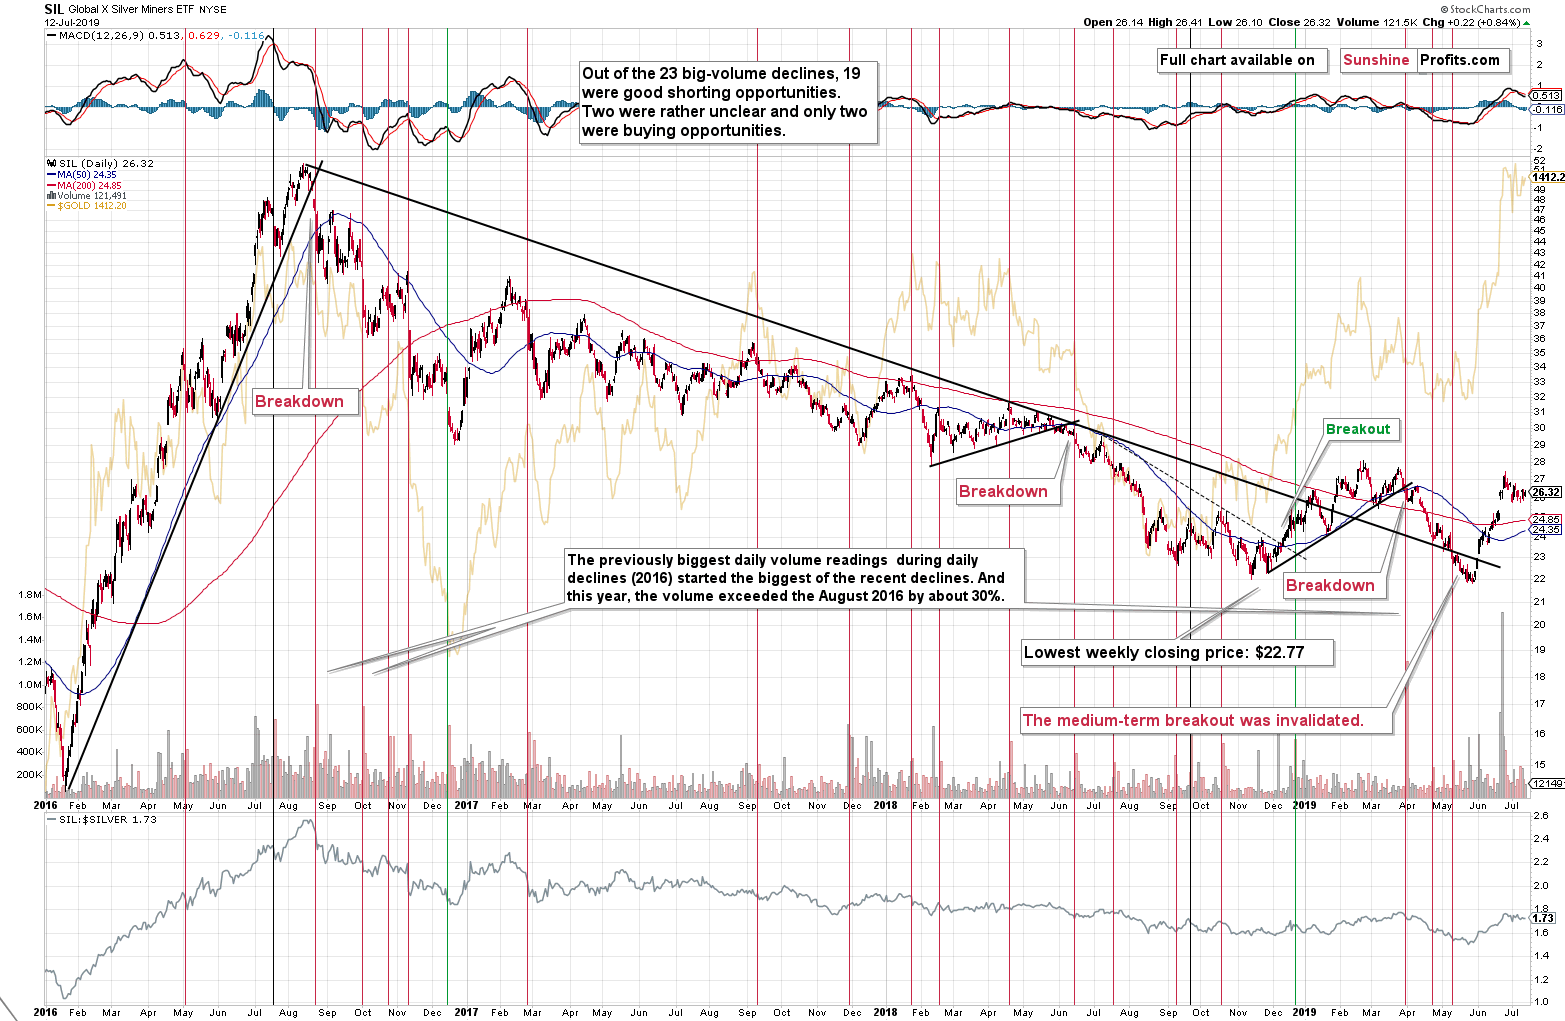
There was no breakout to speak of and the outlook in this case remains strongly bearish. Strongly, because of several factors, one of the most important being the extreme volume reading that we just saw.
It happened after a sizable rally and at that time we emphasized that it very likely marked the end of the rally. It appears that it was indeed the case. Silver miners didn't move above the extreme-volume high ever since.
Another reason for the situation to be bearish is the recent very overbought reading from the RSI indicator. It was above 80 and that happened only several times in the previous years. The only two bullish cases when that happened, were during 2016 and when we saw breakout to new highs in 2010. The size of the current upswing clearly shows that this move is not like the 2016 move and the situation in gold and silver clearly shows that this situation doesn't look like what we saw in 2010 either.
What we see now, is much more similar to what happened in late 2012 or mid-2014, which is where silver miners topped along with gold stocks, and the underlying precious metals: silver and gold.
With such meaningful bearish indications from the silver miners, should one trust the confirmation of the breakout in gold stocks, especially in light of no confirmation from the GDX ETF? Absolutely not.
Let's see how it all looks from the broad perspective.
The Big Picture in Gold and Silver
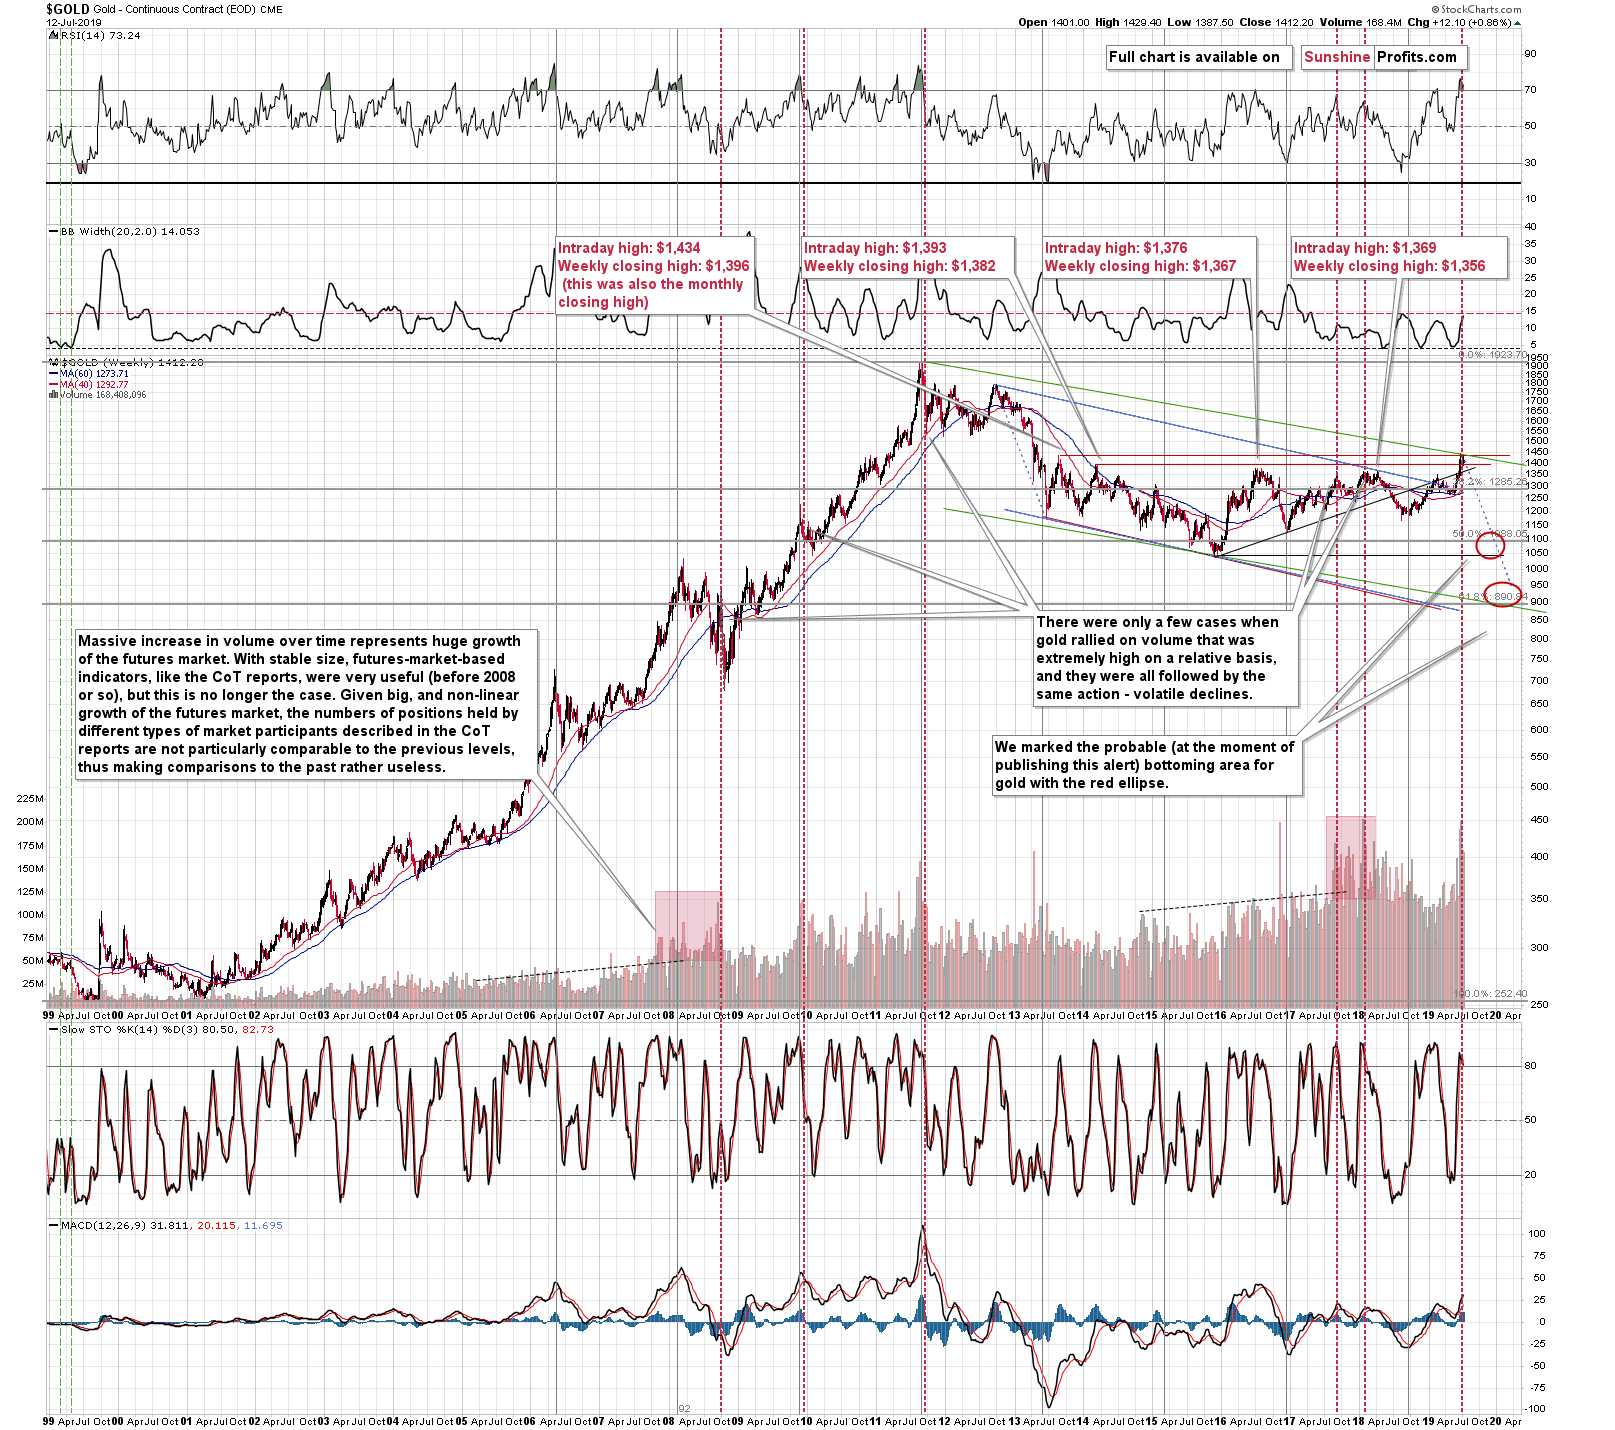
Gold is after a powerful weekly reversal that materialized on huge volume, which took place while gold failed to break above the mid-2013 high and while the RSI recorded very overbought readings.
Does the above look bullish at all? No, it's one of the most bearish combinations imaginable.
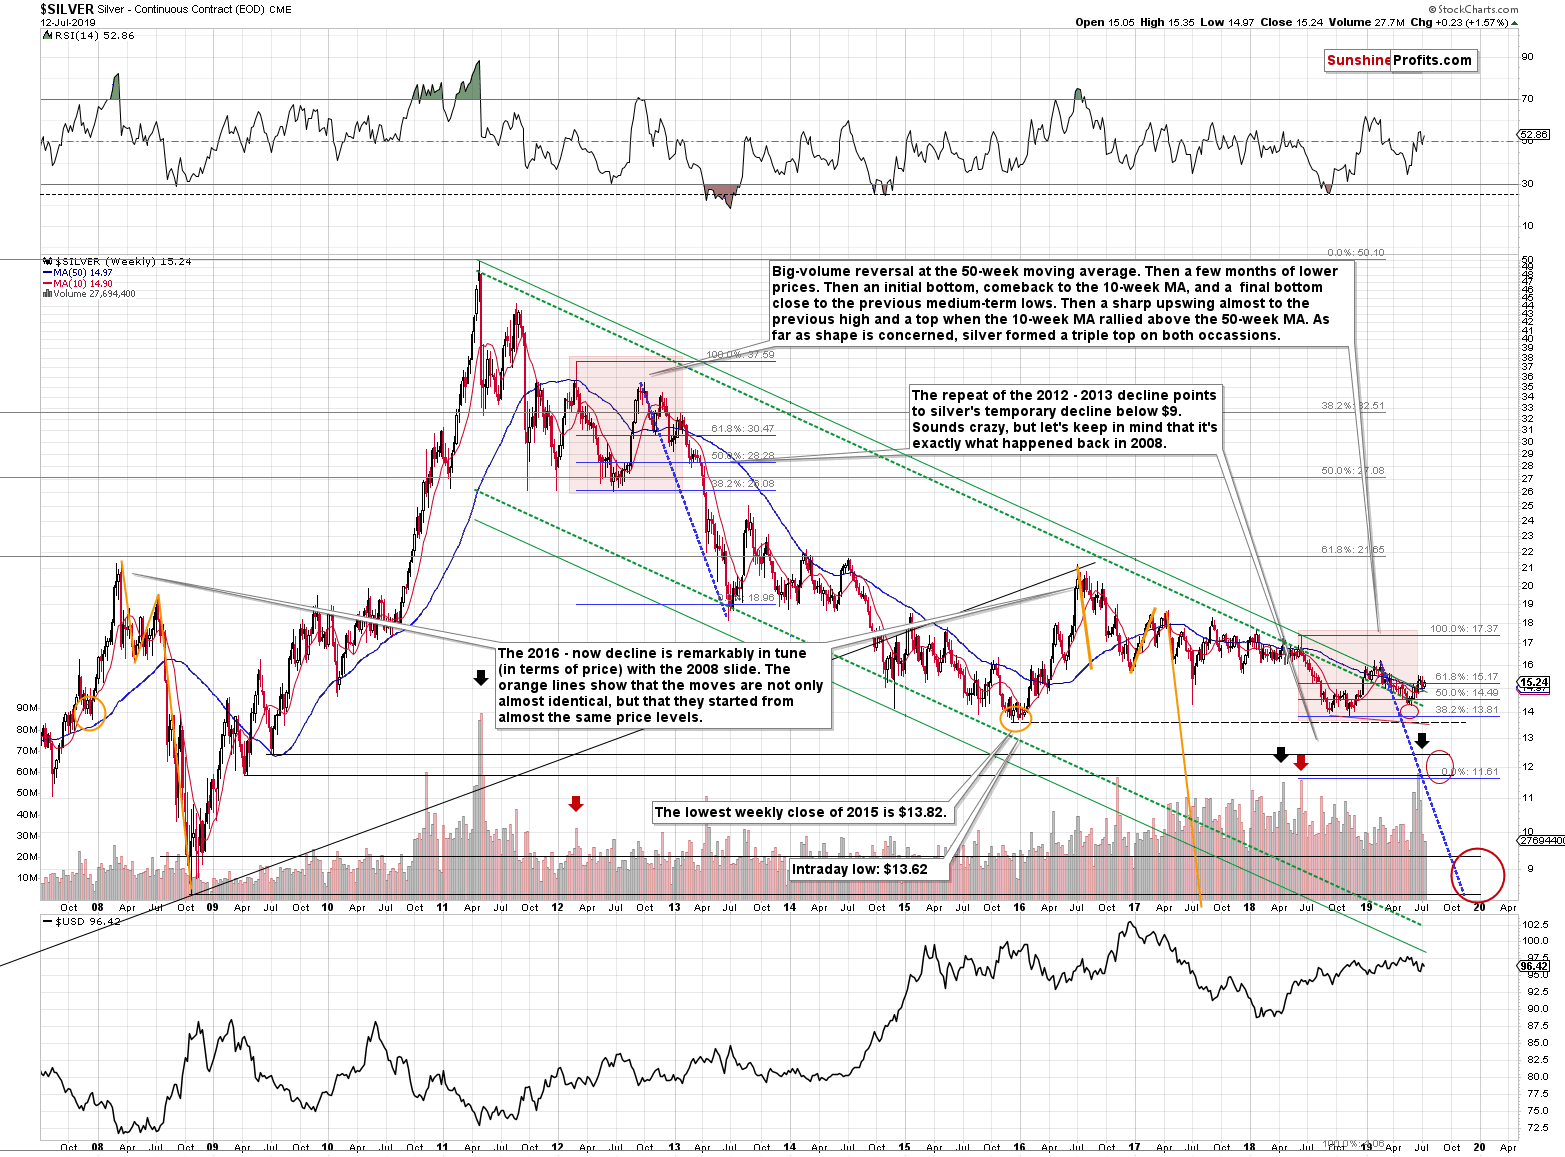
If you had to look at the above chart for just a second, and then recall from memory where silver price was trading, you'd probably say that it's at the multi-year lows. And that's true - from the long-term point of view, the recent move higher is barely visible and given silver's volatility, the 2015 low is within the range of a single day's decline. This may seem impossible if you've been drawn to the silver market just recently, but there have been many times in the last several years, when silver moved a few dollars in just one day.
There will definitely be days when silver moves more than $1 during the session or even outside of it. There will also likely be days when silver moves more than $10 in one day, but we will most likely have to wait silver to break above the 2011 high first.
If the second most popular precious metal refuses to confirm the most popular metal's rally, can the latter really be trusted? When Charles Dow formulated his Theory, he emphasized that in order for a primary trend buy or sell signal to be valid, both: the Industrial- and the Rail Average must confirm each other. The same principle can be applied to the precious metals market and the bullish picture for the PM sector simply doesn't hold when looking at silver.
Before moving further, please make sure that you take note of and keep in mind that near-perfect analogy in terms of price to what happened in 2008. The 2015 bottom and the late-2017 bottom are the staring points of the analogy and the following size of rallies and declines are almost identical. The same goes for the price levels that were reached. This analogy currently suggests that silver will need to move below $10, and most likely below $9, before it can rally profoundly once again.
And what about the gold miners?
The Miners' Big Picture
In short, our previous comments on the above chart, remain up-to-date:
Even taken together, this and last years' rally in the gold miners is very small to compare to the 2016 upswing, let alone to the enormous 2011 - 2016 decline. It's just a relatively small correction within a much bigger downtrend. By being bearish here, we are not against the major trend - we are in tune with it.
Some may say that the HUI Index broke above the very long-term declining resistance line based on the 2011 and 2012 tops, which makes the outlook bullish. However, they forget that the same thing happened at the very top that we saw in 2016. And they forget that given where gold is right now (above its 2016 high) the size of the recent upswing in the miners is very weak.
The current move is much more similar to the 2014 or 2015 corrective upswings than it is to the 2016 rally or to the beginning of the 2000s bull market. And what followed the 2014 and 2015 corrections? Big slides during which miners didn't look back until they reached new lows.
The more fundamental thing about all this that was mentioned in the question is that the miners are suggesting that this is not the beginning of a new powerful upswing that would take gold much higher eventually. It strongly indicates that we will need to see a bigger price decline first.
(...) Please take a look at the rally that we saw right before the late 2012 top that directly preceded the biggest decline in the miners of the last several decades. It was not as big as the current upswing, but it was only a little smaller (of course percentage-wise - in absolute terms, the previous rally was much bigger). But when we compare both to the sizes of the preceding downswings (the 2011-2012 decline and the 2016-2018 decline), we see that the current rally is a bit smaller.
The previous upswing corrected a bit over 50% of the preceding decline, and the current upswing corrected a bit over 38.2% of the preceding decline (and bit less than 50%). The final part of the late-2012 upswing was similarly sharp as the current upswing is. However, while the late-2012 top in gold was very close to its late-2011 top, we definitely can't say the same thing about the HUI high. In late 2012, gold miners topped almost 100 index points below the late-2011 top. That's very similar to what's happening here. Gold moved to the previous high but failed to break above it (the late-2013 high that is), but gold miners were not even close to the analogous price level (it's about 80 index points higher). The history rhymes and this similarity has very bearish implications for the following weeks and months and the current strength appears to be just a correction within a bigger downtrend.
The USD Index Examination
The USD Index declined on Friday, but it moved below Thursday's low by just 0.02 in terms of the intraday lows. Consequently, everything that we wrote on Friday, including the comments on the possible inverse-head-and-shoulders pattern, remains up-to-date:
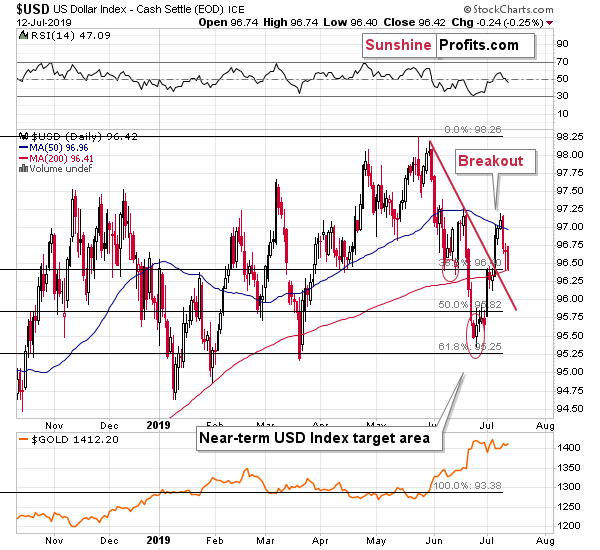
The USD Index formed a bullish reversal yesterday, which means that the post-breakout pullback may already be over. If we see higher USD values here - and we are likely to see them - then the USD might soon complete an inverse head and shoulders pattern. The early June bottom would be the left shoulder and the current bottom would be the right shoulder. This pattern - if it is completed - would imply a rally at least as big as the size of the "head" of the pattern starting from the "neck". The head's size is about 1.9, and the neck is at about 97.2, which implies an upside target of at least 99.1. This means a breakout to new 2019 highs.
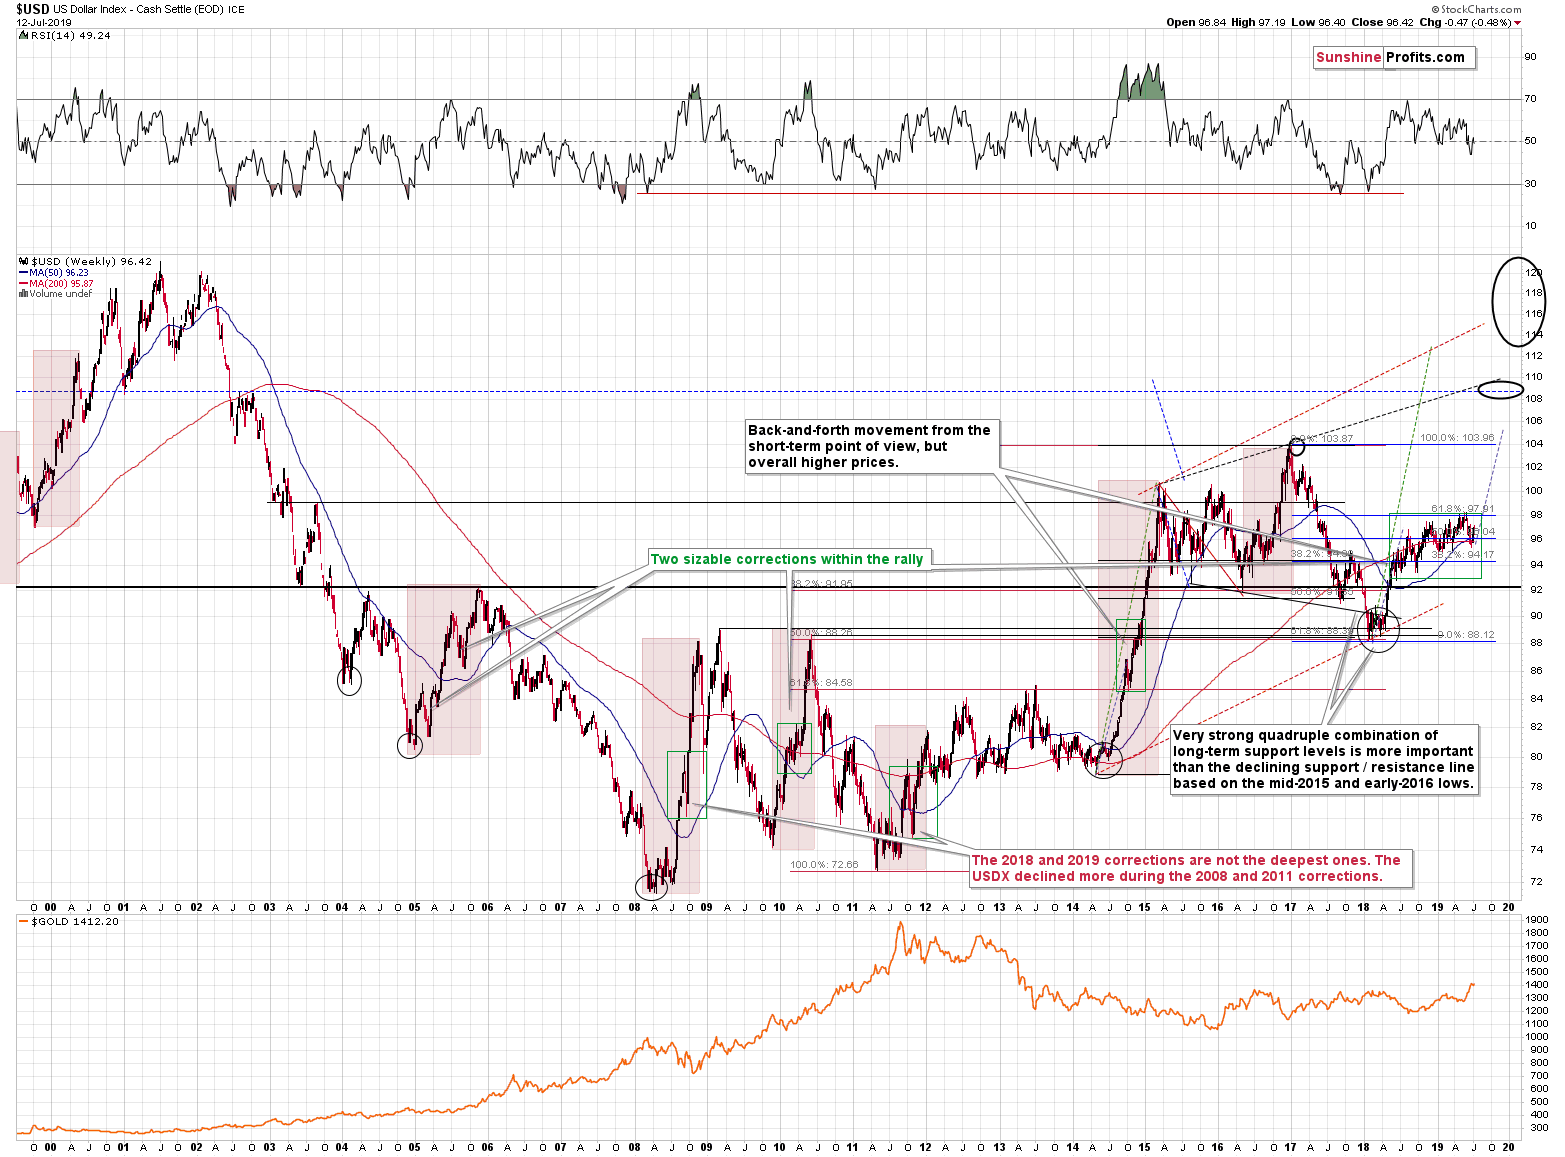
It would also mean a breakout above the running consolidation and this would imply an upside target of about 105, as the moves that follow consolidations tend to be similar to those that preceded them.
This, in turn, would imply a breakout above the 2016 / 2017 high that could - and likely would - result in an even more profound rally. The next big resistance is at about 108 level. Such a big USD rally is very likely to translate into new lows in gold.
There price of gold and the value of the USD Index don't move in perfect inverse tune at all times, but they move in the opposite directions in general, and big moves in the USDX are very unlikely to be ignored by the yellow metal. And this all might have started with yesterday's reversal.
Gold Price Path
Before summarizing, we would like to update our gold price path chart. It's not that we changed our views on what's likely to happen this year - we simply want to expand the chart further into the future, because it might have given the false impression that we are bearish on gold in the long run. We're bullish on gold in the long run, but we simply think that it hasn't fallen enough in 2015 and that it needs to fall further in order to start its next real, sustainable bull market.
It also shows how huge is the price move (in both directions) that one would miss by simply being long here with the aim to wait the decline out, instead of adjusting their capital to profit from it as well as profit from the following rebound. Of course, this assumes that our views on the market are correct, which may or may not be the case, but given the number of factors that point to lower PM prices, we continue to stand by the bearish outlook in the medium term.
Also, the text below is exactly was we wrote last week, so if you've read it, you can skip it and take a look at the chart. We are adding it today, because many new subscribers joined us recently and we want them to have the proper context for this chart and to reply some of the possible questions.
When we originally featured it, we explained that all targets should be taken on an approximate basis (at least +/- 1 month in terms of time) and that we can't guarantee that gold will indeed move exactly as we outline. This remains up-to-date. It's simply not possible to predict the price path with the exact precision and definitely not when it comes to the long-term price moves. Nobody in this, or any other business, can claim to be able to do so, and neither do we. But, does it mean that the chart below is not valuable? Of course not. It shows you more or less what to expect and when certain moves could happen, so that they don't surprise you as they will surprise (and likely cause panic among) beginning investors and traders. It also shows you that big moves are likely relatively close and thanks to comparing them to what already happened a couple of years earlier, you see that expecting these moves is not as unrealistic as it may appear at first sight, especially if one is focused on the most-recent day-to-day trading. It's very easy to get all caught-up in the daily market movement and while gold is rallying, to forget that it declines as well, and while gold keeps on sliding, to forget that gold will also rally (in fact it is likely to rally greatly in the next several years).
So, without further introduction, here's the likely price path for gold for the following months.
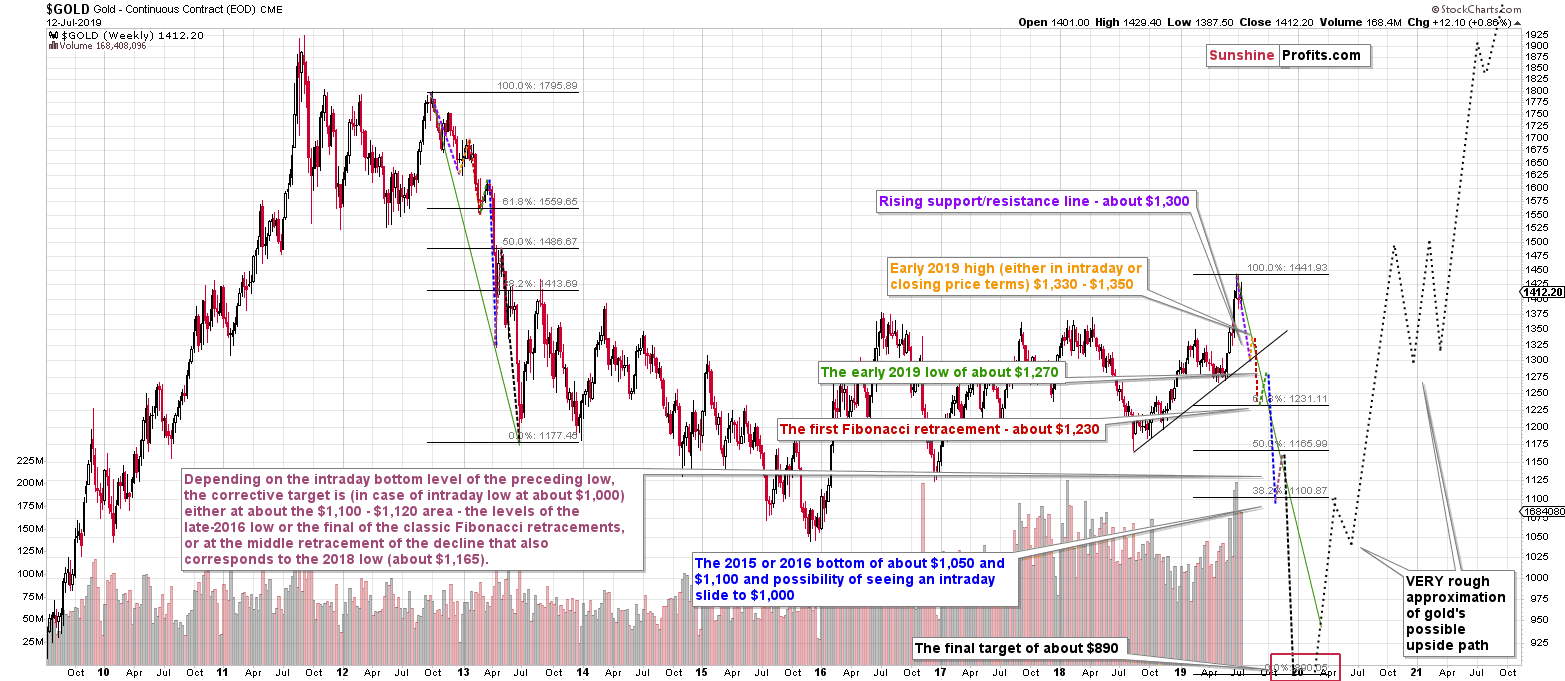
The details are visible directly on the above chart (by the way, you can click it to enlarge it) and the most important takeaways are:
- Gold is still likely to slide below $1,000, most likely to about $890 and it's most likely to take place in the final part of this year, around the time of the USD Index top, however, we are not ruling out a situation in which these reversals take place early in 2020
- The sharp rally that we saw recently is likely to be reversed in a just as a sharp manner
- The support levels are provided by the previous lows, Fibonacci retracements (created using the $890 target), and the nearby rising support line
- There's not much clarity regarding the shape of the final part of the decline and the correction that precedes it, just as there was little clarity regarding the initial April 2013 slide. The implication here is not to trust the initial corrective upswing from about $1,100 when almost everyone will be writing about gold having bottomed.
Before summarizing, we would like to quickly show why $890 is such a likely target for the final bottom in gold. Those who have been with us for years know this very well, but since many people joined us recently, we would like to quickly show it once again.
In short, the $890 level is the combination of two critical support levels, the 2013 analogy, and one major fact. The supports are:
- the 61.8% Fibonacci retracement level (the most classic retracement) based on the entire bull market
- the lower border of the declining trend channel based on the 2011 high, the most recent high and the 2015 low
The 2013 analogy currently suggests a move below $950, not necessarily to about $890, but the latter is still the most likely target given the above two points and the major fact that we mentioned above. And this fact is that back in 2015 gold was not hated enough for this to be THE bottom. People were relatively optimistic, we saw comments of gold analysts and gold promoters, we saw the outcome of the online polls, we saw our own e-mail inbox. There was neither major panic, nor hate toward gold. Gold was not loathed in the mass media. That's all what we should see at THE bottom and we didn't. Gold simply didn't get low enough. Now, gold breaking below $1,000 (which also means a visible breakdown below the 2015 bottom) is something that should trigger panic selling and make people hate it. That's the environment in which the true bottom is likely to form and the time to back up the truck with the precious metals. For now, in our opinion, the greatest opportunity continues to be in making the most of the upcoming slide.
Summary
Summing up, the bullish implications from the short-term breakout in gold stocks are overwhelmed by the bearish implications of what we see in other mining stock proxies: GDX and SIL - proxy for silver stocks, the short-term developments that we saw in gold and silver, and by the long-term outlook for gold, silver, gold stocks, and the USD Index.
Gold and silver confirmed their breakdowns below their rising short-term support lines - also in terms of the weekly close, which is yet another bearish factor currently in play for the precious metals market. The above happened in addition to and after we saw multiple long-term signs pointing to lower prices in the following months, i.a. the clear huge-volume-confirmed bearish shooting star candlestick in gold, huge volume topping signs from both: gold and silver, the triangle-vertex-based reversals, and epic volume from silver stocks. The next big move in the precious metals sector is most likely going to be down, not up.
Also, we don’t know if you remember about our Day Trading Signals service, which is still in the preview (i.e. FREE) mode, but it’s definitely worth taking a look at it. About a month ago, we moved from always providing details for CFDs to always providing details for futures. The CFD period ended in the following way: 44 trades over 2 months and their average profitability was 0.58% per trade (assuming no leverage in case of cryptocurrency trades and 10x leverage otherwise).
Since June 12, 2019 (about a month ago) all results are based on the futures entry and exit prices, which means that they are easily verifiable for everyone. During this time, we had 15 trades, 11 of which were profitable (over 73%). In other words, ever since introducing this service, it’s been profitable (of course not on each day, but on average). It’s still free and we will be happy to send you the daily notifications, if you’re interested. Please tell us that you'd like to receive them and we’ll sign you up (again, free of charge).
As always, we'll keep you - our subscribers - informed.
To summarize:
Trading capital (supplementary part of the portfolio; our opinion): Full short position (250% of the full position) in gold, silver, and mining stocks is justified from the risk/reward perspective with the following stop-loss orders and exit profit-take price levels:
- Gold: profit-take exit price: $1,241; stop-loss: $1,452; initial target price for the DGLD ETN: $51.87; stop-loss for the DGLD ETN $31.67
- Silver: profit-take exit price: $13.81; stop-loss: $16.32; initial target price for the DSLV ETN: $39.38; stop-loss for the DSLV ETN $23.87
- Mining stocks (price levels for the GDX ETF): profit-take exit price: $17.61; stop-loss: $26.47; initial target price for the DUST ETF: $34.28; stop-loss for the DUST ETF $9.87
In case one wants to bet on junior mining stocks' prices (we do not suggest doing so - we think senior mining stocks are more predictable in the case of short-term trades - if one wants to do it anyway, we provide the details), here are the stop-loss details and target prices:
- GDXJ ETF: profit-take exit price: $24.71; stop-loss: $37.17
- JDST ETF: profit-take exit price: $78.21 stop-loss: $22.47
Long-term capital (core part of the portfolio; our opinion): No positions (in other words: cash)
Insurance capital (core part of the portfolio; our opinion): Full position
Whether you already subscribed or not, we encourage you to find out how to make the most of our alerts and read our replies to the most common alert-and-gold-trading-related-questions.
Please note that the in the trading section we describe the situation for the day that the alert is posted. In other words, it we are writing about a speculative position, it means that it is up-to-date on the day it was posted. We are also featuring the initial target prices, so that you can decide whether keeping a position on a given day is something that is in tune with your approach (some moves are too small for medium-term traders and some might appear too big for day-traders).
Plus, you might want to read why our stop-loss orders are usually relatively far from the current price.
Please note that a full position doesn't mean using all of the capital for a given trade. You will find details on our thoughts on gold portfolio structuring in the Key Insights section on our website.
As a reminder - "initial target price" means exactly that - an "initial" one, it's not a price level at which we suggest closing positions. If this becomes the case (like it did in the previous trade) we will refer to these levels as levels of exit orders (exactly as we've done previously). Stop-loss levels, however, are naturally not "initial", but something that, in our opinion, might be entered as an order.
Since it is impossible to synchronize target prices and stop-loss levels for all the ETFs and ETNs with the main markets that we provide these levels for (gold, silver and mining stocks - the GDX ETF), the stop-loss levels and target prices for other ETNs and ETF (among other: UGLD, DGLD, USLV, DSLV, NUGT, DUST, JNUG, JDST) are provided as supplementary, and not as "final". This means that if a stop-loss or a target level is reached for any of the "additional instruments" (DGLD for instance), but not for the "main instrument" (gold in this case), we will view positions in both gold and DGLD as still open and the stop-loss for DGLD would have to be moved lower. On the other hand, if gold moves to a stop-loss level but DGLD doesn't, then we will view both positions (in gold and DGLD) as closed. In other words, since it's not possible to be 100% certain that each related instrument moves to a given level when the underlying instrument does, we can't provide levels that would be binding. The levels that we do provide are our best estimate of the levels that will correspond to the levels in the underlying assets, but it will be the underlying assets that one will need to focus on regarding the signs pointing to closing a given position or keeping it open. We might adjust the levels in the "additional instruments" without adjusting the levels in the "main instruments", which will simply mean that we have improved our estimation of these levels, not that we changed our outlook on the markets. We are already working on a tool that would update these levels on a daily basis for the most popular ETFs, ETNs and individual mining stocks.
Our preferred ways to invest in and to trade gold along with the reasoning can be found in the how to buy gold section. Additionally, our preferred ETFs and ETNs can be found in our Gold & Silver ETF Ranking.
As a reminder, Gold & Silver Trading Alerts are posted before or on each trading day (we usually post them before the opening bell, but we don't promise doing that each day). If there's anything urgent, we will send you an additional small alert before posting the main one.
=====
Latest Free Trading Alerts:
Today's price action in oil may look to be boring at first sight, but it is far from being so. There appears to be pressure building under the surface. Actually, this chart situation is such that it leads us to open a new position. The bulls have been strong lately but look to be taking a breather now. Or, is that a breather? Figuring out the right answer is what today's Alert, and the new position, is all about...
Oil Bulls Are Hesitating, Don't You Think?
=====
Thank you.
Sincerely,
Przemyslaw Radomski, CFA
Editor-in-chief, Gold & Silver Fund Manager

