

Briefly: In our opinion, full (150% of the regular full position) speculative short positions in gold, silver and mining stocks are justified from the risk/reward perspective. This position was originally featured on Jan. 12, 2017 at 3:49PM.
We sent out yesterday’s alert relatively close to the end of yesterday’s session and not much has changed in terms of prices since that time, so what we wrote back then remains up-to-date. In today’s alert, we will supplement the above with charts and additional information.
Let’s start with the USD Index (charts courtesy of http://stockcharts.com).
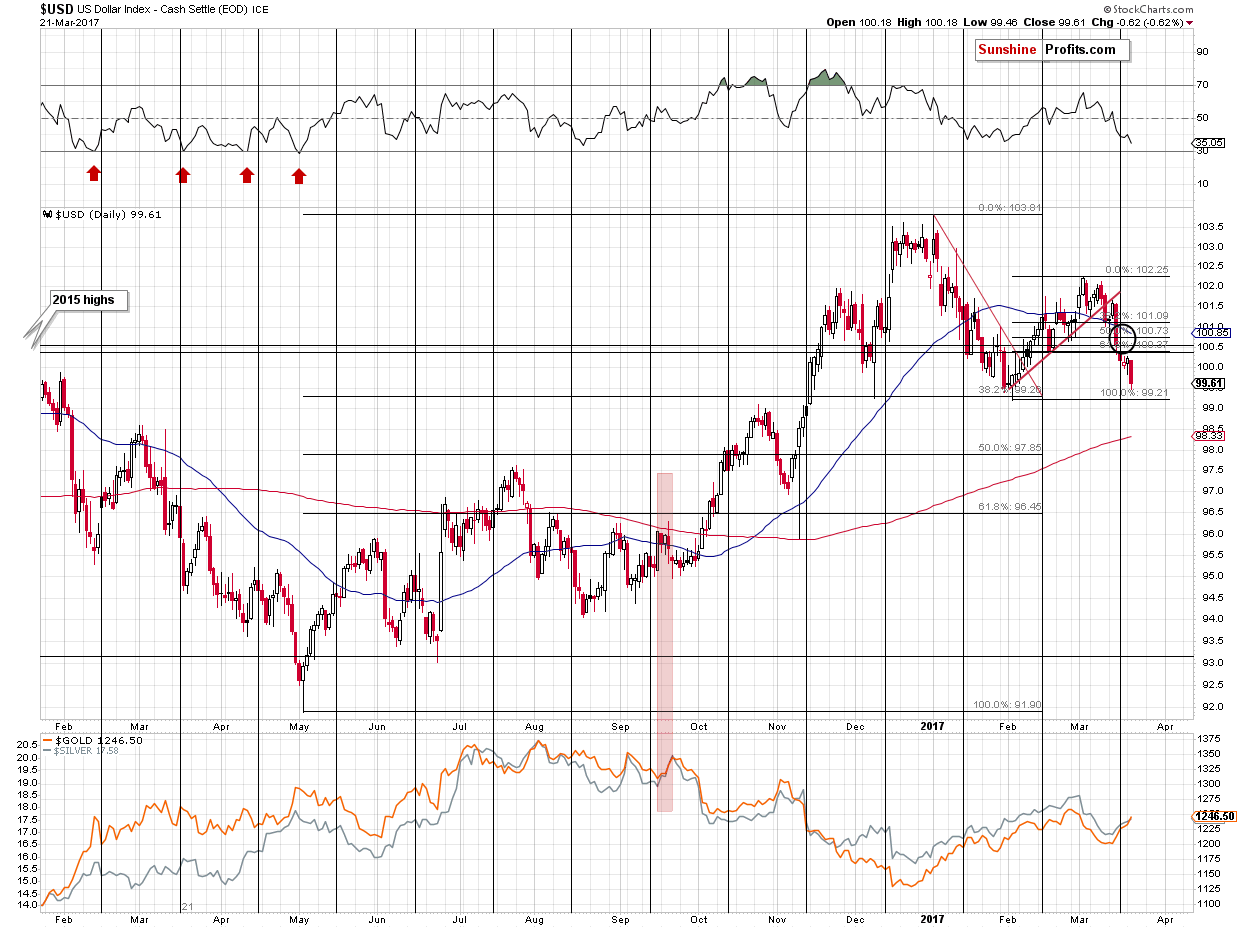
With the daily intra-day low of 99.46, the USD Index has almost reached the previous intra-day lows (99.19) – the strong support provided by December and February lows is just ¼ of an index point below yesterday’s low, so the bottom in the USD might be in or is likely very close to being in. Moreover, it we take into account the daily closing prices, yesterday’s session took the USD even closer to the previous bottom – the USD had closed at 99.48 on January 31st, which is only 0.13 below yesterday’s closing prices. Whether the bottom is already in or about to be in, is not the key thing to keep in mind – the long-term picture is.
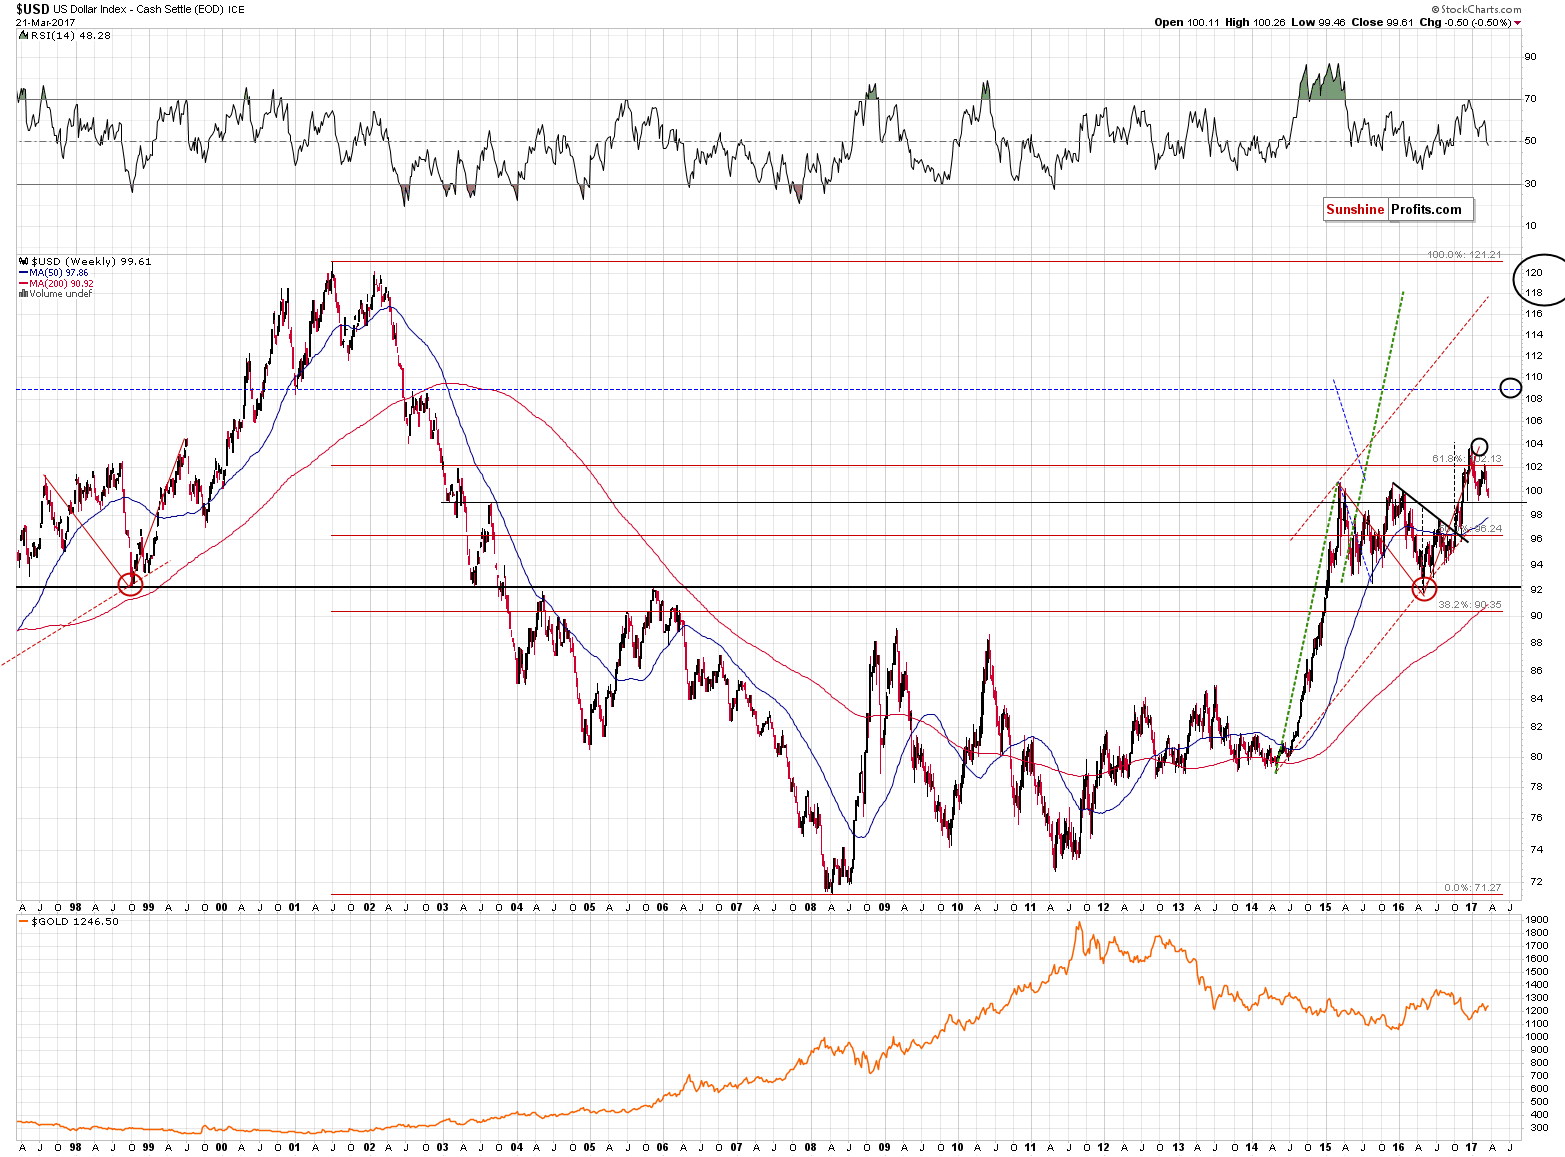
We featured the above chart numerous times in the past several weeks while discussing the reflective nature of the current rally in the USD Index. Today, we added a new horizontal line that shows the level at which the 2002 – early 2013 decline ended. It was approximately… 99.2. The USD Index had already reached this level in early February, but a retest of this level doesn’t change anything from the technical perspective. In fact, since the previous decline ended at this level, the next huge upswing is likely to begin from this level or from levels close to it.
The above discusses the aspect of price. As far as the aspect of time is concerned, the early 2003 consolidation took about 3 months. The top of 2017 was formed on January 3rd, which – assuming similarity – would suggest that the time for the current consolidation is up or very close to being up. It appears that the time factor of this long-term similarity might be the thing that is really behind the decline that we’re seeing this month (answering the “Why did the USD decline despite an interest rate hike?” question). The USD Index might have not been ready to soar from the early February bottom as one month of consolidation wasn’t enough. As we are now approaching the three month milestone, the powerful rally is even more likely to begin relatively soon.
A huge rally in the USD Index is very likely to translate into a powerful slide in the precious metals prices. If gold is about to move below $1000 and possibly below $900, does it really matter if the slide starts at $1,230 or $1,250? Unless one engages in day-trading, then it’s not that important – whether the powerful decline is still coming or not is the key thing to focus on and the recent downswing in the USD Index doesn’t seem to have invalidated anything.
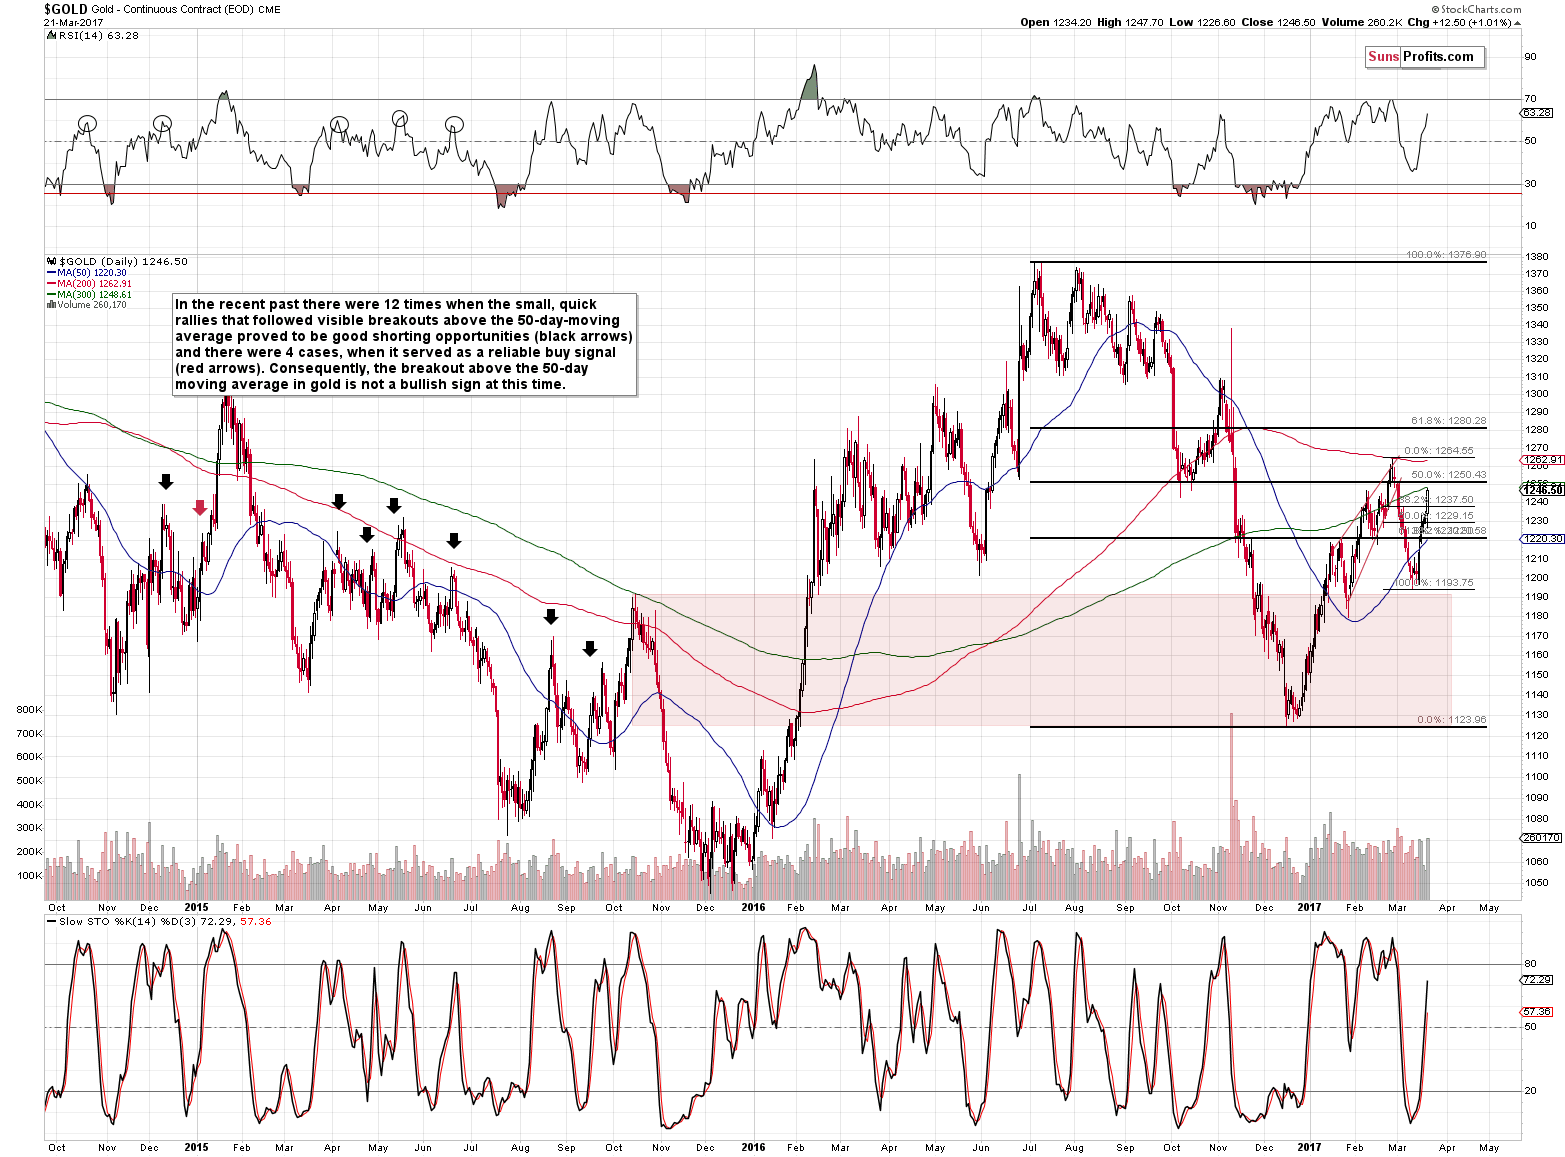
As we wrote above, gold moved to the 300-day moving average and more or less to its October 2016 low and the early February high. That’s a combination of resistance levels that could very well stop the rally and trigger a reversal (without any additional trigger from any specific news), but whether that happens right away or not is highly dependent on the USD Index. We already discussed the above – the implication for gold is that it seems that we won’t have to wait long for the big slide to start (if one chooses to view the current/upcoming top as its start instead of the 2016 top). Gold’s performance relative to the USD Index has been suggesting this for some time – please note that overall the USD Index is down by 1.51 in March and gold is… also down ($7, but still).
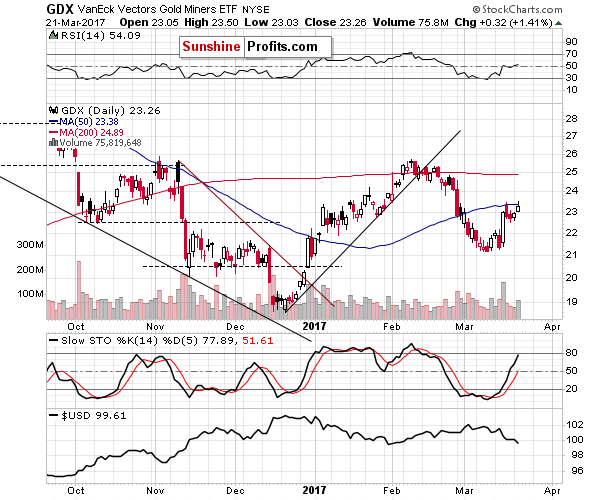
Mining stocks’ performance is also something that suggests that the rally is over or very close to being over. Miners barely moved higher yesterday, closing below the 50-day moving average despite an attempt to move above it. Gold closed visibly above its previous March highs, while miners didn’t – their underperformance is simply a bearish sign. Miners had their moment on March 15th, but just as one swallow doesn’t make a summer, one daily rally doesn’t make miners perform well relative to gold.
Summing up, this week’s price swings, just as last week’s price developments, have changed much less than it appears at the first sight – the long-term sell signals remain in place and the USD Index is even more likely to start its huge rally shortly than was the case back in early February due to the similarity between the early 2003 consolidation and the current one (with the emphasis on the time factor).
As always, we will keep you – our subscribers – informed.
To summarize:
Trading capital (supplementary part of the portfolio; our opinion): Short positions (150% of the full position) in gold, silver and mining stocks are justified from the risk/reward perspective with the following stop-loss orders and initial target price levels / profit-take orders:
- Gold: exit-profit-take level: $1,063; stop-loss: $1,273; initial target price for the DGLD ETN: $81.88; stop-loss for the DGLD ETN $48.17
- Silver: initial target price: $13.12; stop-loss: $18.67; initial target price for the DSLV ETN: $46.18; stop-loss for the DSLV ETN $19.87
- Mining stocks (price levels for the GDX ETF): initial target price: $9.34; stop-loss: $26.34; initial target price for the DUST ETF: $143.56; stop-loss for the DUST ETF $21.37
In case one wants to bet on junior mining stocks' prices (we do not suggest doing so – we think senior mining stocks are more predictable in the case of short-term trades – if one wants to do it anyway, we provide the details), here are the stop-loss details and initial target prices:
- GDXJ ETF: initial target price: $14.13; stop-loss: $45.31
- JDST ETF: initial target price: $104.26; stop-loss: $10.78
Long-term capital (core part of the portfolio; our opinion): No positions (in other words: cash)
Insurance capital (core part of the portfolio; our opinion): Full position
Please note that the in the trading section we describe the situation for the day that the alert is posted. In other words, it we are writing about a speculative position, it means that it is up-to-date on the day it was posted. We are also featuring the initial target prices, so that you can decide whether keeping a position on a given day is something that is in tune with your approach (some moves are too small for medium-term traders and some might appear too big for day-traders).
Plus, you might want to read why our stop-loss orders are usually relatively far from the current price.
Please note that a full position doesn’t mean using all of the capital for a given trade. You will find details on our thoughts on gold portfolio structuring in the Key Insights section on our website.
As a reminder – “initial target price” means exactly that – an “initial” one, it’s not a price level at which we suggest closing positions. If this becomes the case (like it did in the previous trade) we will refer to these levels as levels of exit orders (exactly as we’ve done previously). Stop-loss levels, however, are naturally not “initial”, but something that, in our opinion, might be entered as an order.
Since it is impossible to synchronize target prices and stop-loss levels for all the ETFs and ETNs with the main markets that we provide these levels for (gold, silver and mining stocks – the GDX ETF), the stop-loss levels and target prices for other ETNs and ETF (among other: UGLD, DGLD, USLV, DSLV, NUGT, DUST, JNUG, JDST) are provided as supplementary, and not as “final”. This means that if a stop-loss or a target level is reached for any of the “additional instruments” (DGLD for instance), but not for the “main instrument” (gold in this case), we will view positions in both gold and DGLD as still open and the stop-loss for DGLD would have to be moved lower. On the other hand, if gold moves to a stop-loss level but DGLD doesn’t, then we will view both positions (in gold and DGLD) as closed. In other words, since it’s not possible to be 100% certain that each related instrument moves to a given level when the underlying instrument does, we can’t provide levels that would be binding. The levels that we do provide are our best estimate of the levels that will correspond to the levels in the underlying assets, but it will be the underlying assets that one will need to focus on regarding the signs pointing to closing a given position or keeping it open. We might adjust the levels in the “additional instruments” without adjusting the levels in the “main instruments”, which will simply mean that we have improved our estimation of these levels, not that we changed our outlook on the markets. We are already working on a tool that would update these levels on a daily basis for the most popular ETFs, ETNs and individual mining stocks.
Our preferred ways to invest in and to trade gold along with the reasoning can be found in the how to buy gold section. Additionally, our preferred ETFs and ETNs can be found in our Gold & Silver ETF Ranking.
As always, we'll keep you - our subscribers - updated should our views on the market change. We will continue to send out Gold & Silver Trading Alerts on each trading day and we will send additional Alerts whenever appropriate.
The trading position presented above is the netted version of positions based on subjective signals (opinion) from your Editor, and the Tools and Indicators.
As a reminder, Gold & Silver Trading Alerts are posted before or on each trading day (we usually post them before the opening bell, but we don't promise doing that each day). If there's anything urgent, we will send you an additional small alert before posting the main one.
=====
Latest Free Trading Alerts:
Last week, several U.S. economic reports were released. What do they imply for the gold market?
=====
Hand-picked precious-metals-related links:
PRECIOUS-Gold hits 3-wk peak as investors shun equities on Trump worries
ICE delays launch of clearing for London gold benchmark - sources
India remains gold's best hope in 2017
=====
In other news:
Stocks Retreat, Havens Gain as Trump Trade Wobbles: Markets Wrap
Fed's Kaplan Sees 3 Rate Hikes in 2017
What Are Economic Bubbles, and What Causes Them to Burst?
Oil prices slide on bulging U.S. crude inventories
=====
Thank you.
Sincerely,
Przemyslaw Radomski, CFA
Founder, Editor-in-chief, Gold & Silver Fund Manager
Gold & Silver Trading Alerts
Forex Trading Alerts
Oil Investment Updates
Oil Trading Alerts

