Fibonacci Retracement
Fibonacci retracement levels are a useful tool that can help you determine how much of a move in a given part of the main trend will retrace before that trend is resumed. Fibonacci retracements have been very useful in gold, silver and mining stocks as well as currency markets.
The idea that after a move in the direction of the main trend, the price retraces some of the covered distance, is quite old. It was already proposed by Charles Dow during his work on the functioning of the stock market, that the breadth of this retracement was from 33% to 66%
This idea was further refined by Ralph Nelson Elliott who employed more accurate retracement levels: 38.2%, 50% and 61.8%, obtained using the Fibonacci sequence – a sequence discovered by an Italian mathematician Leonardo Fibonacci in the thirteenth century.
The Fibonacci Sequence and the Ratios Used as Retracement Levels
The Fibonacci sequence is: 1, 1, 2, 3, 5, 8, 13, 21, 34, 55, 89, 144, … (it goes on this way to infinity). In other words, each term (starting from the third) is a sum of the two preceding ones: 1+1=2, 1+2=3, 2+3=5, 3+5=8 and so on.
What is more important, in terms of stock market applications, is the way that individual elements of the sequence are related:
- The ratio of an element of the sequence to its predecessor approaches 1.618 as we proceed to infinity (the convergence begins to take shape after a couple of elements: 1/1=1, 2/1=2, 3/2=1.5, 5/3=1.667, 8/5=1.6, 13/8=1.625, 21/13=1,615, 34/21=1.619, 55/34=1.618, and so on). This number is called the golden ratio or the phi number and is ubiquitous both in nature (e.g. proportions of human body, the solar system, DNA) and in the society (e.g. art and architecture, music), and – as will be shown later – in the stock market.
- The ratio of an element of the sequence to its successor approaches 0.618 as the sequence proceeds to infinity (also in this case the convergence begins to take shape after a couple of terms: 1/1=1, 1/2=0.5, 2/3=0.667, 3/5=0.6, 5/8=0.625, 8/13=0.615, 13/21=0.618, and so on). It is the reciprocal of the phi number.
- The ratios of alternate numbers converge to 2.618 or its inverse – 0.382. For instance, 55/21=2.619 and 21/55=0.382.
Two of these ratios are most important when it comes to constructing Fibonacci retracement levels, namely 0.382 and 0.618 (corresponding to 38.2% and 61.8%) which are used instead of the “traditional” 33% and 66% proposed by Dow. This approach suggests that in a very strong trend, prices will retrace approximately 38% after reaching the top or bottom, and before continuing to move further. In a weaker trend, the maximum retracement is around 62% of the previous move.
How the Fibonacci Sequence Was Discovered
Fibonacci came up with this sequence considering a pair of breeding rabbits, or – to be more exact – the number of pairs of rabbits after a particular number of periods.
It is assumed that each pair matures in two months, and produces a new pair every month thereafter, starting at the end of the second month of their life. We also assume that no pair of rabbits dies.
- We begin with one pair in Month 1.
- In Month 2 there is still a single pair of rabbits. At the end of this month it gives birth to the second pair.
- In Month 3 there are two pairs of rabbits, one of them (born last month) is still immature, so only one pair is born at the end of Month 3.
- In Month 4 there are three pairs of rabbits, one of which (born last month) is still immature, so only two pairs are born at the end of Month 4.
- In Month 5 there are five pairs of rabbits, two of which (born last month) are still immature, so only three pairs are born at the end of Month 5.
- If we continue this process, we observe that in a given month, the number of rabbits is equal to the number of rabbits in the previous month (because no pair dies) plus the number of pairs that could be produced two months before (as the rabbits need two months to mature). A table below presents the first 7 months:
|
Month |
0 |
1 |
2 |
3 |
4 |
5 |
6 |
|
Number of pairs |
1 |
1 |
1+1= 2 |
2+1= 3 |
2+3= 5 |
5+3= 8 |
8+5= 13 |
As was stated above the number of pairs can be described by the following formula:
Number of pairs of rabbits in the n-th month = Number of pairs of rabbits in the (n-1)-th month + Number of pairs of rabbits in the (n-2)-th month
Or in a more general way (denoting the n-th term of the sequence by a_n)
a_n = a_(n-1) + a_(n-2)
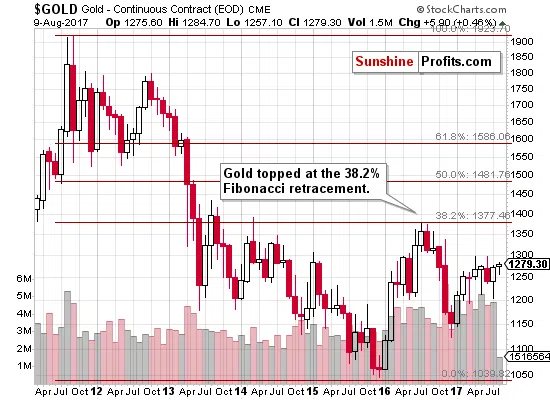
Fibonacci Retracement and Gold
The Fibonacci retracement is a technique that's quite useful on the gold market - the price of the yellow metal often stops its price swings once one of the retracement levels is reached. You can see details on the chart below.
Fibonacci Retracement and Silver
On the chart below we can see an application of the Fibonacci retracement levels to the silver market (charts courtesy of http://stockcharts.com/).
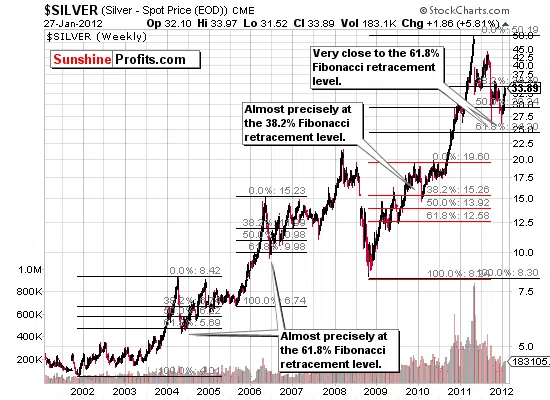
The support levels obtained through the use of Fibonacci retracement levels proved accurate in the analysis of silver price movements. Fibonacci retracement levels for gold have proven very valuable many times as well.
Conclusion
Fibonacci retracement levels prove a useful tool in predicting the breadth of a counter-trend move, after the price reaches a local top and before the main trend is resumed and they serve as important support or resistance levels. They have their foundations in a mathematical relations ubiquitous in nature and in the society, which alone makes them somewhat credible but – what is far more important – can be seen in the stock exchange quite often.