
Forex Trading Alert originally sent to subscribers on April 15, 2014, 4:02 PM.
The common currency declined against the U.S. dollar after stronger-than-expected U.S. economic data. Earlier today, the Labor Department showed that the CPI rose 0.2% in March (above expectations for a 0.1% increase), while the core consumer price index (without volatile food and energy items) rose 0.2% last month (also above forecast of a 0.1% gain). Thanks to these better-than-expected numbers, the exchange rate tested the strength of the major support line. Will it stop sellers?
In our opinion the following forex trading positions are justified - summary:
- EUR/USD: none
- GBP/USD: short (stop-loss order: 1.6855)
- USD/JPY: none
- USD/CAD: none
- USD/CHF: none
- AUD/USD: none
EUR/USD
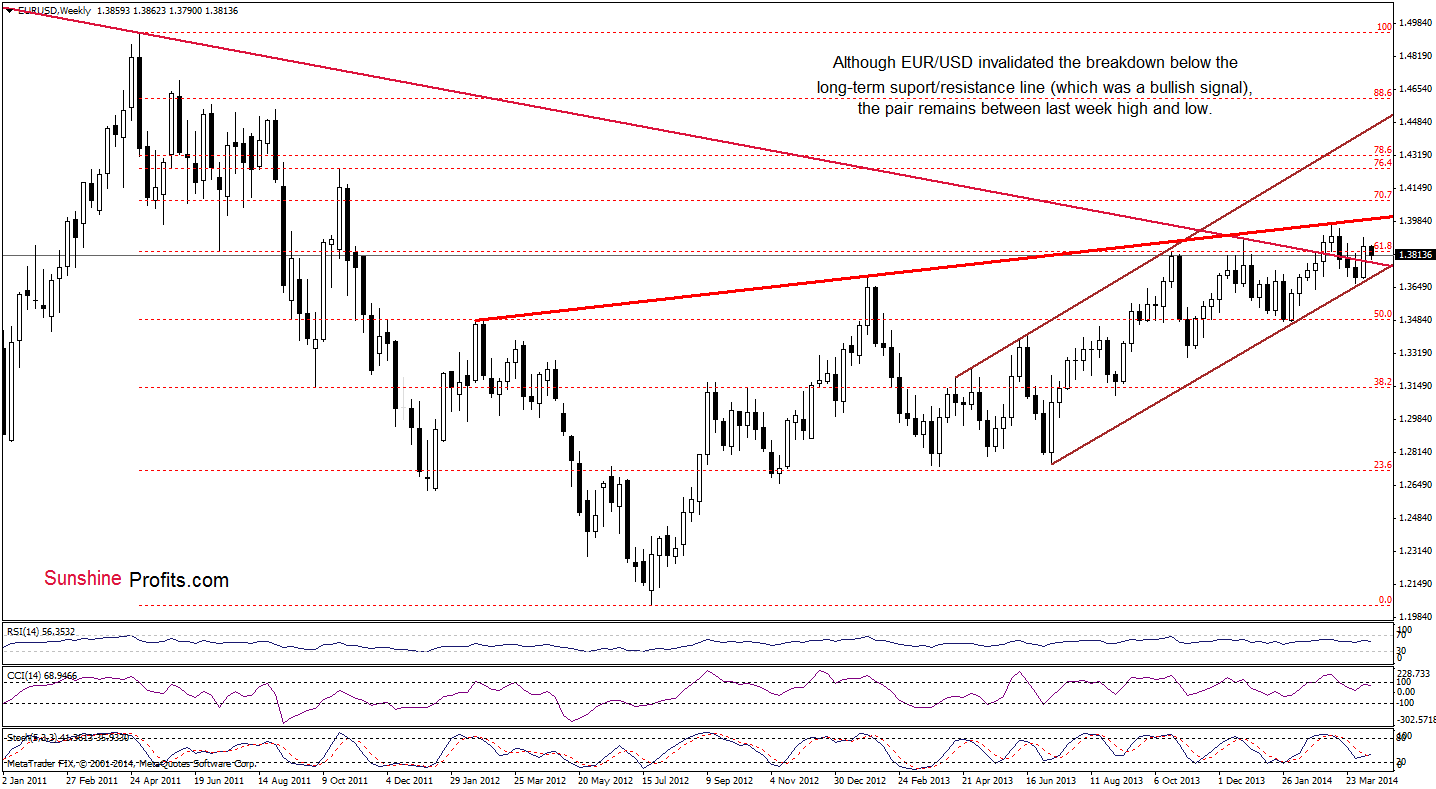
From the weekly perspective, we see that EUR/USD still remains above the previously-broken long-term declining resistance line and the lower border of the rising trend channel (marked with brown). So, what we wrote in our previous Forex Trading Alert is still up-to-date.
(…) These two important lines still serve as major support. As you see on the above chart, the exchnge rate remains below the 2014 high and the rising resistance line (marked with red), which succesfully stopped growth in the previous month. From this perspective, it seems that as long as these key lines are in play, a bigger upward or downward move is not likely to be seen.
Let’s take a look at the daily chart.
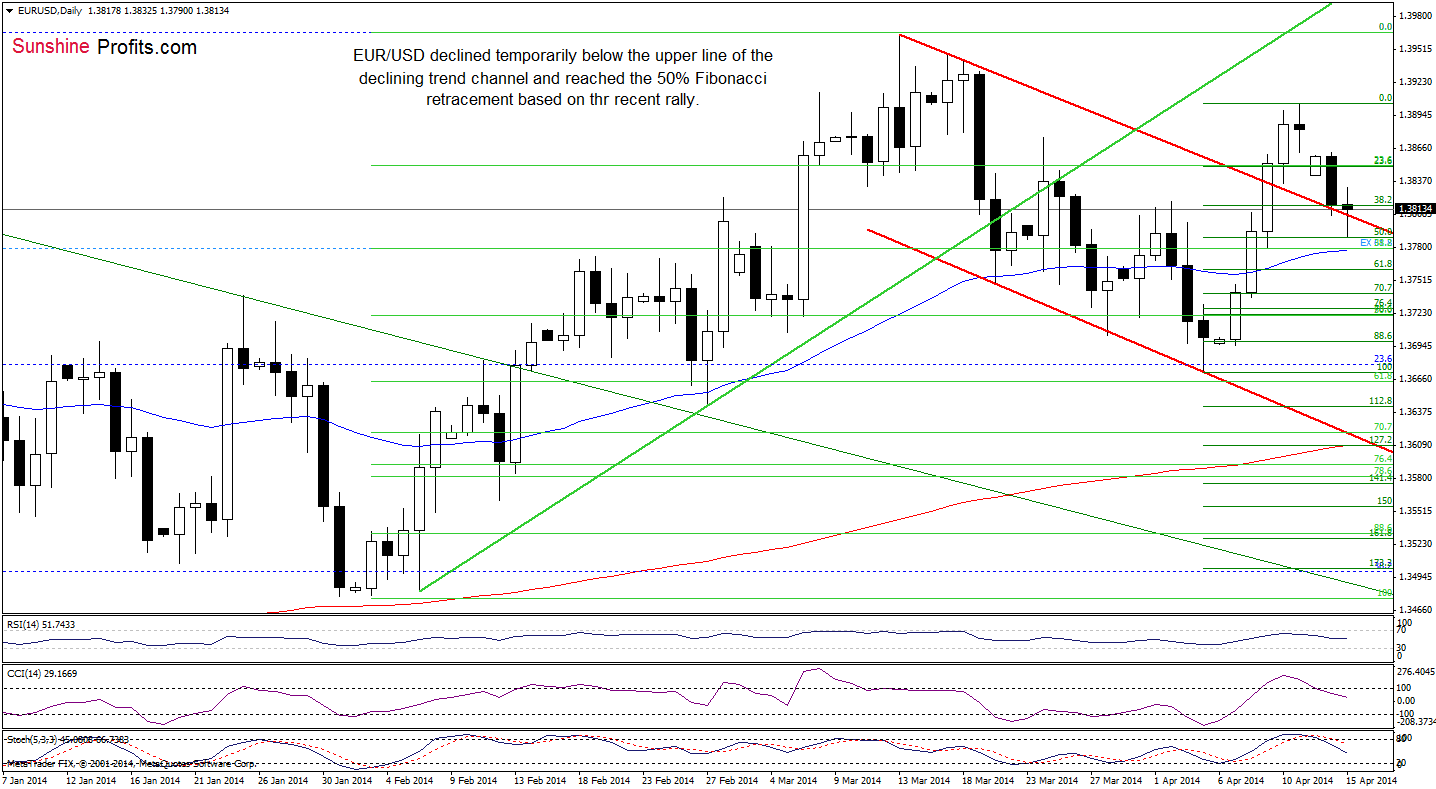
As you see on the daily chart, EUR/USD slipped below the upper line of the declining trend channel and reached the 50% Fibonacci retracement level (based on the recent rally) earlier today. Although this support level encouraged buyers to act (which resulted in a corrective upswing), the pair still remains quite close to this important line. If it holds, we may see another corrective upswing in the near future. However, if it is broken, we will likely see further deterioration in the coming days and the initial downside target will be around 1.3777, where the long-term declining line is (please note that in this area is also the 50-day moving average). Additionally, the position of the indicators (sell signals remain in place) favors sellers at the moment.
Very short-term outlook: bearish
Short-term outlook: bearish
MT outlook: bearish
LT outlook: bearish
Trading position: In our opinion no positions are justified from the risk/reward perspective. We are not opening short positions just yet, because of the divergence on the long-term charts (we wrote more about this situation in our Forex Trading Alert posted on Thursday), however we will quite likely open it once we see some kind of confirmation. We will keep you informed should anything change, or should we see a confirmation/invalidation of the above.
GBP/USD
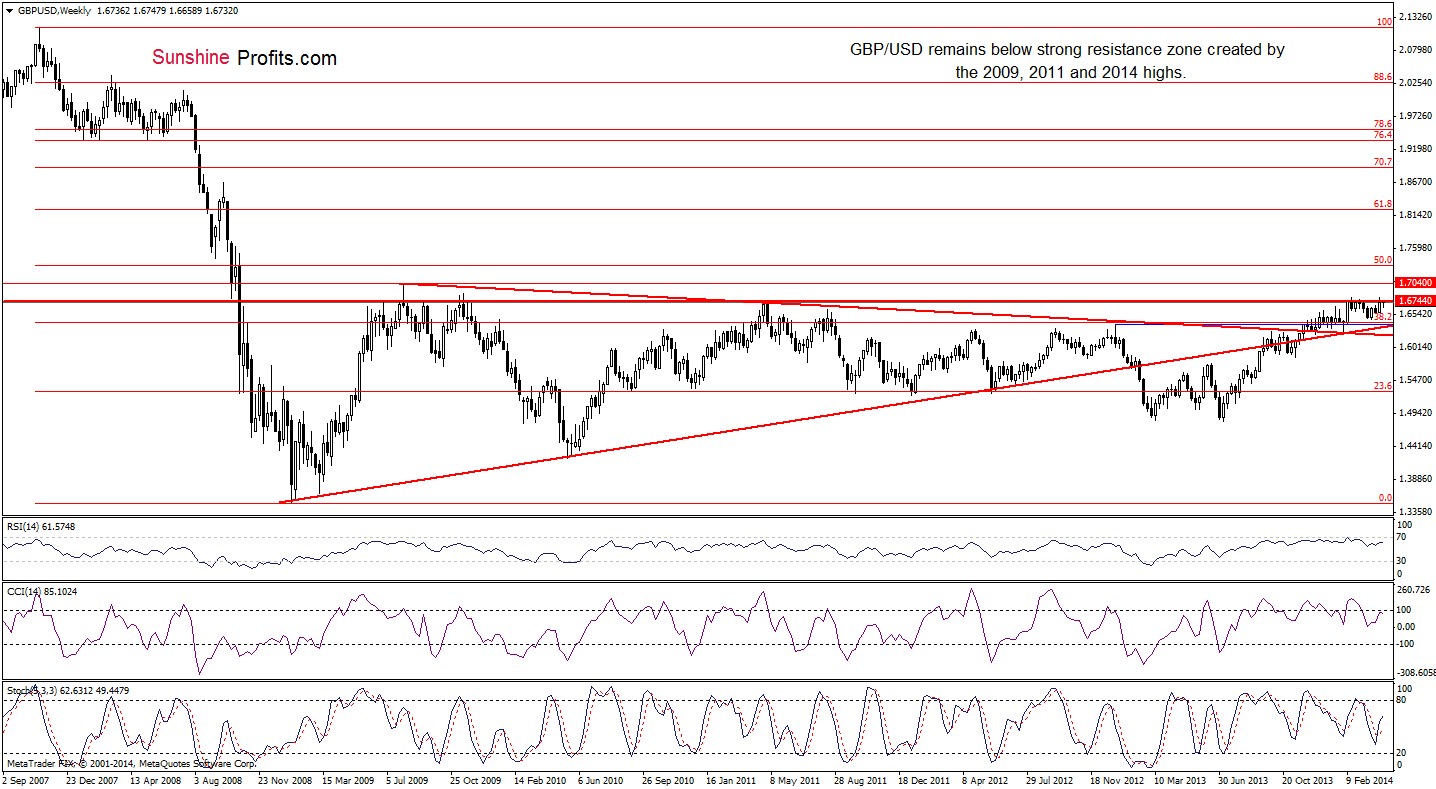
From the weekly perspective, we see that the situation hasn’t changed much. So, what we wrote in our last Forex Trading Alert is still up-to-date.
(…) GBP/USD still remains below the strong resistance zone created by the 2009, 2011 and 2014 highs, which suggests that further deterioration should not surprise us. In fact, it’s likely enough to justify having a speculative short position open (the one that was opened yesterday is already profitable).
To have more complete picture of the current situation in GBP/USD, let’s take a look at the daily chart.
In our Forex Trading Alert posted on Thursday, we wrote the following:
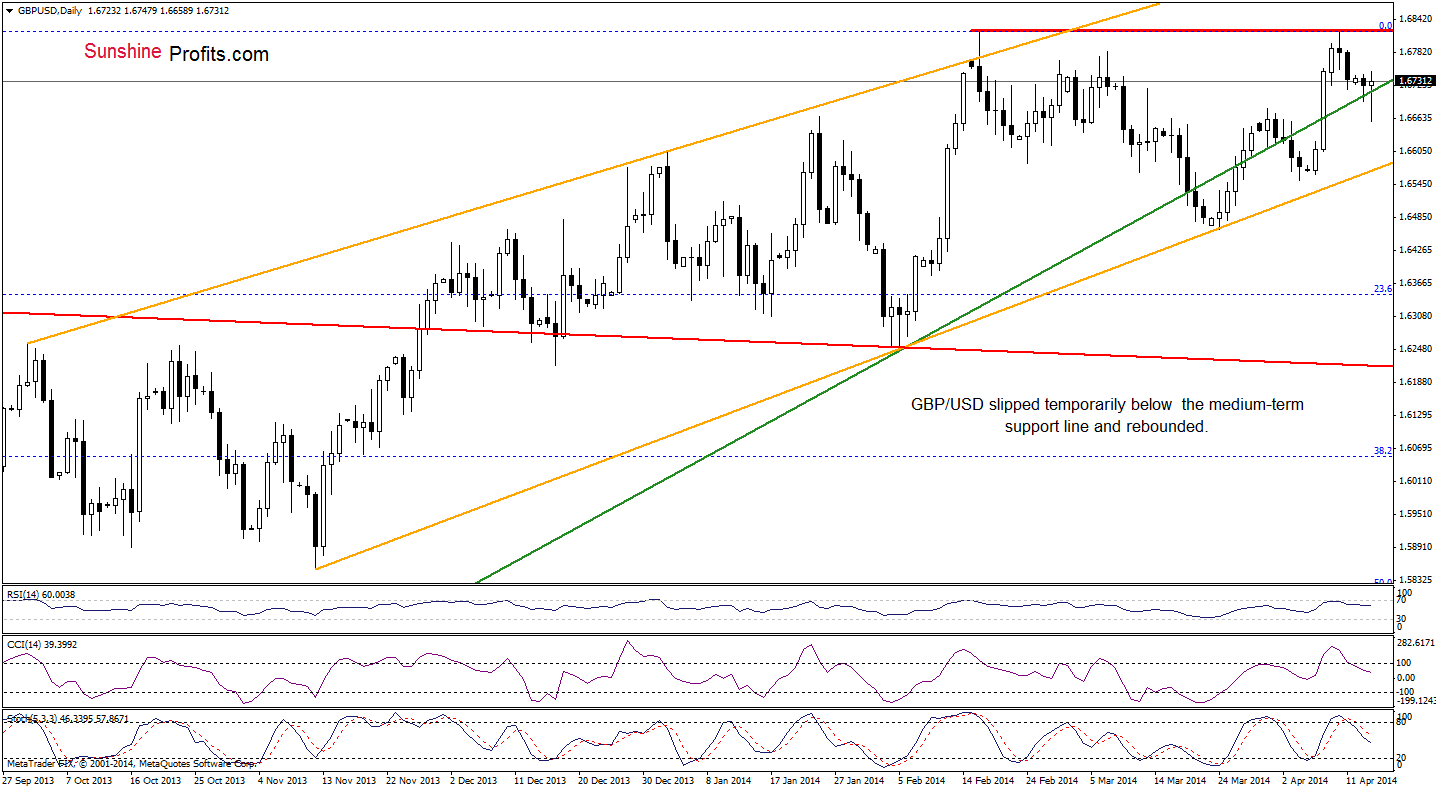
(…) GBP/USD (…) reached the 2014 high earlier today. If this strong resistance level holds, we will likely see a bearish double top pattern. In this case, the initial downside target will be the medium-term rising green line (currently around 1.6676). If it is broken, we may see a drop to the lower border of the orange rising trend channel (around 1.6550), which corresponds to the April low. (…) Please note that the current position of the indicators suggests that correction is just around the corner (…)
As you see on the above chart, GBP/USD extended declines and broke below the medium-term rising green line earlier today. Although this deterioration was only temporarily and the exchange rate came back above this line, sell signals remain in place, which suggests that another attempt to move lower should not surprise us. If this is the case, the above-mentioned downside target will be in play.
Very short-term outlook: mixed with bearish bias
Short-term outlook: bearish
MT outlook: bearish
LT outlook: mixed
Trading position (short-term; our opinion): Short. Stop-loss order: 1.6855. Please note that even if GBP/USD breaks above the 2014 high (and stop-loss order works), we’ll consider re-opening short positions around the 2009 high. At this time, however, it seems that these levels will not be reached before we see another sizable downswing – and thus the current short positions are still justified. We will keep you informed should anything change, or should we see a confirmation/invalidation of the above.
USD/JPY
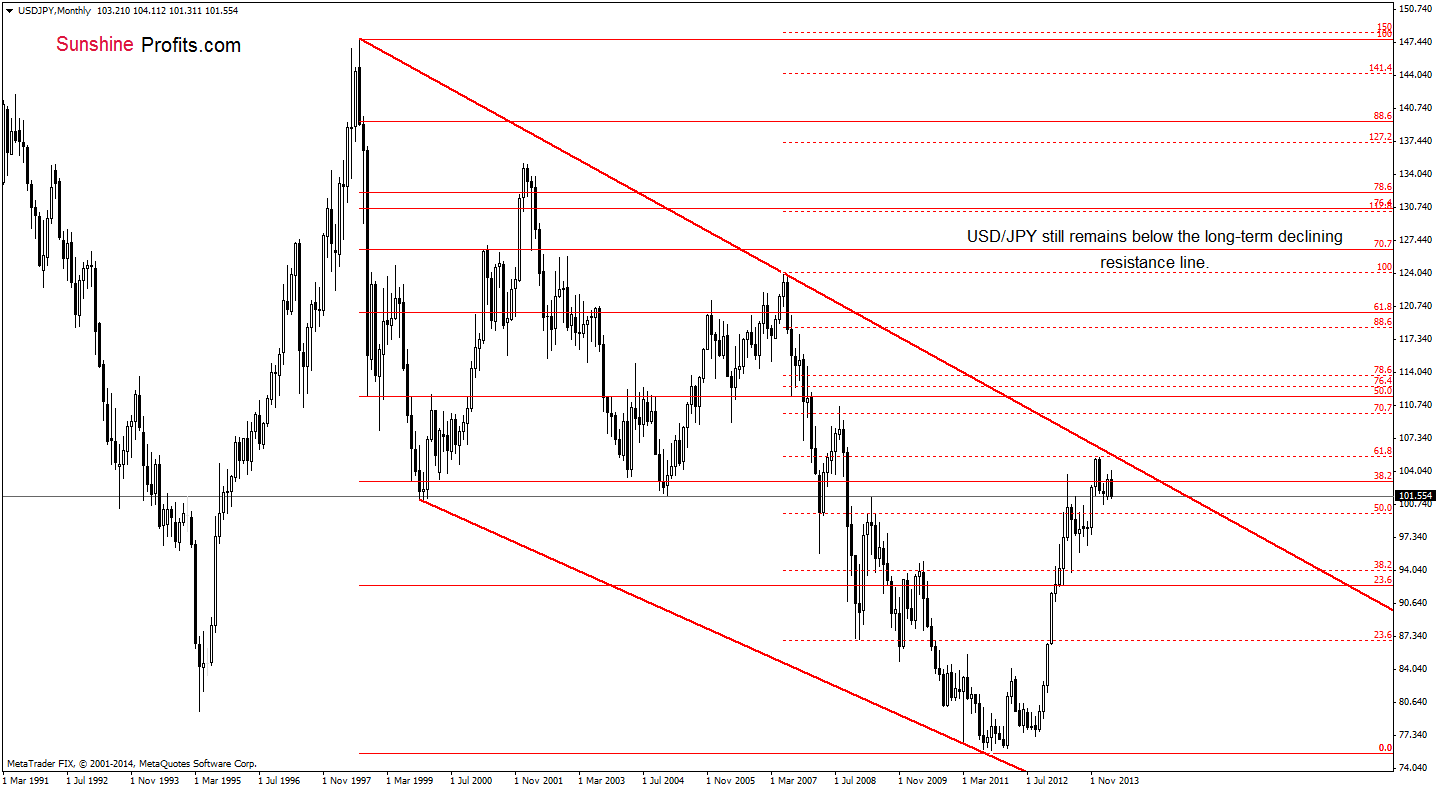
Looking at the USD/JPY from the monthly perspective, we see that the exchange rate remains below the long-term declining resistance line. Therefore, even if the pair erases losses and climbs above the April high, it seems that further gains will be limited around 105.80, where the major long-term resistance is. We might open a speculative long or short position after the currency pair breaks above the long-term resistance line, or invalidates such breakout.
Having discussed the above, let’s move on to the daily chart.
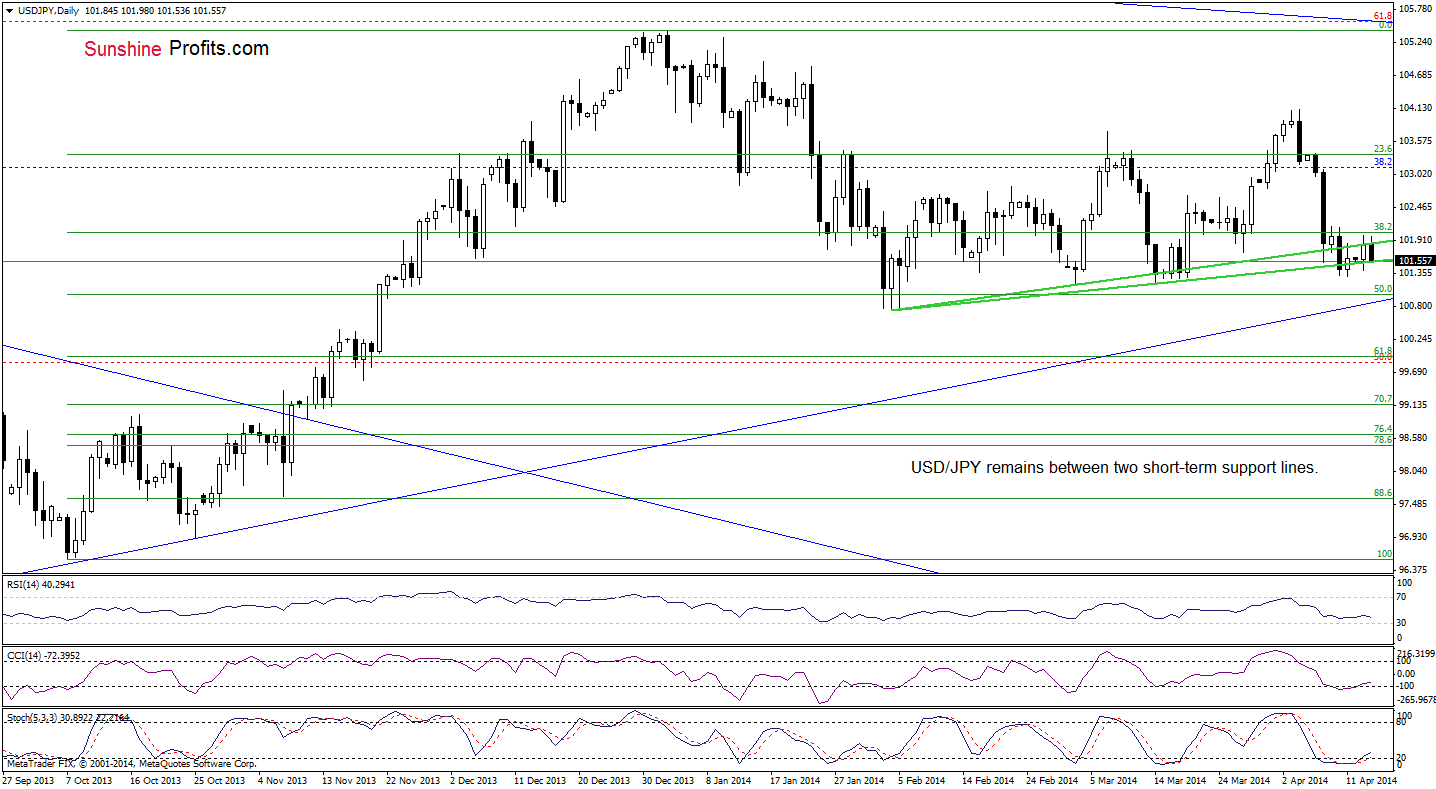
From this perspective, we see that there was another attempt to break above the upper green line, but the buyers failed, which resulted in a drop to the lower support line. If it holds, we may see another try to close the day above the upper support/resistance line. However, if it is broken, we will likely see a drop to the March 14 low or even to the February low. Nevertheless, we should keep in mind that the CCI and Stochastic Oscillator generated buy signals, which suggests that the pro growth scenario is more likely at the moment.
Very short-term outlook: mixed with bullish bias
Short-term outlook: mixed
MT outlook: bullish
LT outlook: bearish
Trading position (short-term): In our opinion no positions are justified from the risk/reward perspective at the moment. We will keep you informed should anything change, or should we see a confirmation/invalidation of the above.
USD/CAD
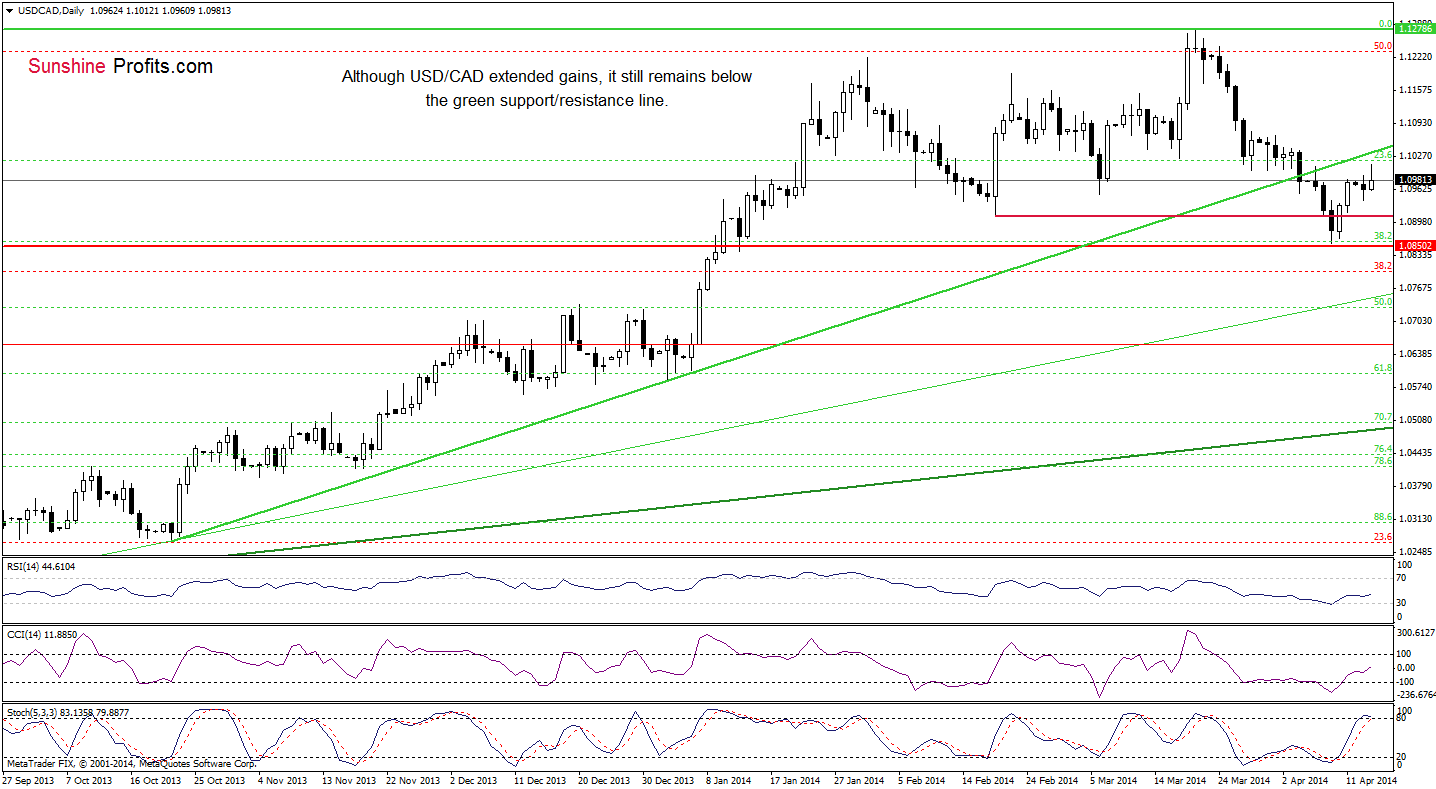
As you see on the above chart, USD/CAD extended gains and approached the previously-broken green support line earlier today. Despite this improvement, we noticed similar price action to the one that we saw yesterday – the exchange rate gave up some gains and declined. If the pair extends losses, we may see a pullback to around 1.0909 (where the Feb.19 low is) or even to the April low of 1.0857. On the other hand, if the buyers manage to push the exchange rate higher, we may see an increase to the major resistance line (currently around 1.1026). Please note that the pro growth scenario is reinforced by the current position of the indicators (the RSI bounced off the level of 30, while buy signals generated by the CCI and Stochastic Oscillator remain in place).
Very short-term outlook: mixed with bullish bias
Short-term outlook: mixed
MT outlook: bullish
LT outlook: bearish
Trading position (short-term): In our opinion no positions are justified from the risk/reward perspective. We will keep you informed should anything change, or should we see a confirmation/invalidation of the above.
USD/CHF
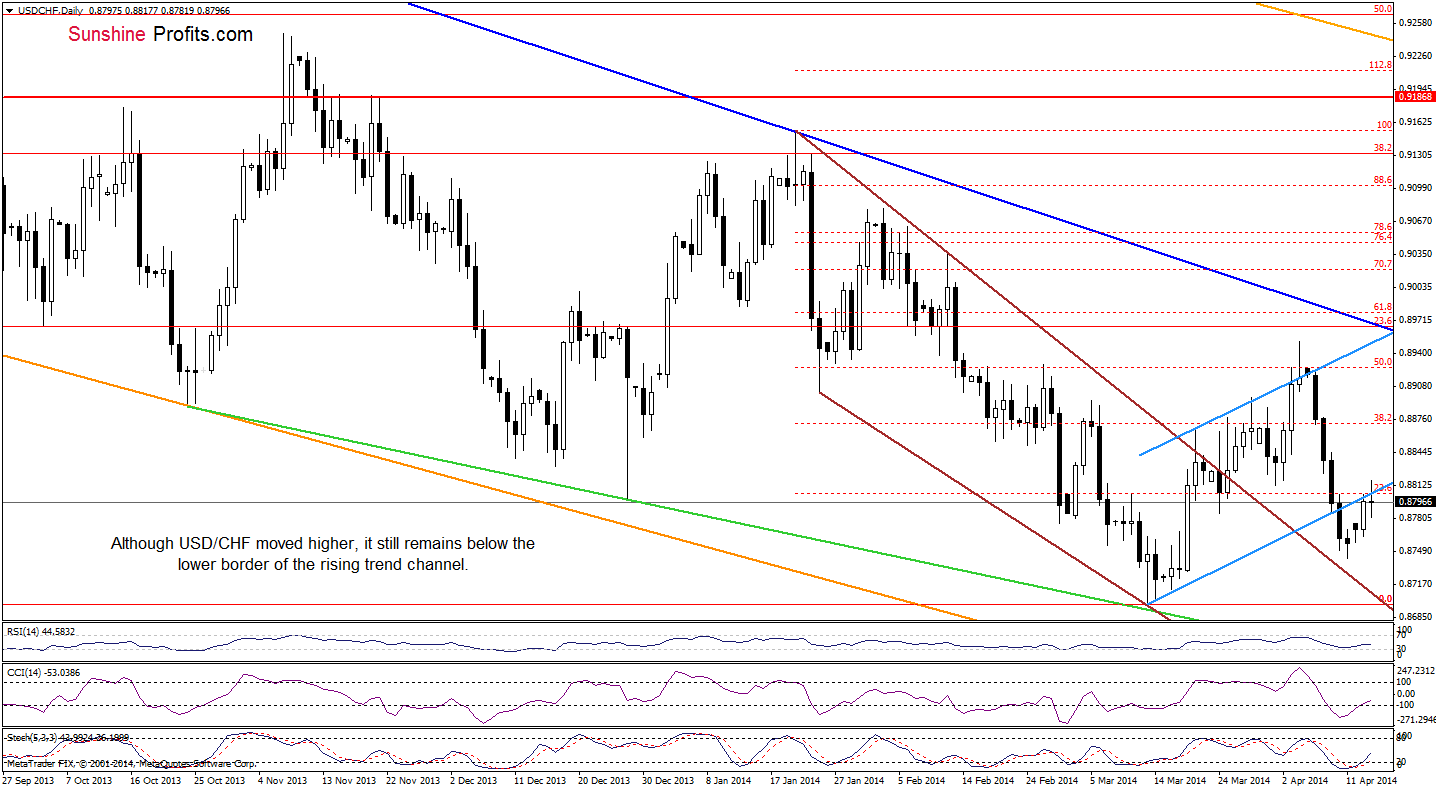
As you see on the above chart, the situation hasn’t changed much as USD/CHF remains around the lower border of the blue rising trend channel. Therefore, what we wrote yesterday, is still valid.
(…) If the buyers do not give up and break above this resistance line, we may see an increase to (at least) 0.8813, where the Apr.1 low is. However, if the fail, we will likely see a pullback to the April low or even to the declining brown line (currently around 0.8718). Please note that the RSI bounced of the level of 30, while the CCI and Stochastic Oscillator generated buy signals, which suggests that another attempt to move higher should not surprise us.
Very short-term outlook: mixed with bullish bias
Short-term outlook: mixed
MT outlook: bearish
LT outlook: bearish
Trading position (short-term): In our opinion no positions are justified from the risk/reward perspective. We will keep you informed should anything change, or should we see a confirmation/invalidation of the above.
AUD/USD
Quoting our last Forex Trading Alert:
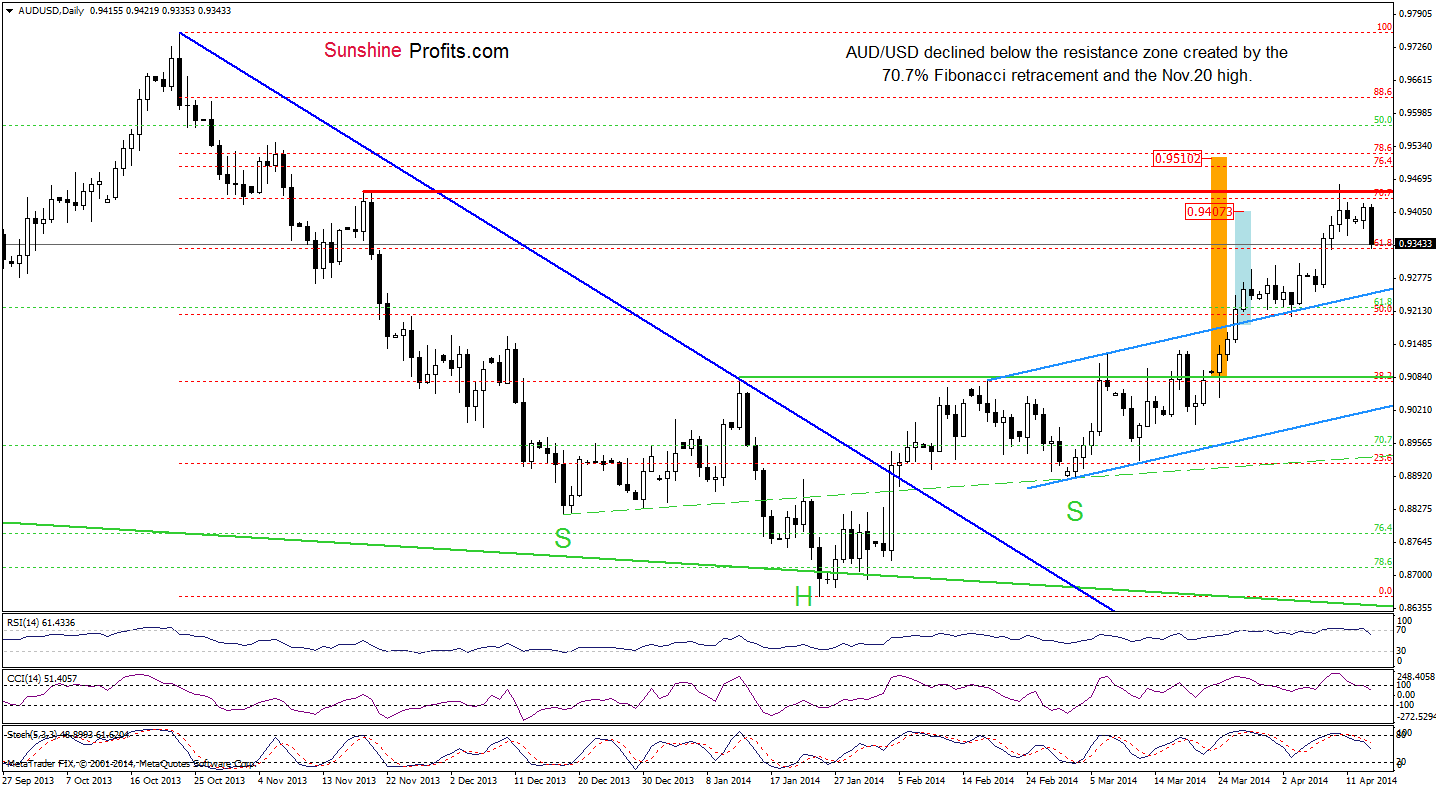
(…) the pair still remains below the resistance zone created by the 70.7% Fibonacci retracement (based on the entire Oct.-Jan. decline). If it holds, we may see a pullback in the coming days. In this case, the downside target for the sellers will be the previously-broken upper line of the trend channel. Taking into account the current position of the indicators (the RSI is overbought, while the CCI and Stochastic Oscillator generated sell signals), it seems that we will see another attempt to realize the bearish scenario in the following days.
Looking at the above chart, we see that AUD/USD gave up the gains and reversed earlier today. With this downswing, the sellers erased not only all yesterday’s gain, but also pushed the exchange rate below Friday low. Additionally, the current position of the indicators (sell signals remain in place) still favors sellers, which suggests that the bearish scenario from our last Forex Trading Alert is likely to be seen in the coming days.
Very short-term outlook: bearish
Short-term outlook: mixed with bearish bias
MT outlook: bearish
LT outlook: bearish
Trading position (short-term): In our opinion no positions are justified from the risk/reward perspective at the moment. We will keep you informed should anything change, or should we see a confirmation/invalidation of the above.
Thank you.
Nadia Simmons
Forex & Oil Trading Strategist
Przemyslaw Radomski, CFA
Founder, Editor-in-chief
Gold & Silver Trading Alerts
Forex Trading Alerts
Oil Investment Updates
Oil Trading Alerts
