

Are you as glad to see the pullback in the US equity indices as I am? Yes, rates are going up faster. Inflation has been acknowledged at a higher rate by the Fed. So what?!
It was no secret that rates could not remain near-zero forever. It also is no secret that inflation has been real in the US. If you live in the US, you already know this from your day-to-day life. So, why the big fuss? Did you need someone to tell you?
I know it is painful when long positions move against a trader quickly. Nobody expected the Fed to come out with the language that appeared this week, at least not anybody that I know. I also realize that it may seem logical to sell equities as a result. But, since when does the obviously logical approach win?
So, the overnight Fed Fund rate is scheduled to begin increasing in 2023 (potentially late 2022 if you listened to Bullard on Friday). This news must mean that the Ten-year note yield had to go up, right? Nope. Down she went on Thursday and Friday; after catching a bid on Wednesday off the news.
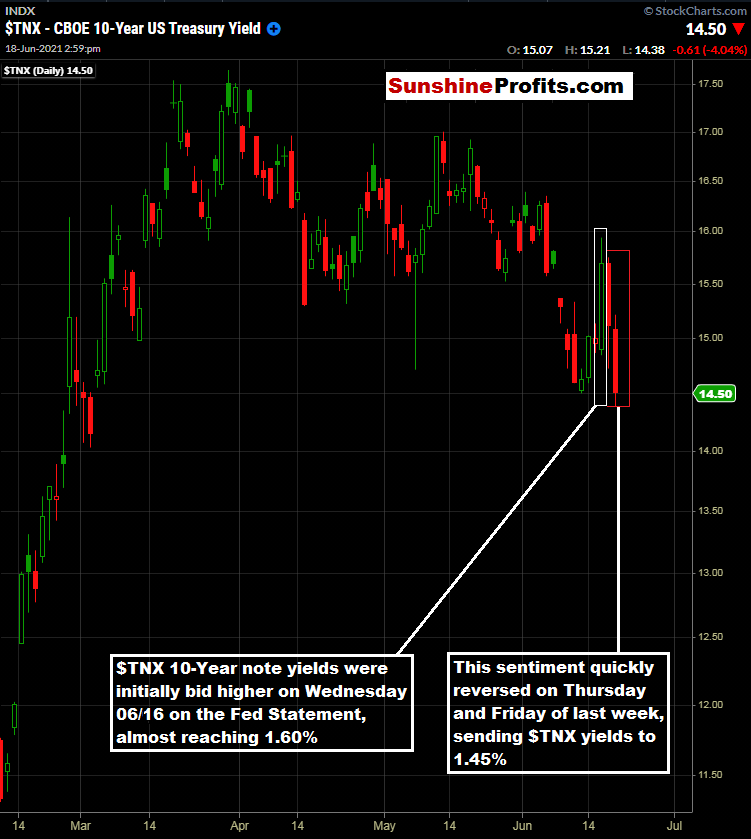
Figure 1 - $TNX Ten-year note treasury yield February 10, 2021 - June 18, 2021, Daily Source stockcharts.com
Perhaps taking a trade like that is just too obvious; too logical. Now, will $TNX increase over time? Most likely it will, but 2023 is a long time from now. We have to wait and see how the new information is digested by the market and go from there.
Can we look to apply similar logic to the S&P 500? For that question, I would like to refer back to the May 12th publication where we discussed $SPX pullbacks to the 50-day simple moving average.
From May 12th:
- $SPX found support around the 50-day moving average on 2 of its last 3 attempts.
- When $SPX broke the 50-day on 1 of the last 3 attempts, it traded below it for 2 sessions.
- When $SPX broke the 50-day in September 2020 & October 2020, it closed below it between 7 - 9 sessions.
Let’s keep in mind that the $SPX traded to the 50-day SMA on May 12th and May 19th, and is now below the 50-day SMA as I write this.
Today, for the SPY ETF traders out there, let’s take a fresh look at recent pullbacks.
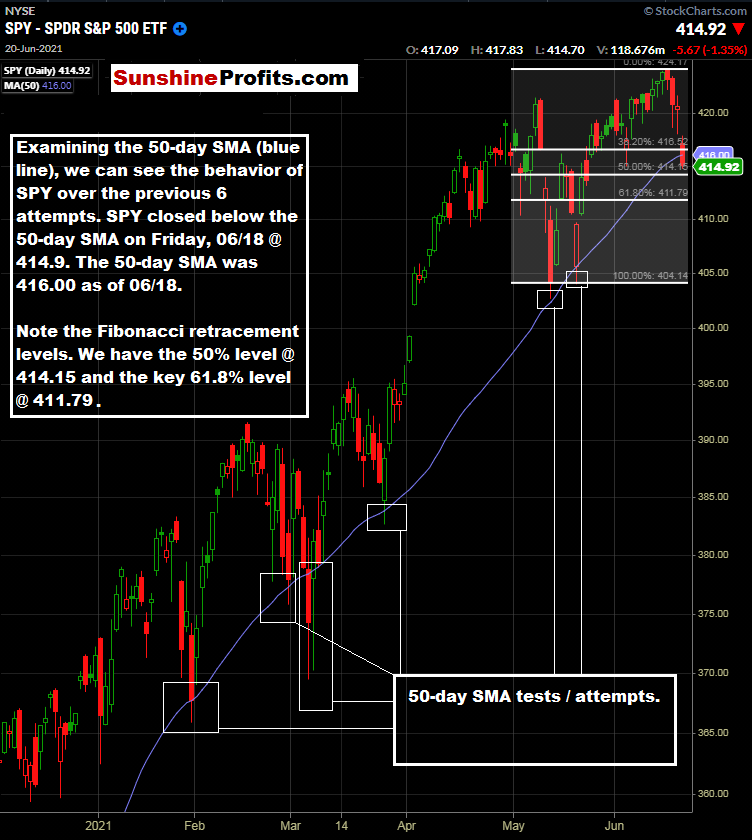
Figure 2 - SPDR S&P 500 ETF December 04, 2020 - June 18, 2021, Daily Candles Source stockcharts.com
Can the previous price action near the 50-day SMA give us any clues about what could happen this time? Well, we have the 50-day SMA, and we also have the 414.15 50% Fibonacci retracement level and the 411.79 key 61.8% retracement level. We have been waiting for such a pullback and I don’t think the recent Fedspeak is any reason to negate consideration of buying pullbacks. I know it seems somewhat illogical; that’s why I like it even more.
Keep in mind that such pullbacks to certain price levels could take place in the overnight futures sessions. In that case, ETF traders may not get the exact price they are looking for if markets reverse to the upside during NY trading hours. At least this gives us some levels to consider.
Why I Welcome this Pullback So Much
If you have been following along and are a premium subscriber, you know that I have been waiting for pullback opportunities across many markets. In fact, out of the eight markets that I am covering, I have been waiting for pullback opportunities in six of them. The current price action and additional downside momentum could give us the opportunities that we have been patiently waiting for in several ETFs.
Here is what is on the radar for Monday, June 21, 2021:
If we get continued downside price action across the indices or at least mixed action across them, we may get some potential long entry opportunities. Many of these ETFs are very close to the key levels.
1. GRID First Trust NASDAQ Clean Edge Smart Grid Infrastructure Index Fund
This one has been a nice slow upward grinder and has pulled back off the Fedspeak. I have been waiting for a pullback to bless this one again. While it is still above our initial buy idea range of $86.91 and $88.17, it did close at $89.32 on Friday.
Look for GRID between $89.29 (50-day SMA) and $88.23 (61.8% retracement).
It closed just $0.03 above its SMA on Friday. If you missed this one, I think there is still time to get on board to the long side; and like this for a swing trade to a long-term holding targeting $98 - $100 for a swing, and potentially higher prices in the long-term.
2. SPY SPDR S&P 500 ETF
Consider Longs under the 50-day SMA ($416.00 on Friday), $414.15 50% Fibonacci retracement level and $411.79 key 61.8% retracement level.
3.RZV Invesco Exchange-Traded Fund Trust - S&P SmallCap 600 Pure Value ETF
We have been waiting for a pullback to the 50-day SMA here, and we have it right now. Friday’s 50 Day SMA was $92.90. It closed at $92.72 on Friday and traded north of $100 on June 9th. This one is small-cap value, and that has been a good place to be for the majority of 2021. Consider longs under $93.00.
4. ERTH Invesco MSCI Sustainable Future ETF
This one has traded extremely well through the end of last week when the sky was falling. A quick test of the 50-Day SMA held firm on Wednesday at $74.00. Currently, the 50-day SMA is $74.04. I think this one has legs and like it for a long-term swing / long-term holding. Friday’s close @ $75.62. Look for pullbacks between $74.04 - $75.25 for a long entry. I think there is still time to get on board here.
5. QTUM Defiance Quantum ETF
Consider longs at the 50-day SMA of $47.78 or lower to $44.00. This one is AI and automation. Tech has fallen back into favor versus large-cap Dow stocks over the last week. I think there is a bright future here and am looking for a breakout above 50 as a swing trade. I will then monitor for overbought daily RSI for exit ideas.
6. BLOK Amplify Transformational Data Sharing ETF
We are going to need a further pullback here, as I am waiting for the 200-day SMA. 200-day is currently $39.70 and Friday’s close was $45.84.
To sum up the current viewpoint and opinion:
I have BUY opinions for:
- iShares Trust Russell 2000 ETF (IWM) for an index reconstitution trade. At this time, I would be looking to be long and then exiting upon the actual reconstituted index going into place on June 28, 2021. Buy the rumor, sell the fact type of trade. Buy Pullbacks. For equity-bearish folks, see the IWM/SPY spread idea in the May 27th publication. Update 06/21: I am staying with the original game plan suggesting holding until June 28th, 2021. Always use a stop loss level that caters to your individual risk tolerance.
- Defiance Quantum ETF (QTUM) between $44.00 - $49.50. Update 06/17: QTUM closed at $49.08 on Wednesday. In case you missed this one, I think there is still time to get on board and will raise the buy idea zone to $44.00 - $49.50. It looks like it wants to break out of its range soon, but could find some sellers at the psychologically important $50 level. Update 06/21: See Above. Always use a stop loss level that caters to your individual risk tolerance.
- Amplify Transformational Data Sharing ETF (BLOK) between the 200-day moving average and $40.00 200-Day Moving Average is currently $39.70 (06/17). BLOK has a history of high volatility, so proceed with caution. Always use a stop loss level that caters to your individual risk tolerance. Update 06/17: Patience still. I want to jump on board, but prefer to see how Bitcoin negotiates the $40,000 level. Wait for $40.00 to the 200-Day moving average. It could happen soon. Monitoring. Update 06/21: See Above. Always use a stop loss level that caters to your individual risk tolerance.
- Invesco MSCI Sustainable Future ETF (ERTH) between $67.76 - $70.82. Always use a stop loss level that caters to your individual risk tolerance. Update 06/17: ERTH closed in the green @ $75.74 on Wednesday bucking the overall market trend on FOMC day. This is a great sign. Hold longs. Chugging along. If you missed this one, let’s see if we can get a pullback to the 50-day moving average, which currently sits at $74.00. (This happened on Wednesday briefly, I hope you caught it if you are not on board yet!) I am liking this one more and more for a long-term holding and will be willing to hold through short-term pullbacks at this time. Update 06/21: See Above. Always use a stop loss level that caters to your individual risk tolerance.
- Invesco Exchange-Traded Fund Trust - S&P SmallCap 600 Pure Value ETF (RZV) at the 50-day moving average. Patience and wait for the pullback. Always use a stop loss level that caters to your individual risk tolerance. Update 06/17: RZV 50-day MA is 92.67 as of the close Wednesday. Monitoring. This one bucked the downtrend on Wednesday too and finished higher. Update 06/21: See Above. Always use a stop loss level that caters to your individual risk tolerance.
- iShares Global Timber & Forestry ETF (WOOD) Initial buy idea zone between $79.07 and the 200-day moving average ($79.82 as of 06/16 close). Update 06/16: Given the price action in the lumber futures described in today’s alert, consider an entry into ½ of a normal position size between $86.50 - $87.50. Should it pull back further, we can look to add another ½ position size. Update 06/17: WOOD provided the entry opportunity levels that we were looking for on Wednesday and even finished higher on the day. What a great sign. Look to be long on this underappreciated ETF. Update 06/21: WOOD traded through our first tranche level between $86.50 and $87.50. It closed Friday @ $84.15. I am looking at the above-mentioned price levels between $79.16 and $79.82 - $80.00 for the second tranche. See Above. Always use a stop loss level that caters to your individual risk tolerance.
- SPDR S&P 500 ETF (SPY) between $412.26-$413.10 (61.8% Fibonacci retracement level) and the 50-day moving average ($416.90 as of the close on June 15th). Always use a stop loss level that caters to your individual risk tolerance. Update 06/17: Be alert SPY traders, you may get your chance this week. Update 06/21: See Above. Always use a stop loss level that caters to your individual risk tolerance.
- Invesco Solar ETF (TAN) between the 50-day moving average ($80.32 as of June 14th) and $81.50. Look for an intraday pullback for entry. Update 06/16: We wanted a pullback, and we got a big one on Tuesday, with the range being $78.00 - $80.69. Ideally, this was taken advantage of on this pre-Fed meeting day. There could have been some “sell the news” price action with the SEIA report being released yesterday. Although we are below the 50-day MA, I like the previous consolidation and would look to be long at these levels. Update 06/17: TAN tacked on 1.51% in Wednesday’s overall down session. Great sign. I like this one and I think there is still time to get on board. Always use a stop loss level that caters to your individual risk tolerance. Update 06/21: We really nailed this entry and I am looking for continued upside. I think there is still time to get on board - look for pullbacks near the $81.00 level. I like this for a longer-term holding with price appreciation potential north of $100.00. Always use a stop loss level that caters to your individual risk tolerance.
- First Trust NASDAQ Clean Edge Smart Grid Infrastructure Index Fund (GRID). GRID has traded through our idea range of between $86.91 and $88.17. Update 06/17: GRID closed at $91.50 yesterday, moving lower on the overall down day. I see no major technical damage and like this one over the longer run. Opinion: hold existing longs and.or look for entries on pullbacks. Update 06/21: See Above. Always use a stop loss level that caters to your individual risk tolerance.
I have SELL opinions for:
NONE
I have a HOLD opinion for:
NONE
Today, I added some additional details for many instruments that we are following, as I think the markets may give us some potential long entry opportunities at this time. Have a great day out there today and be ready for entries on pullbacks. Thanks for reading today’s update!
Thank you,
Rafael Zorabedian
Stock Trading Strategist

