

As the S&P 500 marches on, the VIX is trading at pre-pandemic levels. Will the fear index remain subdued all Summer, or could a return of volatility be in the cards?
Last week seemed to be one of those weeks where the market could do no wrong. After digesting the previous week’s interest rate stance changes from the Fed, the S&P 500 just kept climbing and climbing last week, reaching all-time highs once again. Weak economic data print via Flash Services PMI? No problem; market higher. Unemployment Claims printing higher than expected? Also, no problem. Weak New Home Sales print? The market said no problem. The S&P 500 had plenty of upside to get last week, and it got it. What about this week?
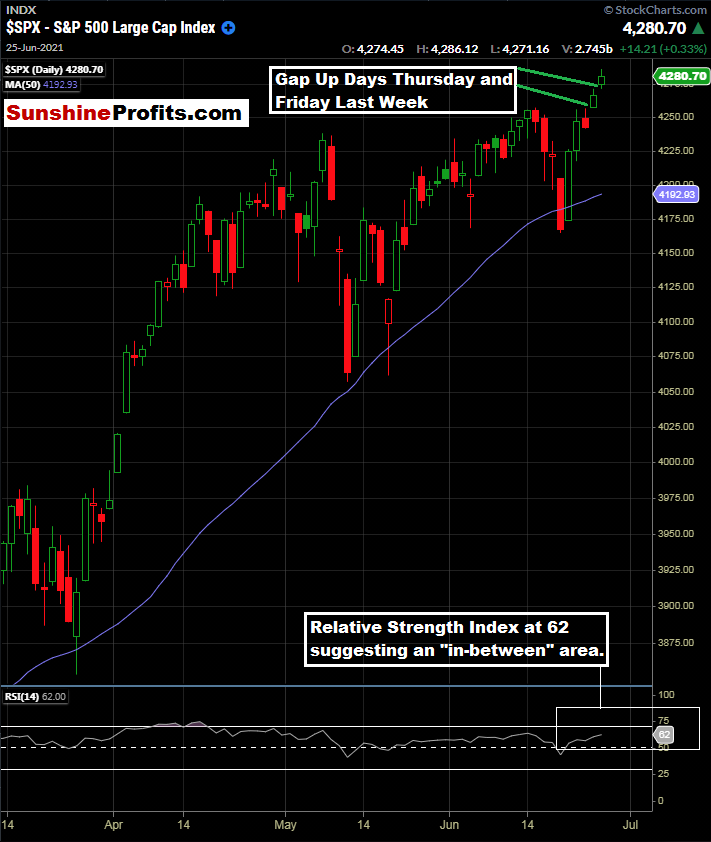
Figure 1 - S&P 500 Index March 13, 2021 - June 25, 2021, Daily Candles Source stockcharts.com
Towards the end of last week, we had two gap higher opens in a row; on Thursday and Friday. At the same time, we really do not have an extreme overbought condition via RSI(14), with the reading at 62. We closed at all-time highs on Thursday and Friday, and things have been looking rosy for the bulls.
So, while we were having these strong up days at the end of last week, I started watching the $VIX intraday, looking at not only the cash $VIX; but the front-month VX futures as well. I indeed noticed a solid bid under the market (especially in the VX front-month futures). While the volatility was still lower, there was indeed some bid to the market; you could just feel it and see it by watching. So, let’s take a look at the $VIX:
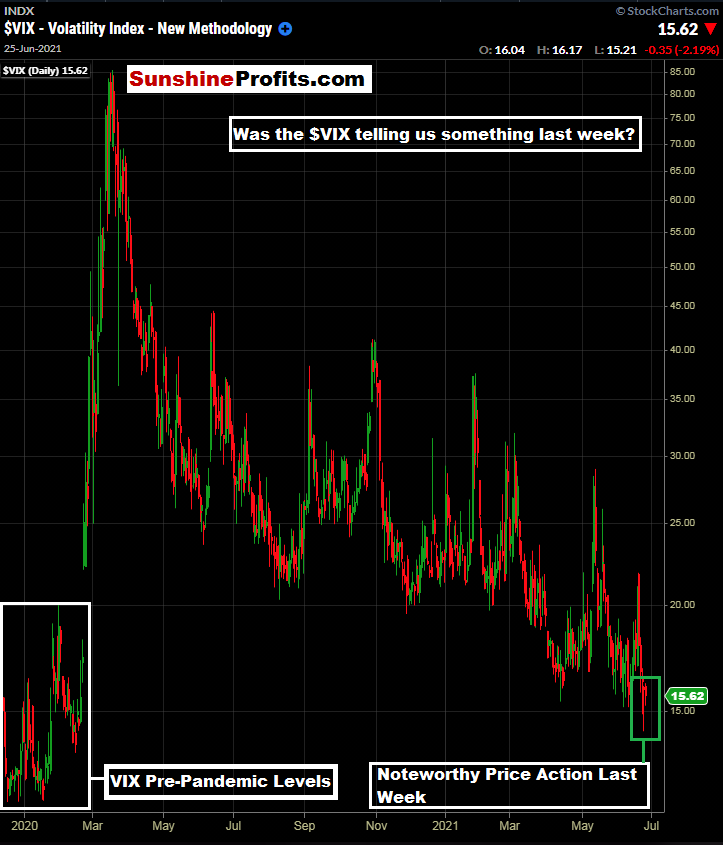
Figure 2 - $VIX Volatility Index December 9, 2019 - June 25, 2021, Daily Candles Source stockcharts.com
Above, we see the $VIX at its pre-pandemic levels and our current levels. What caught my eye last week (especially on Thursday and Friday) was the bid under the Volatility Index, even as the S&P 500 advanced higher and made all-time highs on gap-up days.
While the $SPX and $VIX do not have a 100% inverse correlation, they are certainly inversely correlated for the most part. Let’s take a more zoomed-in look at the daily price action late last week:
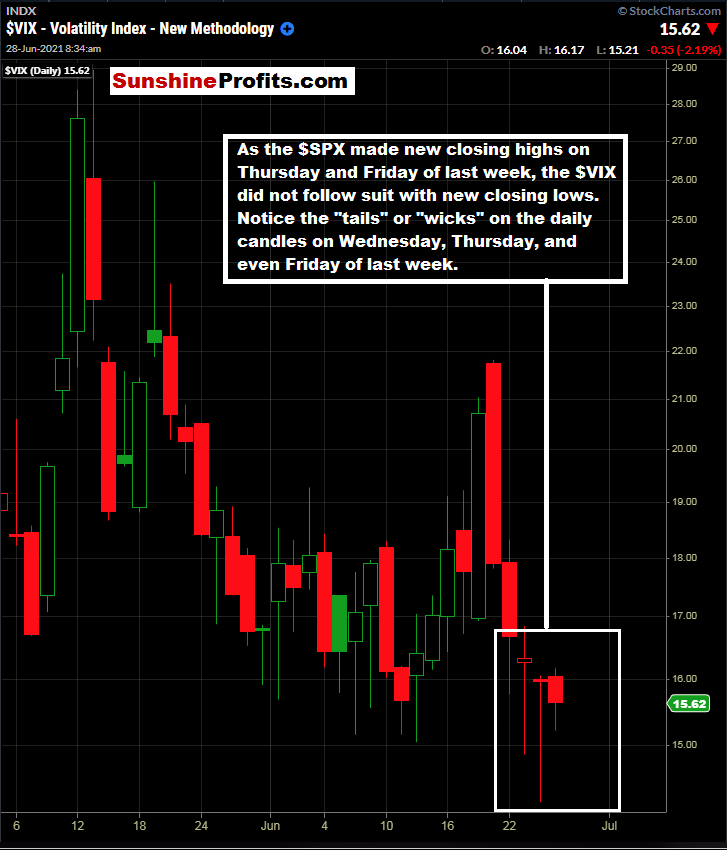
Figure 3 - $VIX Volatility Index May 5, 2021 - June 25, 2021, Daily Candles Source stockcharts.com
Divergences like we see here really capture my attention. Clearly, there was a bid under the Volatility Index last week, even as the $SPX was trading new highs.
It only makes sense. Money managers of all kinds are wise to use all-time highs to hedge portfolios by purchasing protection in the form of $VIX calls when volatility is low. Could this be a prelude to things to come over the Summer? What do you think?
It seems that we are at an “in-between” point of some sorts. While the $SPX is not flashing any extremely overbought technical warning signs, it has risen quickly from its 50-day moving average. Combining that fact with the price action in the $VIX last week, it all paints an inconclusive picture for me at the moment.
I think it is wise to be in tune with the state of the $SPX and $VIX; and their relationship with one another.
This week, we have the big Non-Farm Payroll data on Friday, and the market will be waiting for that data. The above-described divergence could be a sign of overall sideways price action heading into the number on Friday.
Today is the exit day for the IWM trade that we initiated back on May 27. The index is now reconstituted, and an exit is suggested as planned for today, regardless of price. Based on the pricing in the futures pre-market, it looks like a favorable exit point.
To sum up the current viewpoint and opinion:
I have BUY opinions for:
- Defiance Quantum ETF (QTUM) between $44.00 - $49.50. Update 06/25: This one is still in the upper area of our buy idea zone. Look for pullbacks for entries near the 50-day SMA (currently $47.77). Always use a stop loss level that caters to your individual risk tolerance.
- Amplify Transformational Data Sharing ETF (BLOK) between the 200-day moving average and $40.00 200-Day Moving Average is currently $40.43 Update 06/25: I have the same outlook here: Bitcoin and crypto have gotten slammed, but I am in no rush. There could be another shoe to drop. Patience. Always use a stop loss level that caters to your individual risk tolerance.
- Invesco MSCI Sustainable Future ETF (ERTH) between $65 and $66. Update 06/22: Important note on ERTH: This one had me scratching my head on the open yesterday and then I quickly discovered that there had been a $9.95 dividend issued. You can read about the dividend on Invesco’s website here. Call your broker if you have any questions about how the dividend was applied to your account. This dividend was abnormally high for ERTH based on the past. Since $9.95 came out of the stock price in the form of a dividend, we must adjust our pricing outlook by $9.95. I like this name for the longer-term around $65-$65.80 (dividend adjust price) at this time. Update 06/25: I like the theme of this ETF. Look to enter on pullbacks between $65 and $66.00. Always use a stop loss level that caters to your individual risk tolerance.
- Invesco Exchange-Traded Fund Trust - S&P SmallCap 600 Pure Value ETF (RZV) on pullbacks. Update 06/22: This one touched the 50-day MA on Friday (we were waiting for that!) and tacked on 2.51% in yesterday’s session. If you didn’t catch the big pullback, look to enter on any pullback from $93 - $94.90. Update 06/25: I still think this has legs. If not on board yet, look for intraday pullbacks in the low to mid $95’s. Always use a stop loss level that caters to your individual risk tolerance.
- iShares Global Timber & Forestry ETF (WOOD) Initial buy idea zone between $79.07 and the 200-day moving average ($79.82 as of 06/16 close). Update 06/16: Given the price action in the lumber futures described in today’s alert, consider an entry into ½ of a normal position size between $86.50 - $87.50. Should it pull back further, we can look to add another ½ position size. Update 06/17: WOOD provided the entry opportunity levels that we were looking for on Wednesday and even finished higher on the day. What a great sign. Look to be long on this underappreciated ETF. Update 06/21: WOOD traded through our first tranche level between $86.50 and $87.50. It closed Friday @ $84.15. I am looking at the above-mentioned price levels between $79.16 and $79.82 - $80.00 for the second tranche. See Above. Update 06/22: Wood tacked on 2.33% yesterday. Hold longs and look to add between $79.16 - $80.00. Update 06/25: Hold existing longs and look to add between $79.16 - $80.00. Always use a stop loss level that caters to your individual risk tolerance.
- Invesco Solar ETF (TAN) between the 50-day moving average ($80.32 as of June 14th) and $81.50. Look for an intraday pullback for entry. Update 06/16: We wanted a pullback, and we got a big one on Tuesday, with the range being $78.00 - $80.69. Ideally, this was taken advantage of on this pre-Fed meeting day. There could have been some “sell the news” price action with the SEIA report being released yesterday. Although we are below the 50-day MA, I like the previous consolidation and would look to be long at these levels. Update 06/17: TAN tacked on 1.51% in Wednesday’s overall down session. Great sign. I like this one and I think there is still time to get on board. Always use a stop loss level that caters to your individual risk tolerance. Update 06/21: We really nailed this entry and I am looking for continued upside. I think there is still time to get on board - look for pullbacks near the $81.00 level. I like this for a longer-term holding with price appreciation potential north of $100.00. Update 06/22: I think there is still time to get on board: look for pullbacks approaching the 50-day SMA of $79.75 - $81.00 for long entries. I like this one for a longer-term move above $100.00. Update 06/25: I continue to love TAN. This one has been up and up. If you are still not on board, look for pullbacks and do not chase. The current 50-day SMA is $79.72. $80 - $82 would be a nice level to initiate or add. Shorter-term traders note the 200-day moving average that acted as resistance on Friday near $86.19. Since I like this one for the longer-term, I would prefer to hold through any pullbacks. Always use a stop loss level that caters to your individual risk tolerance.
- First Trust NASDAQ Clean Edge Smart Grid Infrastructure Index Fund (GRID). GRID has traded through our idea range of between $86.91 and $88.17. Update 06/17: GRID closed at $91.50 yesterday, moving lower on the overall down day. I see no major technical damage and like this one over the longer run. Opinion: hold existing longs and/or look for entries on pullbacks. Update 06/22: Another one that briefly touched the 50-day SMA. Did you get it? If not I like it anywhere below $91 - look to enter on pullbacks. I am looking for $100 level or maybe higher in the longer term. Update 06/25: I still love GRID too. It has been a steady Eddie. Do not chase though, perhaps we get a pullback to the $90 level if you are not long yet. Always use a stop loss level that caters to your individual risk tolerance.
I have SELL opinions for:
- iShares Trust Russell 2000 ETF (IWM) today regardless of price. This was the plan and it worked well. The index is now reconstituted and is much higher than the price when we originally analyzed this in the May 27th publication near $223.36.
I have a HOLD opinion for:
NONE
Thanks for reading today’s Stock Trading Alert. Let’s press on with our theme of patience, discipline, and execution. Have a great week and enjoy!
Thank you,
Rafael Zorabedian
Stock Trading Strategist

