

Briefly:
Intraday trade: Our yesterday's short intraday trade has proved accurate. The S&P 500 index reached our profit target level of 2,450 and continued lower. Overall, one could gain at least 13 index points, opening short position at the opening of yesterday's trading session. The S&P 500 index may fluctuate or rebound today, following yesterday's sell-off. Therefore, we prefer to be out of the market today, avoiding low risk/reward ratio trades.
Medium-term trade: In our opinion, short position is favored (opened on June 5 at 2,437.83, with stop-loss at 2,510, and profit target at 2,300, S&P 500 index).
Our intraday outlook is bearish, and our short-term outlook is bearish, as we expect downward correction. Our medium-term outlook remains neutral:
Intraday outlook (next 24 hours): bearish
Short-term outlook (next 1-2 weeks): bearish
Medium-term outlook (next 1-3 months): neutral
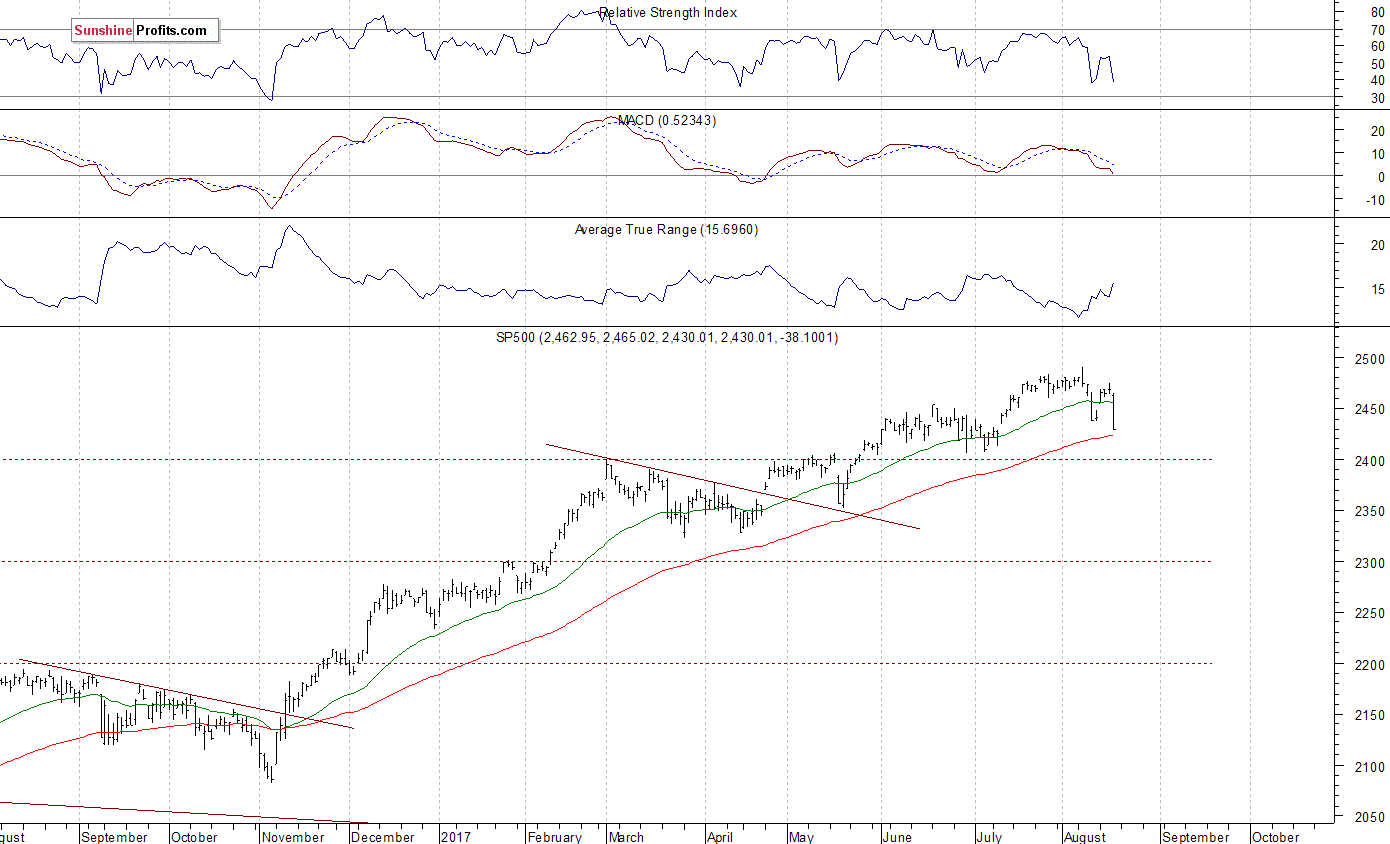
The U.S. stock market indexes lost between 1.2% and 1.9% on Thursday, retracing their Monday's advance, as investors reacted to economic data releases, among others. The S&P 500 index broke below its last week's local low of 2,437.75. It is now trading 2.5% below the August 8 all-time high at 2,490.87. Is this a new downtrend or just relatively shallow downward correction? The Dow Jones Industrial Average lost 1.2% yesterday, as it fell below 22,000 mark again. The technology Nasdaq Composite was relatively weaker than the broad stock market, as it lost 1.9%. The nearest important level of resistance of the S&P 500 index is now at around 2,450, marked by previous level of support. The next resistance level is at 2,465-2,475, marked by previous level of support and local highs. The resistance level is also at 2,490-2,500, marked by record high. On the other hand, support level is at around 2,430 (yesterday's closing price), marked by July 12 daily gap up of 2,429.30-2,435.75. The next level of support is at 2,400-2,410, marked by some previous local lows, among others. The market extended its downward correction following April - August uptrend. There have been no confirmed negative signals so far. Will this short-term downtrend continue? We still can see negative technical divergences:
Mixed Expectations
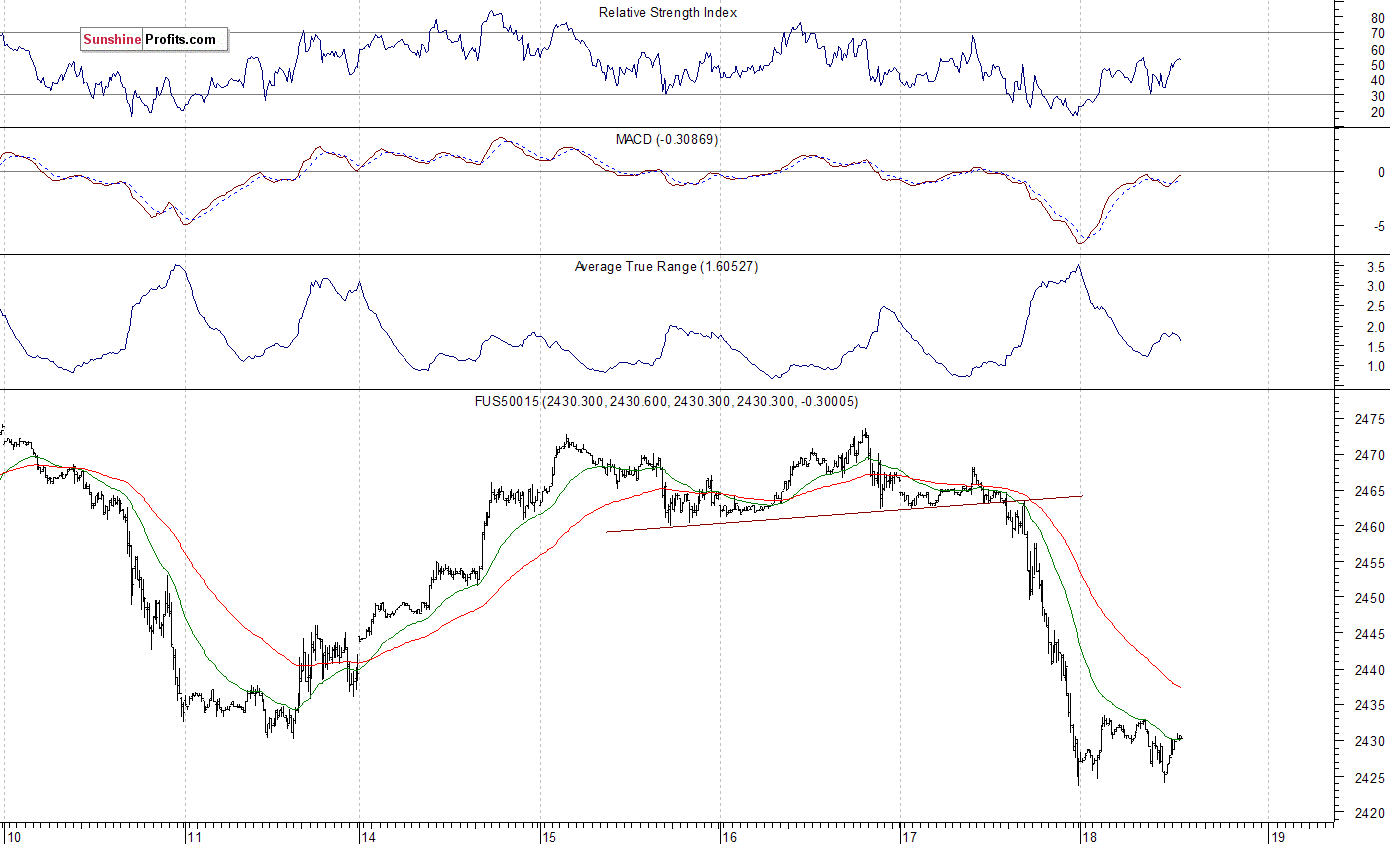
Expectations before the opening of today's trading session are mixed, with index futures currently between 0.0%% and +0.3% vs. their Thursday's closing prices. The European stock market indexes have lost 0.5-1.0% so far. Investors will now wait for the Michigan Sentiment preliminary number release at 10:00 a.m. The market expects that it was at 94.0 in August. The S&P 500 futures contract trades within an intraday consolidation, as it fluctuates following yesterday's sell-off. For now, it looks like a flat correction within a short-term downtrend. The nearest important level of support is at around 2,420-2,425, marked by local lows. On the other hand, resistance level is at 2,440-2,450, among others. Will the market extend its short-term move down? Or is this some bottoming pattern before a rebound? The futures contract trades along its last week's local low, as we can see on the 15-minute chart:
Tech Stocks Rebound
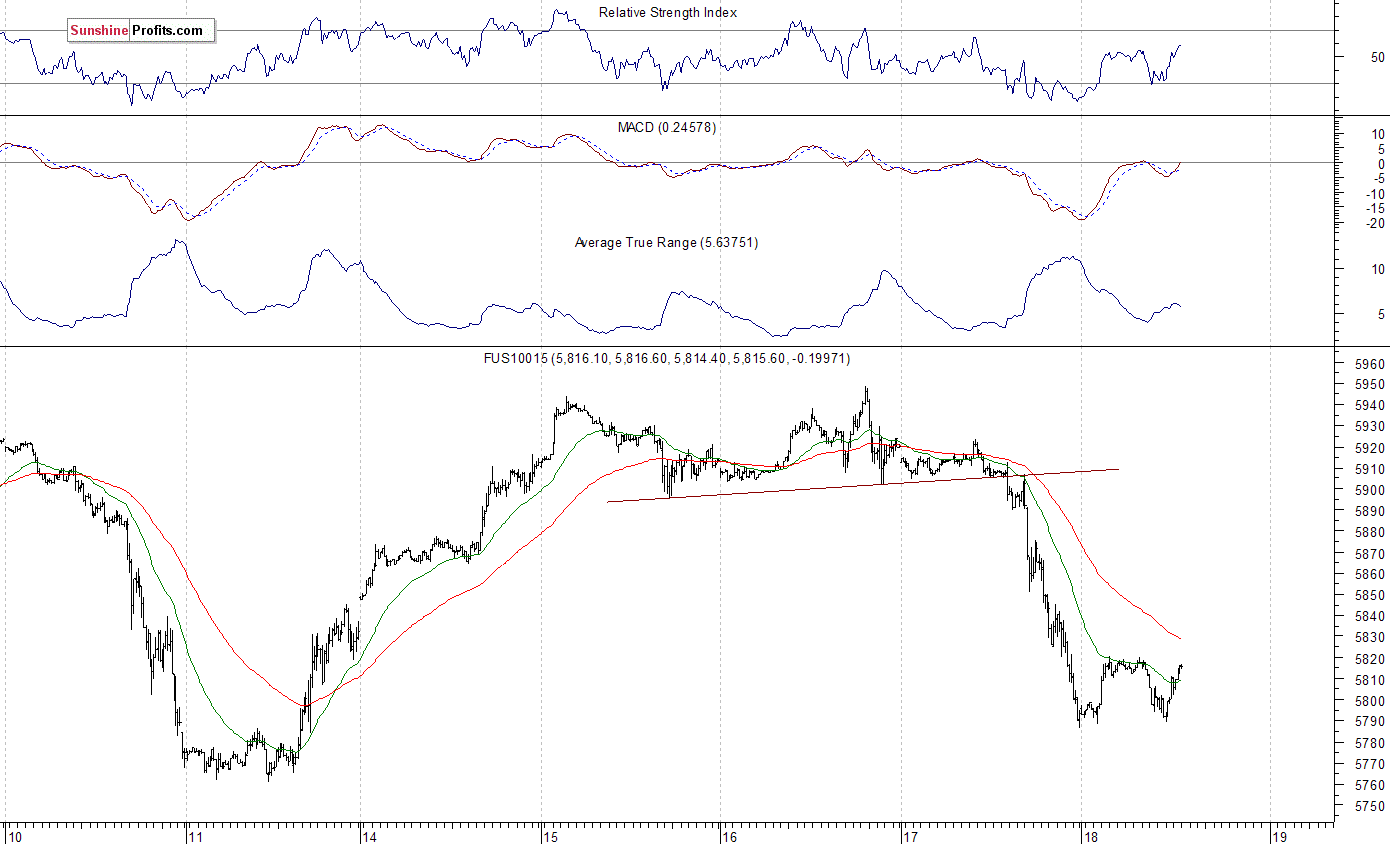
The technology Nasdaq 100 futures contract trades within a similar intraday consolidation, as it fluctuates after yesterday's move down. The nearest important level of support is at around 5,780-5,790, marked by local lows. On the other hand, resistance level is at 5,850-5,900. Will downtrend continue? The technology stocks futures contract manages to stay above its last week's lows, as the 15-minute chart shows:
Concluding, the S&P 500 index retraced its Monday's rally yesterday, as investors' sentiment worsened again. Will downtrend continue? Or is this just downward correction? There have been no confirmed positive signals so far. However, we can see some short-term oversold conditions that may lead to a rebound. However, we still can see medium-term overbought conditions along with negative technical divergences.
Therefore, we continue to maintain our medium-term short position (opened at 2,437.83 on June 5 - opening price of the S&P 500 index). Stop-loss level is at 2,510 and potential profit target is at 2,300 (S&P 500 index). One can trade S&P 500 index using futures contracts (S&P 500 futures contract - SP, E-mini S&P 500 futures contract - ES) or an ETF like the SPDR S&P 500 ETF - SPY. It is always important to set some exit price level in case some events cause the price to move in the unlikely direction. Having safety measures in place helps limit potential losses while letting the gains grow.
To summarize: short position in S&P 500 index is justified from the risk/reward perspective with the following entry prices, stop-loss orders and profit target price levels:
Intraday trade:
No intraday position is justified from the risk/reward perspective today.
Medium-term trade:
S&P 500 index - short position: profit target level: 2,300; stop-loss level: 2,510
S&P 500 futures contract (September) - short position: profit target level: 2,297; stop-loss level: 2,507
SPY ETF (SPDR S&P 500, not leveraged) - short position: profit target level: $230; stop-loss level: $251
SDS ETF (ProShares UltraShort S&P500, leveraged: -2x) - long position: opening price: $12.56; profit target level: $13.98; stop-loss level: $11.82
Thank you.
Paul Rejczak
Stock Trading Strategist
Stock Trading Alerts

