

Holiday-style trade, narrow ranges, and low volatility have been this week’s theme in the S&P 500 thus far. What is the slow chug leading up to, with Friday's BIG Jobs Number?
It seems like we just got the last jobs number yesterday, but here we are again awaiting the big data drop on Friday at 8:30 AM ET. The market consensus seems to be for 700K jobs added during the month of June, with some consensus indicators showing 690K. The expectations have seemed to increase over the last week, as expectations have risen from ~ 660K.
Last month, the Non-Farm Payroll number missed expectations; printing at 559K versus 645K expected, and the US Equity and bond markets did not care, as both marched higher.
But that was so last month. How could the markets behave on Friday’s data release?
I tend to avoid having leveraged open positions heading into big data releases like NFP and CPI. Longer-term swing trades and position trades are just fine to hold onto, however.
There is some seasonality for the S&P 500 to move higher heading into the 4th of July. Some analysis shows getting long 2 days prior to the release yields certain results over X amount over a number of years, and other analysis seems to show getting long the day before is good too. You can read about what veteran Trader Larry Williams had to say about this last year.
Analyzing the SPY today for the ETF Traders out there:
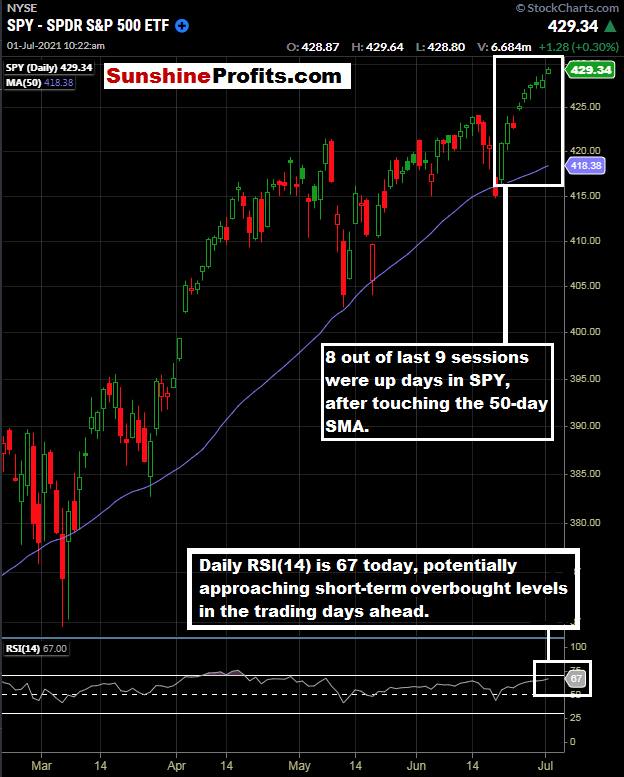
Figure 1 - SPDR S&P 500 ETF February 18, 2021 - July 1, 2021, 10:20 AM, Daily Candles Source stockcharts.com
Looking at the SPY, we have been higher eight out of the last nine trading sessions! That is a rare feat in the index. Given the recent selloff to the 50-day moving average that we were waiting for, it does make sense that we have continued higher, but eight out of the last nine sessions is rare. This is just some food for thought. In addition, we are seeing Daily RSI(14) at 67, which could indicate the SPY approaching short-term technically overbought levels in the trading days ahead. It is not all that often where the SPY will hold an RSI(14) Daily level above 70 for a lengthy period.
Drilling down further to the hourly candles, I notice some indications of short-term overbought levels (well, we have been higher in eight of the last nine trading sessions, after all!).
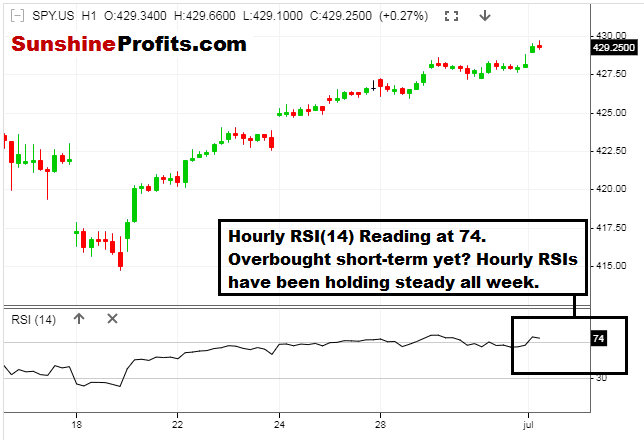
Figure 2 - SPDR S&P 500 ETF June 15, 2021 - July 1, 2021, 10:45 AM, Hourly Candles Source stooq.com
There aren’t too many surprises here when looking at the hourly chart. The S&P 500 has been moving higher steadily, and it feels like we are headed for a short-term volatility spat (either higher or lower) with the NFP data release on Friday.
Let’s keep in mind that this is a Holiday week in the US. Trading volumes tend to dry up, and slow moves higher can be a prevailing theme during holiday-style trading. US equity markets are closed on Monday, July 5th in observance of Independence Day in the US. Some futures products will trade on July 5th with abbreviated trading sessions. You can see the Holiday trading hours for the CME here. Be sure to know the holiday trading hours for your product!
Heading into Friday, I am not expecting much in the way of market fireworks before the NFP data release. The slow grind higher has been the theme as market participants await the big NFP jobs data.
To sum up the current viewpoint and opinion:
I have BUY opinions for:
- Defiance Quantum ETF (QTUM) between $44.00 - $49.50. Update 07/01: This one wants to break $50.00 - it is close. This is a play in automation, robotics, and AI. Always use a stop loss level that caters to your individual risk tolerance.
- Amplify Transformational Data Sharing ETF (BLOK) between the 200-day moving average and $40.00 200-Day Moving Average is currently $40.43 Update 07/01:Waiting for pullbacks, still. Always use a stop loss level that caters to your individual risk tolerance.
- Invesco MSCI Sustainable Future ETF (ERTH) between $65 and $66. Update 07/01: If not on board yet, wait for pullbacks. Always use a stop loss level that caters to your individual risk tolerance.
- Invesco Exchange-Traded Fund Trust - S&P SmallCap 600 Pure Value ETF (RZV) on pullbacks. Update 07/01: See Yesterday’s Publication. I hope you got it near the 50-day MA of $93.88 or in the low to mid $94’s. Always use a stop loss level that caters to your individual risk tolerance.
- iShares Global Timber & Forestry ETF (WOOD) Initial buy idea zone between $79.07 and the 200-day moving average ($80.94 as of 07/01). Update 7/01: No change in outlook here and this one has held up very nicely. Look to add the 2nd tranche between $80.894 (200-day SMA) and $80.00.
- Invesco Solar ETF (TAN) Update 07/01: If not long already, or looking to add to a position, consider the 200-day moving average (currently $86.91) as a spot to consider getting long or adding. Always use a stop loss level that caters to your individual risk tolerance.
- First Trust NASDAQ Clean Edge Smart Grid Infrastructure Index Fund (GRID). Update 07/01: No change and look to $90 level for potential entries if not already long. Always use a stop loss level that caters to your individual risk tolerance.
I have SELL opinions for:
NONE
I have a HOLD opinion for:
NONE
Thanks for reading today’s Stock Trading Alert. Your readership is valued and appreciated. Enjoy the Independence Day Holiday!
Thank you,
Rafael Zorabedian
Stock Trading Strategist

