

The market has continued to mainly trade sideways this week. However, the correction I’ve been calling for weeks has potentially started.
While I don’t foresee a crash like we saw last March and feel that the wheels are in motion for a healthy 2021, I still maintain that some correction before the end of Q1 could happen.
Bank of America also echoed this statement and said last week that “We expect a buyable 5-10% Q1 correction as the big ‘unknowns’ coincide with exuberant positioning, record equity supply, and as good as it gets’ earnings revisions.”
Yes, the sentiment is still positive. That won’t change overnight. Vaccines seem more effective than we thought, especially against other variants of the virus. All that extra stimulus money and record low-interest rates could keep pushing stocks to more records and stimulate pent-up consumer spending. It’s not like the Fed is going to switch this policy up anytime soon, either.
They don’t call it a stimulus for nothing.
For weeks we’ve likely been in a rational bubble. Dhaval Joshi, the chief European investment strategist for BCA Research, has said that low bond yields meant the rally we’ve seen with stocks made sense.
“Rational, because the nosebleed valuations are justified by a fundamental driver. And not just any fundamental driver, but the most fundamental driver of all – the bond yield.”
Take a look at this chart comparing a “rational bubble” to an “irrational bubble.”
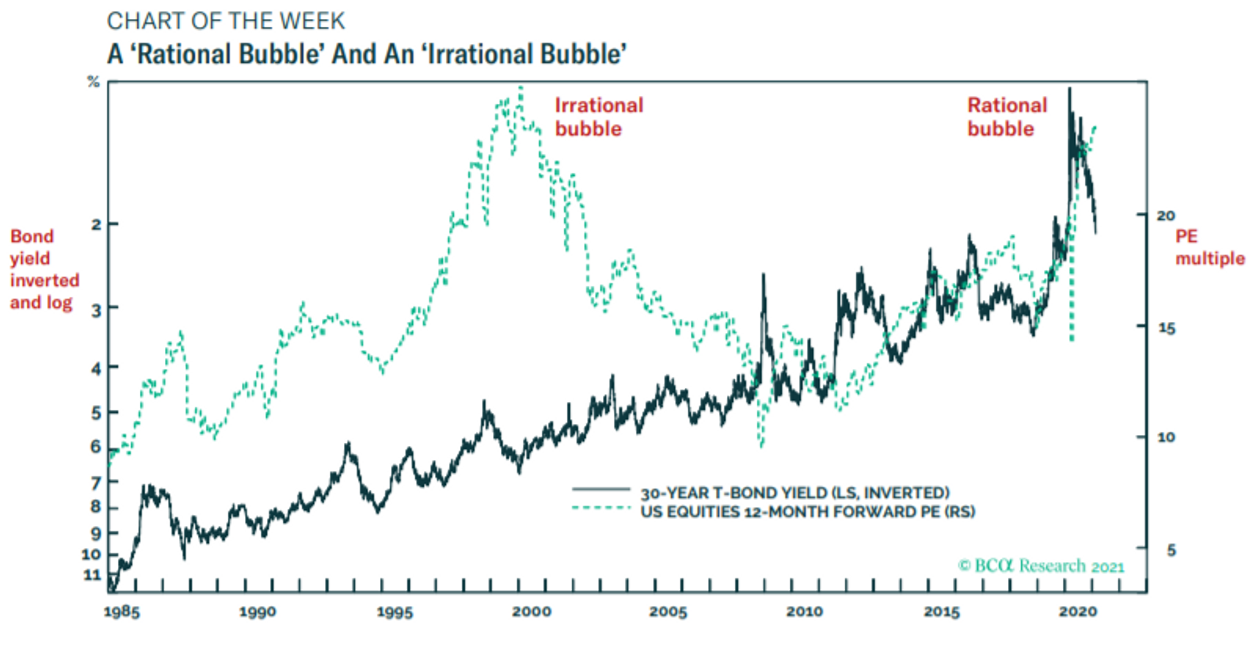
Figure 1
But now? Things have possibly changed. Complacency, valuations, surging bond yields, and inflation concern me.
They’re all connected. But look especially into the 10-year yield. It’s hovering around 1.30% for the first time in over a year.
Why is this concerning?
Rising interest rates=less attractive stocks.
Look at this other chart. Forward P/E ratios are continuing to rise along with bond yields. In high-growth sectors, such as tech, this is especially concerning. The chart shows, in fact, that tech earnings yields have now been surpassed by the bond yield plus a fixed amount.
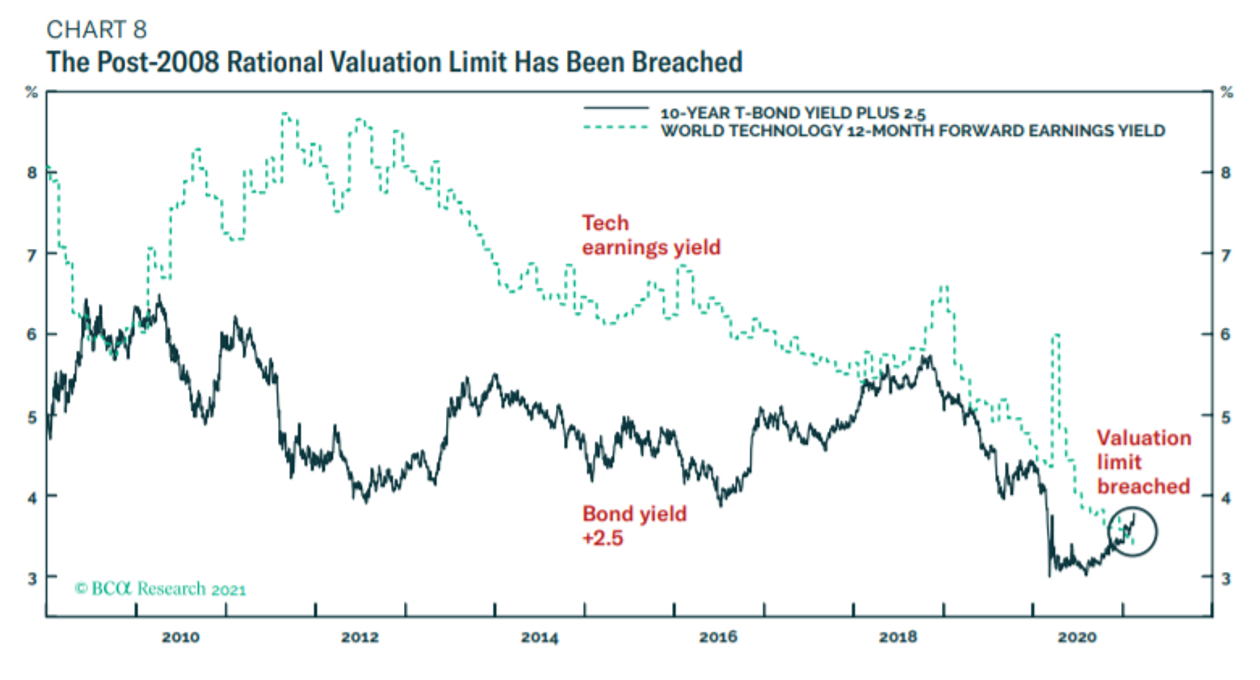
Figure 2
The only three ways this can be resolved are for stock prices to decline, bond yields to fall, or earnings to rise and improve stock valuations. Considering earnings season is over, only options 1 or 2 seem feasible in the near-term.
You combine this info with the Buffet Indicator (Total US stock market valuation/GDP), and you have a market that could be 228% overvalued.
I’ve already correctly called the Russell 2000’s pullback after how much it’s overheated. Since February 9th, when I switched the call to a sell, it’s declined roughly 3.40%.
More could follow.
Look. Corrections are healthy and normal market behavior, and we are long overdue for one. Only twice in the last 38 years have we had years WITHOUT a correction (1995 and 2017), and we haven’t seen one in a year.
A correction could also be an excellent buying opportunity for what could be a great second half of the year.
My goal for these updates is to educate you, give you ideas, and help you manage money like I did when I was pressing the buy and sell buttons for $600+ million in assets. I left that career to pursue one to help people who needed help instead of the ultra-high net worth.
With that said, to sum it up:
While there is long-term optimism, there are short-term concerns. A short-term correction between now and the end of Q1 2021 is possible. I don’t think that a decline above ~20%, leading to a bear market, will happen.
Hopefully, you find my insights enlightening. I welcome your thoughts and questions and wish you the best of luck.
The S&P Remains Streaky While Trading Flat 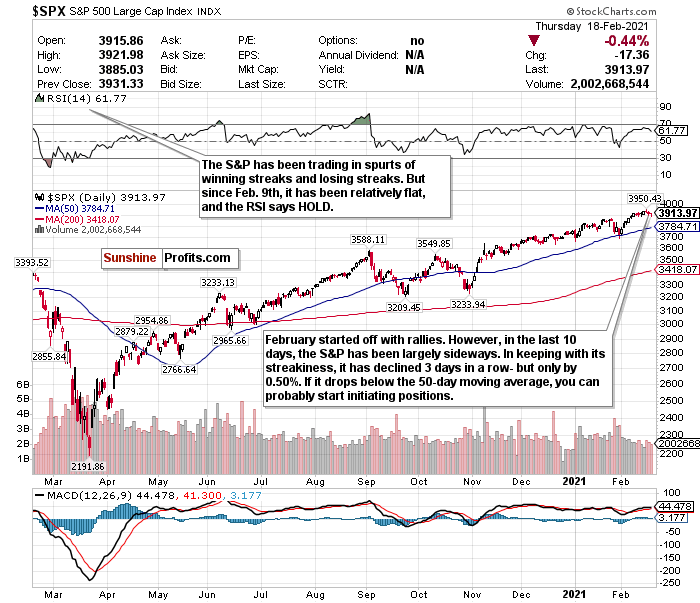

Figure 3 - S&P 500 Large Cap Index $SPX
The S&P continues to trade as a streaky index. It seemingly rips off multiple-day winning streaks or losing streaks weekly.
Before this week, here’s how the S&P has traded in February. It kicked off the month by ripping off a streak of gains in 6 of 7 days. It then promptly went on a 3-day losing streak, followed by a two-day winning streak and more record closes.
Now? We’re on a 3-day losing streak.
But it’s hard to consider this much of a pullback. It’s down 0.50% in the last 3-days.
The tailwinds seem to be healthy. More than 80% of S&P stocks have beaten earnings estimates, which is quite impressive. Yes, the forward P/E ratio is historically high. However, this P/E ratio has coincided with growing earnings.
The index started February off hot but has cooled off somewhat in the last week and a half. But there’s a healthy outlook for the second half of the year.
The S&P’s RSI is also still hovering at a HOLD level, mainly reflecting its recent muted moves.
A short-term correction could inevitably occur by the end of Q1 2021, but for now, I am sticking with the S&P as a HOLD.
For an ETF that attempts to directly correlate with the performance of the S&P, the SPDR S&P ETF (SPY) is a good option.
Tech’s Decline-Desperately Needed
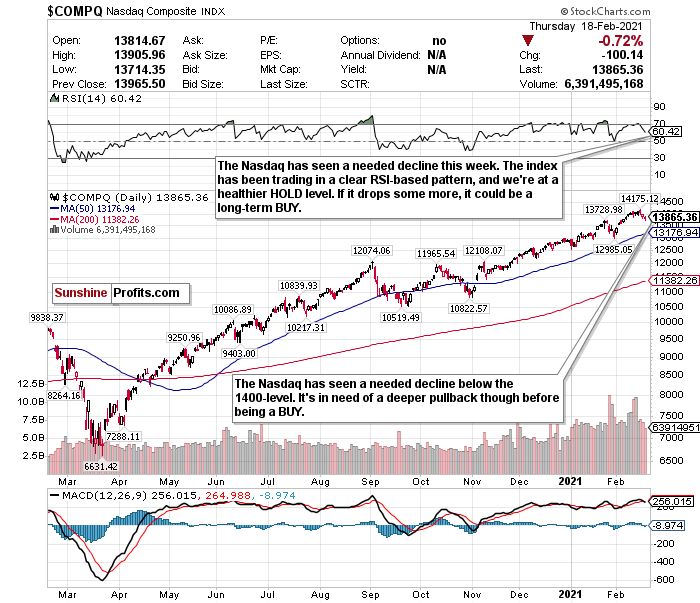
Figure 4 - Nasdaq Composite Index $COMP
Outside of the Russell 2000, the Nasdaq’s been the most overheated index. Tech remains frothy, and valuations are absurd. Rising bond yields coupled with this could be very worrisome in the short-term.
The Nasdaq is off its record highs now and has declined about 1.10% since February 12. We’re thankfully below the 14000-level now, and the RSI is at a much more manageable 60.42.
But it hasn’t been enough.
We’re still frothy, and yes, this recent pullback is nothing.
But the RSI says HOLD, and with the Nasdaq, the RSI is my bible.
Why?
Because the Nasdaq is trading in a precise pattern.
I remain bullish on tech, especially for sub-sectors such as cloud computing, e-commerce, and fintech.
But please monitor the RSI.
Since December, let's break down the Nasdaq and how it has reacted whenever the RSI has exceeded 70.
December 9- exceeded an RSI of 70 and briefly pulled back.
January 4- exceeded a 70 RSI just before the new year and declined 1.47%.
January 11- declined by 1.45% after exceeding a 70 RSI.
Week of January 25- exceeded an RSI of over 73 before the week and declined 4.13% for the week.
It also declined about 0.25% after exceeding a 70 RSI earlier last week.
Every single time the RSI exceeded 70, I switched my Nasdaq call to a SELL.
The RSI is right at about 60 now. I’d like to see this fall a bit more before buying back in. I'm bullish but concerned.
In case you forgot, consider this too. Goldman’s non-profitable tech index is at about an absurd 250% year-over-year performance.
Because of the Nasdaq’s precise trading pattern, I will follow the RSI literally and keep this a HOLD. If you took profits earlier last week when the RSI was above 70, good on you.
For an ETF that attempts to directly correlate with the performance of the NASDAQ, the Invesco QQQ ETF (QQQ) is a good option.
Dow’s Time to Shine?
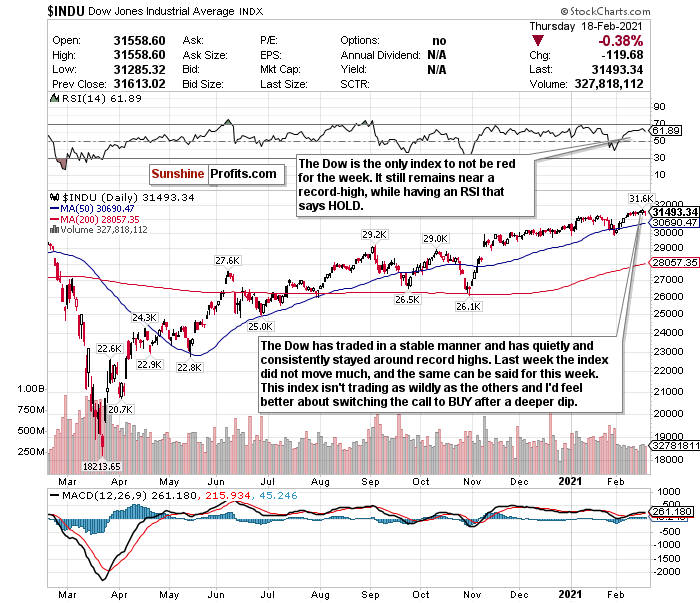
Figure 5 - Dow Jones Industrial Average $INDU
This could finally be the Dow Jones’s time to shine. After underperforming the S&P 500, Nasdaq, and Russell 2000 both year-to-date and month-to-date, the Dow seems to have some momentum on its side.
Week-to-date, it’s the only index that isn’t in the red.
After closing at a record-high Tuesday (Feb. 16), it’s seen a mild decline. However, it’s also the only index that hasn’t traded as if it’s on MDMA and may have the most room to run.
There are still underlying concerns, and the market is more of a house of cards than anyone realizes. However, the Dow is comparatively stable and undervalued and possibly more attractive as a potential BUY opportunity.
If you want to start initiating positions, go ahead. It’s at a decent entry point, especially considering that many analysts call for it to end the year at 35,000.
From my end, though, the RSI is quietly ticking up, and I still have some short-term worries.
The Dow could see another pullback.
My call on the Dow stays a HOLD, but this could change soon.
For an ETF that aims to correlate with the Dow’s performance, the SPDR Dow Jones ETF (DIA) is a reliable option.
Beware of Inflation
“The rich world has come to take low inflation for granted. Perhaps it shouldn’t.” -The Economist.
Complacency, an overvalued market, and rising bond yields are my biggest short-term concerns.
But my biggest mid to long-term concern has to be inflation. Pay very close attention to the possible return of inflation by mid-Q2 or Q3.
The President of the Federal Reserve Bank of Kansas City, Esther George, kicked off February by telling Bloomberg News that the Fed was still “far away” from achieving its goals and that it was too soon to discuss scaling back its unprecedented massive bond-buying program.
Fed Chair Jay Powell echoed this in his statement last week. The Fed will clearly allow the GDP to heat up and possibly overshoot in the medium-term.
We will see what happens to GDP growth by the end of Q1 2021, but I no longer think it will sputter as much as I previously thought.
If at all.
Rising bond yields also show that investors expect inflation to eventually return and are bracing for the GDP to heat up. Richmond Federal President Thomas Barkin described this as a “reflation trade,” or a sign that investors are preparing for future hikes in prices and demanding higher interest rates.
If you are looking to the future to hedge against inflation, look into TIPS, commodities, gold, and potentially some REITs.
In the mid-term, I have BUY calls on the SPDR TIPS ETF (SPIP), the Invesco Optimum Yield Diversified Commodity Strategy No K-1 ETF (PDBC), and the iShares Cohen & Steers REIT ETF (ICF).
Mid-Term/Long-Term
Surging Commodities= Add Emerging Market Exposure
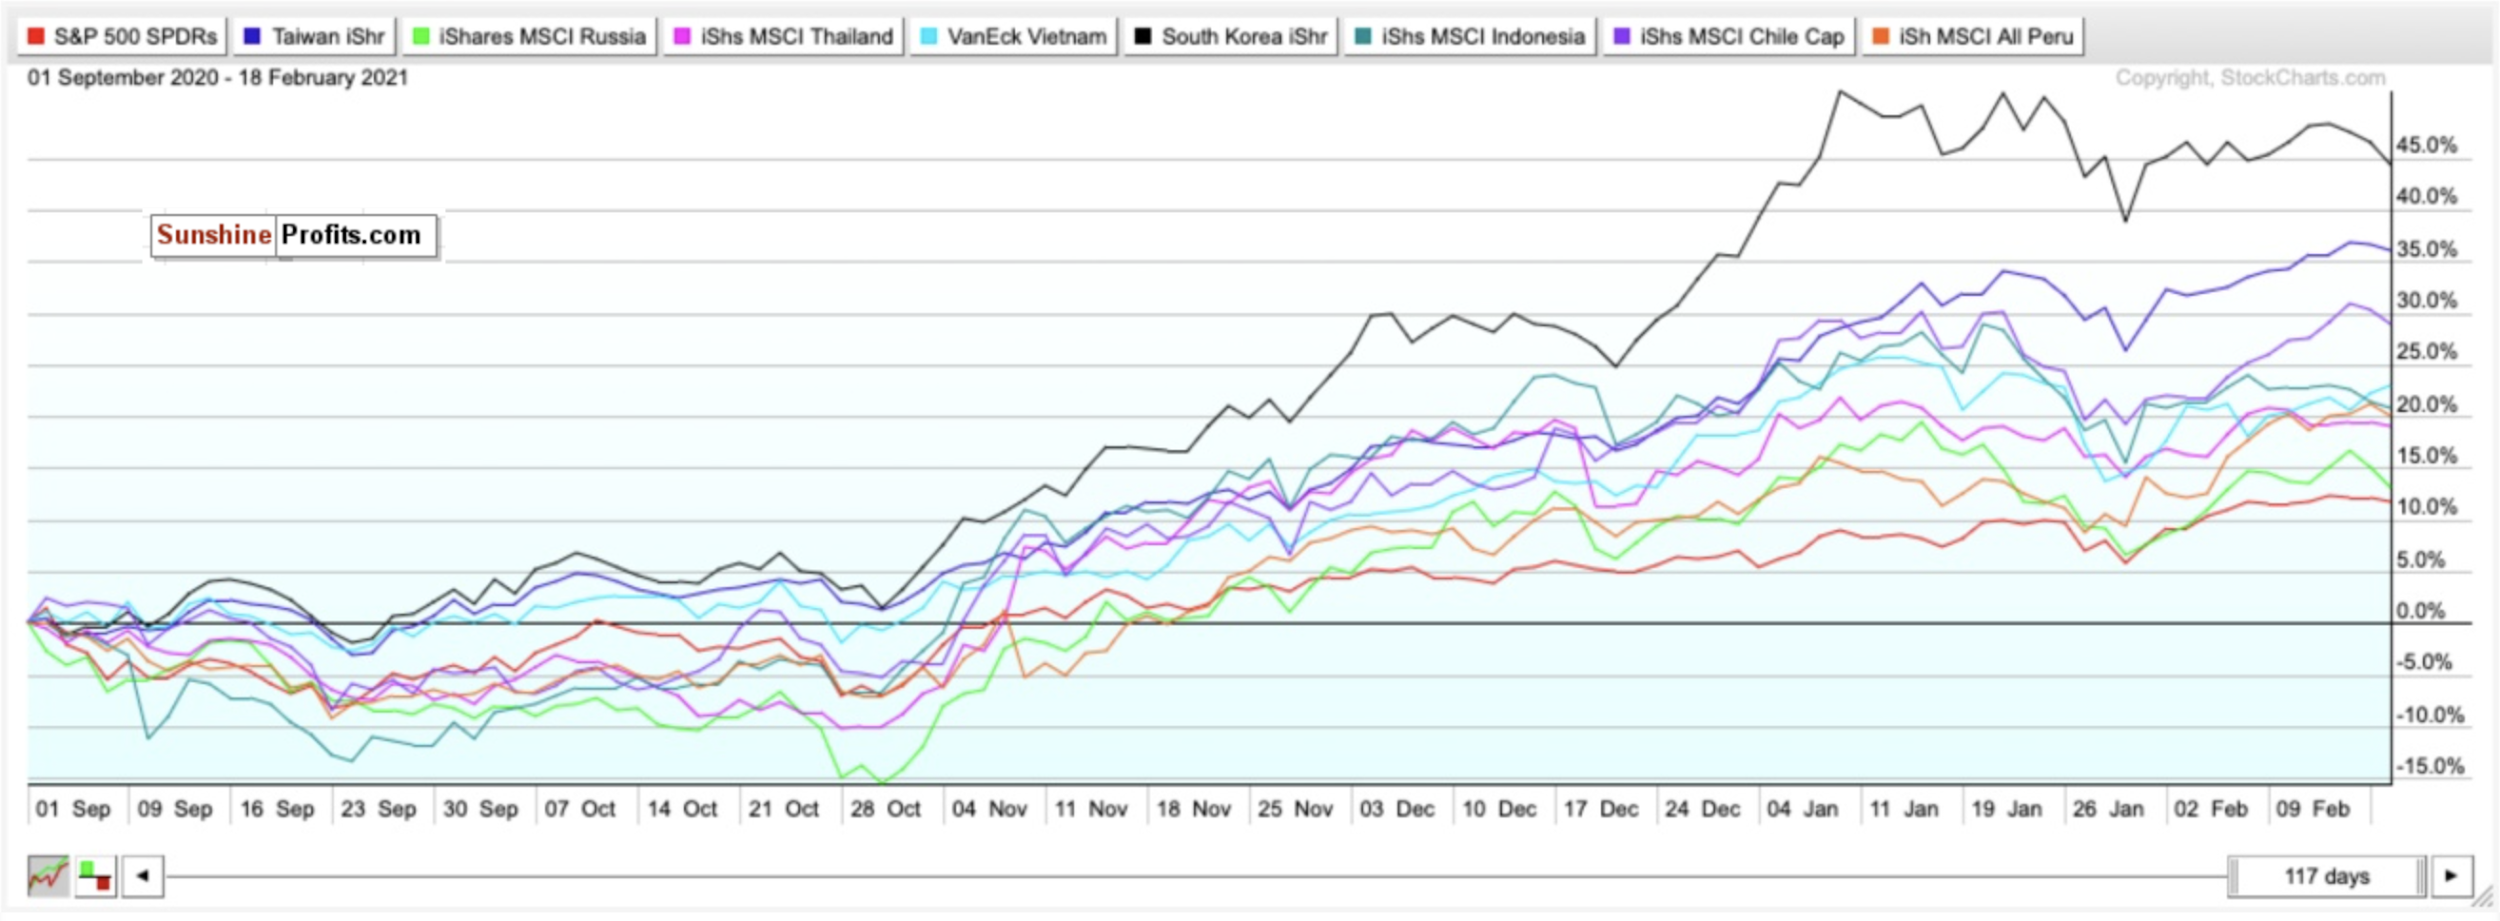
Figure 6 - SPY, EWT, ERUS, THD, VNM, EWY, EIDO, ECH, EPU comparison chart- Sep. 1, 2020-Present
Since September, the SPDR S&P 500 ETF (SPY) has gained around 11.73%. When you compare that yield to that of my top emerging market picks for 2021, it has underperformed.
Consider this too.
A surge in commodity prices due to a weakening dollar combined with shifting demographics could send emerging markets upwards in the long-term too.
PWC also believes that emerging markets (E7) could grow around twice as fast as advanced economies (G7) on average in the coming decades.
For 2021, the following are my BUYs for emerging markets and why:
iShares MSCI Taiwan ETF (EWT)- Developing country, with stable fundamentals, diverse and modern hi-tech economy, regional upside without China’s same geopolitical risks.
iShares MSCI Thailand ETF (THD)- Bloomberg’s top emerging market pick for 2021 thanks to abundant reserves and a high potential for portfolio inflows. Undervalued compared to other ETFs.
iShares MSCI Russia Capped ETF (ERUS)- Bloomberg’s second choice for the top emerging market in 2021 thanks to robust external accounts, a robust fiscal profile, and an undervalued currency. Red-hot commodity market, growing hi-tech and software market, increasing personal incomes. Compared to many other developed and emerging markets, Russia could have more than a 35% upside for its equities in the long-term as well.
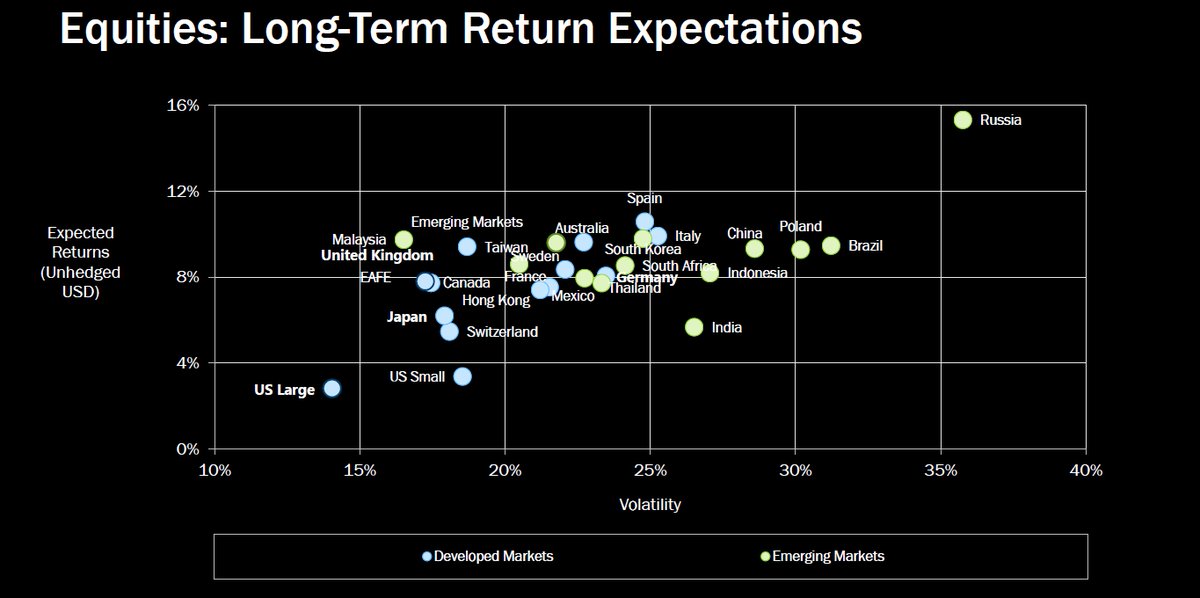
Figure 7
VanEck Vectors Vietnam ETF Vietnam (VNM)-Turned itself into an economy with a stable credit rating, strong exports, and modest public debt relative to growth rates. PWC believes Vietnam could also be the fastest-growing economy globally. It could be a Top 20 economy by 2050.
iShares MSCI South Korea ETF (EWY)- South Korea has a booming economy, robust exports, and stable yet high growth potential. The ETF has been the top-performing emerging market ETF since March 23.
iShares MSCI Indonesia ETF (EIDO)- Largest economy in Southeast Asia with young demographics. The fourth most populous country in the world. It could be less risky than other emerging markets while simultaneously growing fast. It could also be a Top 5 economy by 2050.
iShares MSCI Chile ETF (ECH)- One of South America’s largest and most prosperous economies. An abundance of natural resources and minerals. World’s largest exporter of copper. Could boom thanks to electric vehicles and batteries because of lithium demand. It is the world’s largest lithium exporter and could have 25% of the world’s reserves.
iShares MSCI Peru ETF (EPU)- A smaller developing economy but has robust gold and copper reserves and rich mineral resources.
Month-to-date, while Indonesia and South Korea have lagged, Russia and Chile have flourished.
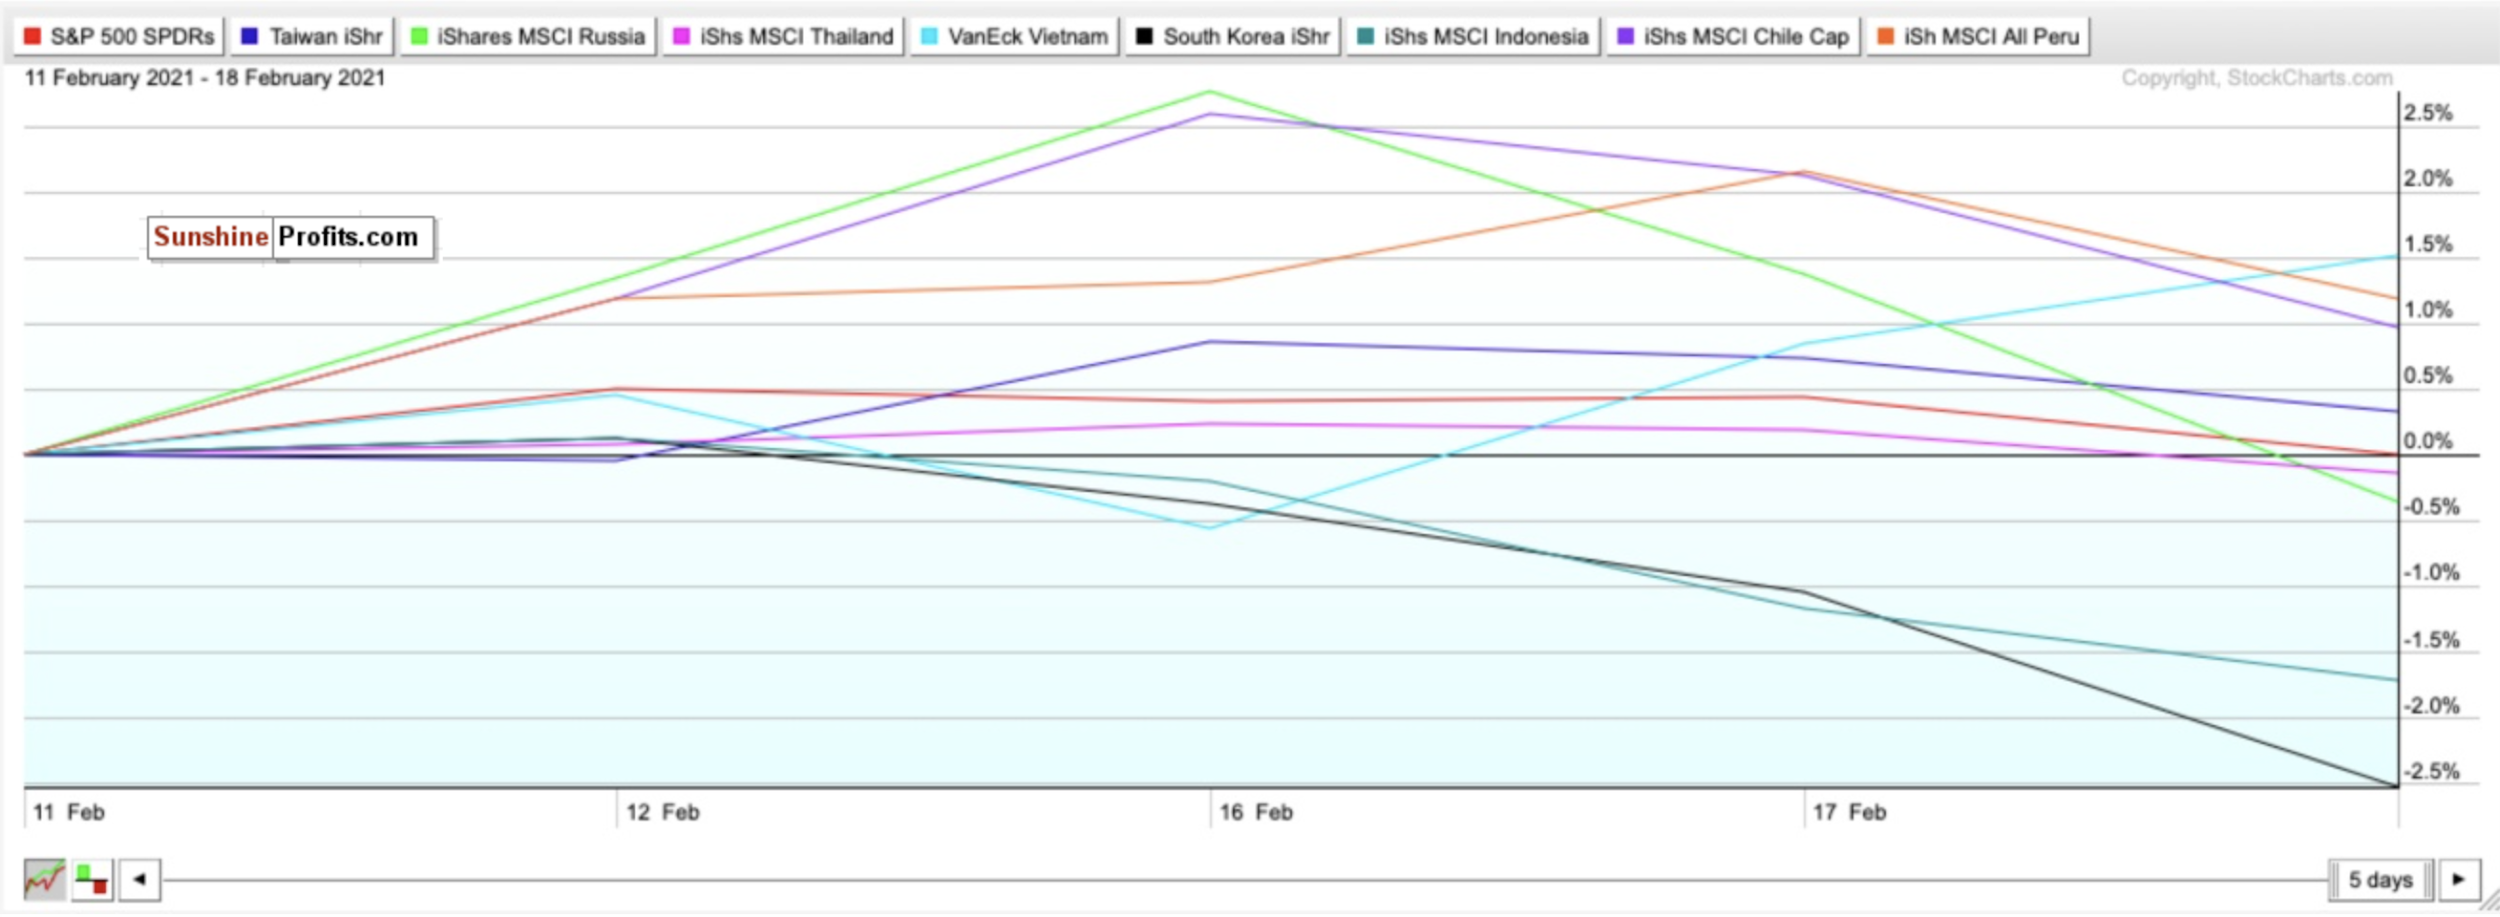
Figure 8
After leading for much of the month, Russia is no longer on top and has been mostly flat this week.
Week-to-date, the leaders have been Vietnam, Peru, and Chile.
Peru and Chile’s outperformance this week aren’t entirely shocking. Both have significant gold and copper reserves, and Chile, especially is the world’s largest copper and lithium exporter. Month-to-date, copper is up about 10%, and the Global X Lithium ETF (LIT) is up about 3%. But before Wednesday (Feb. 17) and Thursday’s (Feb. 18) decline, LIT was up 11.5% for the month.
Vietnam’s rise this week isn’t entirely surprising either. This is a growing economy that has handled the pandemic as well as anyone. UBS Global Wealth Management’s Kelvin Tay said that Vietnam’s economic outlook is positive, and the economy has “huge potential.” Tay also said that the Vietnamese stock market is seeing strong growth and could become more prominent than the Philippines in terms of the market cap “sometime in the middle of this year.” Vietnam was also one of Asia’s top-performing economies in 2020, and outside of China, it was one of the very few countries that managed to record GDP growth despite the pandemic.
Outside of the aforementioned country-specific ETFs, you can also BUY the iShares MSCI Emerging Index Fund (EEM) for broad exposure to Emerging Markets.
Long-Term
I remain convinced that the economic recovery is going better than expected as the progress in administering the vaccines improves. Winter weather could be a potential short-term hiccup in this though.
We may be at the beginning of the end of the pandemic, and despite what could be a bumpy ride, 2021 should be a big year for stocks.
But as I keep saying, pay attention to complacency, overvaluation, and bond yields.
For the long-term, be very wary of inflation.
Small-caps, value stocks and cyclical stocks could significantly surge. I just will have a much better feeling for them in the second half of the year- especially if they pullback more.
I think we are overdue for another down week or two before entering a powerful buying opportunity for the second half of the year.
Summary
I am becoming increasingly optimistic for the second half of 2021.
However, until COVID-19 is brought under control, a battle between optimism and pessimism is inevitable.
But it’s getting better.
The crash and subsequent record-setting recovery we saw in 2020 is a generational occurrence. I can’t see it happening again in 2021. But as I said in the intro, I think a correction is inevitable.
We’re too complacent right now, and there are signs that the “rational bubble” could pop.
If there is a short-term downturn, though, take a breath, stay cool, and use it as a time to find buying opportunities. Do not get caught up in fear and most of all:
NEVER TRADE WITH EMOTIONS.
If you cautiously bought a little bit two weeks ago, you’re probably very happy right now. Even though the downturn to close out January wasn’t a full-blown correction, it was indeed an excellent opportunity to rebalance and add exposure.
That’s why I love down weeks—especially overdue ones.
Consider this too. Since markets bottomed on March 23rd, ETFs tracking the indices have seen returns like this: Russell 2000 (IWM) up 123.96%. Nasdaq (QQQ) up 96.02%. S&P 500 (SPY) up 77.48%. Dow Jones (DIA) up 71.84%.
In the long-term, markets always move higher and focus on the future rather than the present.
To sum up all our calls, I have HOLD calls for:
- The iShares Russell 2000 ETF (IWM)
- the SPDR S&P ETF (SPY),
- the Invesco QQQ ETF (QQQ), and
- the SPDR Dow Jones ETF (DIA)
I am more bullish for all of these ETFs for the second half of 2021 and the long-term.
I also recommend selling or hedging the US Dollar and gaining exposure into emerging markets for the mid-term and long-term.
I have BUY calls on:
- The iShares MSCI Emerging Index Fund (EEM),
- the iShares MSCI Taiwan ETF (EWT),
- the iShares MSCI Thailand ETF (THD),
- the iShares MSCI Russia ETF (ERUS),
- the VanEck Vectors Vietnam ETF Vietnam (VNM),
- the iShares MSCI South Korea ETF (EWY),
- the iShares MSCI Indonesia ETF (EIDO),
- the iShares MSCI Chile ETF (ECH),
- and the iShares MSCI Peru ETF (EPU)
Additionally, because I foresee inflation returning as early as mid to late 2021…
I also have BUY calls on:
- The SPDR TIPS ETF (SPIP),
- the Invesco Optimum Yield Diversified Commodity Strategy No K-1 ETF (PDBC), and
- the iShares Cohen & Steers REIT ETF (ICF)
Thank you.
Matthew Levy, CFA
Stock Trading Strategist

