

Thinking back to 2007 - 2008, I remember a time where the economic data just kept coming out rosy, even though I deeply suspected there was an underlying shoe to drop due to real estate and lending. At the time, it seemed like every economic print was bullish, and the $SPX just kept climbing and climbing. It can be frustrating; when you may have the correct outlook, but just early.
This concept is one of the most important things a trader can recognize; his or her timing. The market will dictate when you are right, and your wallet will reflect the harsh reality of when you are wrong.
With that being said, we turn our attention to the big data releases scheduled for June.
The Big One: Traders are looking to the Non-Farm Payrolls report on Friday, June 4th, at 8:30 AM ET. The market is expecting a gain of 645K - 670K here after last month's huge miss of 266K actual vs. 990K expected. Friday ought to be a doozy, with Fed Chair Powell speaking beginning at 7:00 AM ET and then the big jobs number.
But before we get to Friday, the ISM Manufacturing PMI is slated for release on Tuesday, June 1st, at 10:00 AM ET. This data will give market participants a view into business conditions, including employment, supplier deliveries, production, and more. This data release can be viewed as a precursor or clue to Friday’s Non-Farm Payroll Data. Then there is ISM Services PMI on Thursday. It is a big week for economic data releases in the US, with the granddaddy of all of them on Friday.
So heading into the week, what is the S&P 500 telling us?
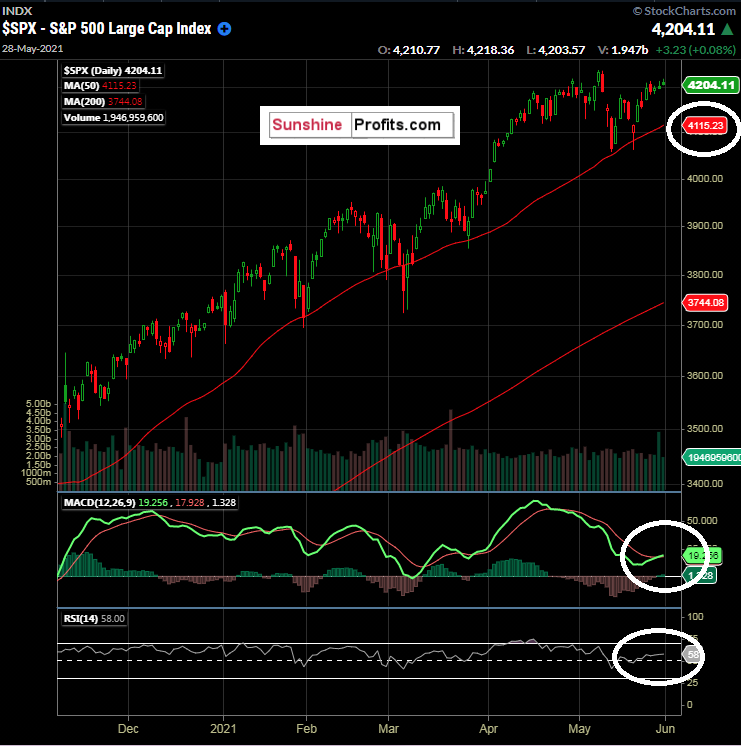
Figure 1 - $SPX S&P 500 SPX November 6, 2020 - May 28, 2021 Daily Candles Source stockcharts.com
There are several interesting things happening with the S&P 500. Coming out after a practically flat month of May (thanks to jobs data and inflation data), we see the MACD(12,26,9) throwing a bullish signal here, with the fast line crossing the slow line. RSI(14) is above 50, and we are currently trading well above the 50-day SMA of 4115.23.
While it may not seem logical, most signs seem bullish at this time, after a month of sideways trading and consolidation. One could reason that the jobs data and inflation that has been gaining steam should hurt the index. However, wouldn’t inflation make stocks more expensive too? It is something to think about. We have to keep a pulse on the US Dollar Index for clues.
What is happening in the $VIX?
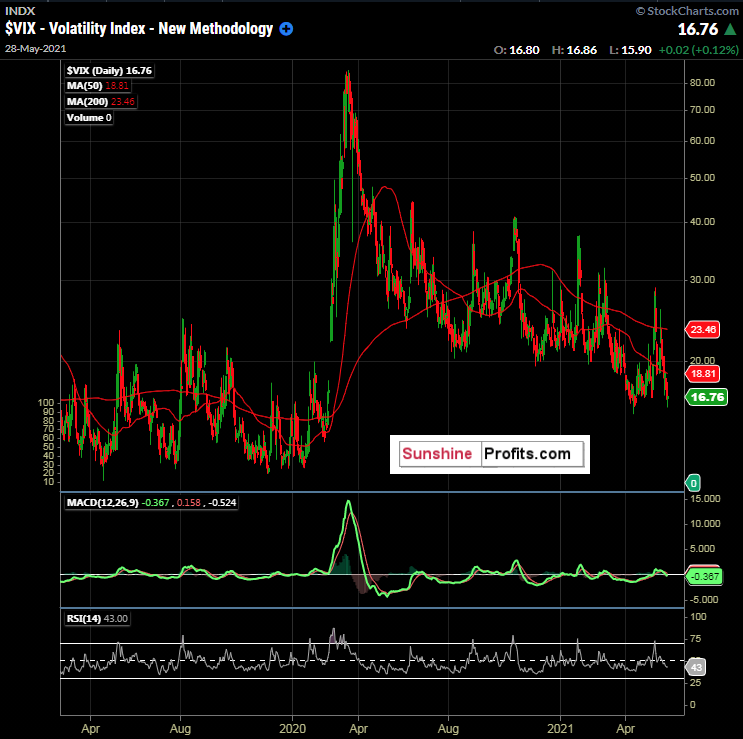
Figure 2 - $VIX Volatility Index 2000 ETF February 21, 2019 - May 28, 2021 Daily Candles Source stockcharts.com
There are no surprises here in the $VIX over the longer term. The massive spike caused by the pandemic has been steadily sold, with options sellers sucking up premiums akin to a vacuum cleaner. Although, there have been spikes along the way. Around the close on Friday, the $VIX caught my eye due to its close as the $SPX gave up around 10 handles between 3:00 PM and 4:00 PM ET.
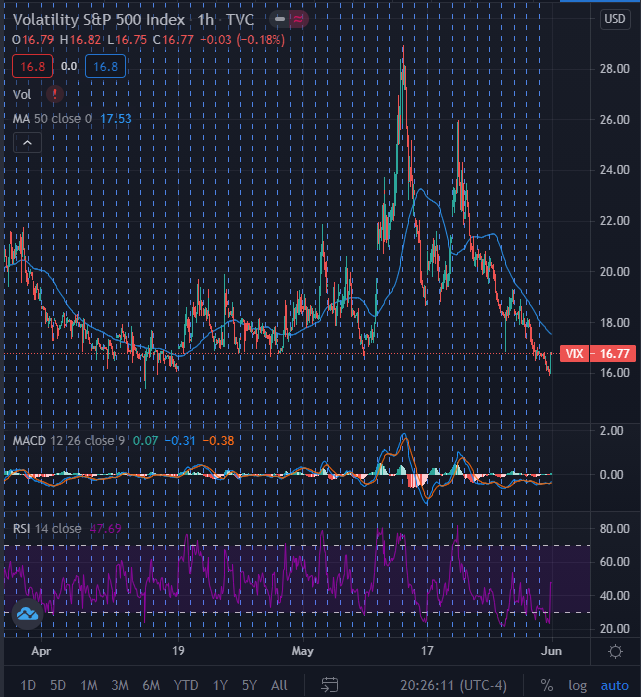
Figure 2 - $VIX Volatility Index 2000 ETF March 29, 2021 - May 28, 2021 Hourly Candles Source tradingview.com
The hourly candles show $VIX down near its April lows and catching a nice hourly pop on Friday near the close. Friday was the last day of the month, so there could have been some book squaring and month-end activity that contributed to the pop. It was nothing outrageous, but this action coupled with being near the bottom end of the recent range caught my attention.
There are some mixed signals for the S&P 500 at the moment.
Since this week has so much data coming in, I would expect volatility to get bid up and options to become more expensive due to higher implied volatility. Given the flat month of May in the $SPX, I would view it as an overall bullish continuation pattern when factoring in the daily technicals. However, at the same time, the $VIX is near its lower end of the range.
Therefore, I am prepared for sideways trading in a wide range in the $SPX until the market gets a read on the NFP data.
To sum up the current viewpoint and opinion:
I have BUY opinions for:
- iShares Trust Russell 2000 ETF (IWM) for an index reconstitution trade. At this time, I would be looking to be long and then exiting upon the actual reconstituted index going into place on June 28, 2021. Buy the rumor, sell the fact type of trade. Buy Pullbacks. For equity-bearish folks, see the IWM/SPY spread idea in the May 27th publication. Always use a stop loss level that caters to your individual risk tolerance.
- Defiance Quantum ETF (QTUM) between $44.00 - $47.25. Update 05/27: I will now raise my buy idea zone upwards to $47.60. Look for pullbacks for entries. Update 06/01: look for pullbacks and always use a stop loss level that caters to your individual risk tolerance.
- Amplify Transformational Data Sharing ETF (BLOK) between $37.68 - $37.91. BLOK has a history of high volatility, so proceed with caution. Always use a stop loss level that caters to your individual risk tolerance. Update 05/27: Patience, patience. I like pullbacks. Always use a stop loss level that caters to your individual risk tolerance.
- Invesco MSCI Sustainable Future ETF (ERTH) between $67.76 - $70.82. Always use a stop loss level that caters to your individual risk tolerance. Update 05/27: ERTH closed at $73.50 yesterday and is continuing to look good. Update 06/01: ERTH closed at $74.12 on Friday.
I have a SELL opinion for:
- June 10-Year Notes (ZNM2021) between 132’06 - 132’17. Always use a stop loss level that caters to your individual risk tolerance. Update 05/27: Yesterday, I mentioned a daily close above 133’01’5 would have me looking elsewhere. It closed on 05/26 at 132’29, so this idea is still in play. Update 06/01: September 10-year notes are now the most liquid contract due to the contract roll. Always stay aware of the Contract Specifications. 10-Year Notes have been trading sideways, perhaps in anticipation of the upcoming data releases this week. If you are involved in a June 10-Year note trade, now is the time to roll to the September contract.
- Invesco DB Commodity Index Tracking Fund (DBC) $18.50 - $18.75. Target 17.50 (old highs) to $17.75. Always use a stop loss level that caters to your individual risk tolerance. Use caution if you are trying this trade, knowing that the DXY could capitulate to this level. See the May 19th publication for more details.
I have a HOLD opinion for:
- First Trust NASDAQ Clean Edge Smart Grid Infrastructure Index Fund (GRID). GRID has traded through our idea range of between $86.91 and $88.17. I do not encourage chasing it, if not already long, in my opinion. Update 05/27: GRID closed at $89.72 yesterday and is chugging along. I now have it listed as a Hold because there were better entry prices a week ago. Don’t chase. Update 06/01: GRID closed at $90.70 on Friday and traded just $0.04 off its 52-week high of $90.96. Short term traders can use these levels as take profit idea levels.
- Short-term traders can look at the 52-week high of $90.96 and high $90.00’s to the psychological $100.00 level as take profit level ideas. Always use a stop loss level that caters to your individual risk tolerance.
Have a great week out there!
Thank you,
Rafael Zorabedian
Stock Trading Strategist

