

Market participants are all waiting with bated breath ahead of today’s CPI data release. It is an important one after last month's shocker of a number. So, what’s your plan?
In general, data releases can be fickle and tricky events. While they may provide opportunities for algorithmic traders due to short-term spats of volatility, it can be challenging to initiate or exit a position as the market digests the data upon release. Longevity in trading can be achieved by being flat around data releases (or at least not highly leveraged); and/or having a what-if plan already in place.
Today’s CPI data (this publication is being written before the data release) could provide some fireworks. Last month, the expectations were for a 0.2% print, and we got 0.8%. Today, the market is looking for 0.4% for the CPI print (includes food and energy) and 0.5% for Core CPI (excludes food and energy). Could this be on the lofty side? Or, will inflation begin to spiral out of control?
Keep in mind that we are heading into a Fed Meeting June 15 -16. If prices continue to rise at an exponential rate, will the Fed really be willing to raise interest rates? It would be appropriate by many standards to do so. However, the theme has been “lower for longer”; and this creates a sense of uncertainty as to what the plan may be if we get another huge CPI print. While neither you nor I have a crystal ball available, my inclination is that the print could be below expectations. If that happens, it would fit the Fed’s “transitory inflation” theme that was discussed in the past. We will find out at 8:30 AM ET today.
As traders wait on this data, the $VIX certainly caught a bump in yesterday’s trading.
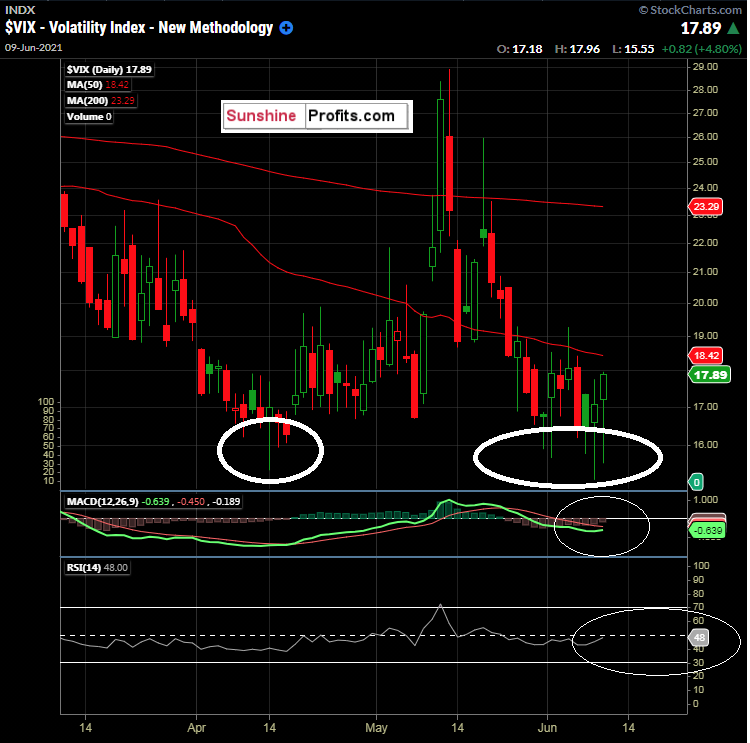
Figure 1 - $VIX Volatility Index March 10, 2021 - June 8, 2021, Daily Candles Source stockcharts.com
We can see some technically bullish signs in the $VIX above, with some long daily tails on the candles coinciding with the April lows. RSI(14) and MACD(12,26,9) are showing bullish crossover signs. The $VIX can be a bit of a tricky barometer to trade technically.
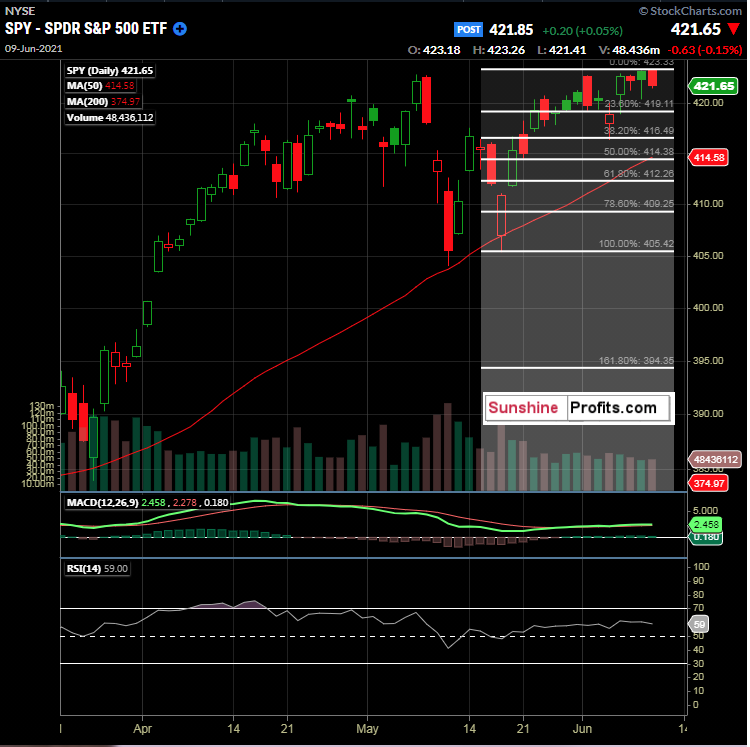
Figure 2 - SPY SPDR S&P 500 ETF March 9, 2021 - June 8, 2021, Daily Candles Source stockcharts.com
The SPY indeed put in a down session yesterday with the $VIX higher. As we have been discussing, the S&P 500 is near the higher end of its range and will most likely need a catalyst to get moving one way or the other.
The 50-day moving average is $414.58 right now, which is only 1.676% away from the current price. A move down to the 50-day moving average could be of interest.
In addition, we can see the Fibonacci retracement levels of interest in the SPY from the May 19th low to the June 8th highs. We see the 50% retracement level @ $414.38 and the 61.8% retracement level at $412.26. I like how the 50% retracement level lines up with the 50 day moving average here.
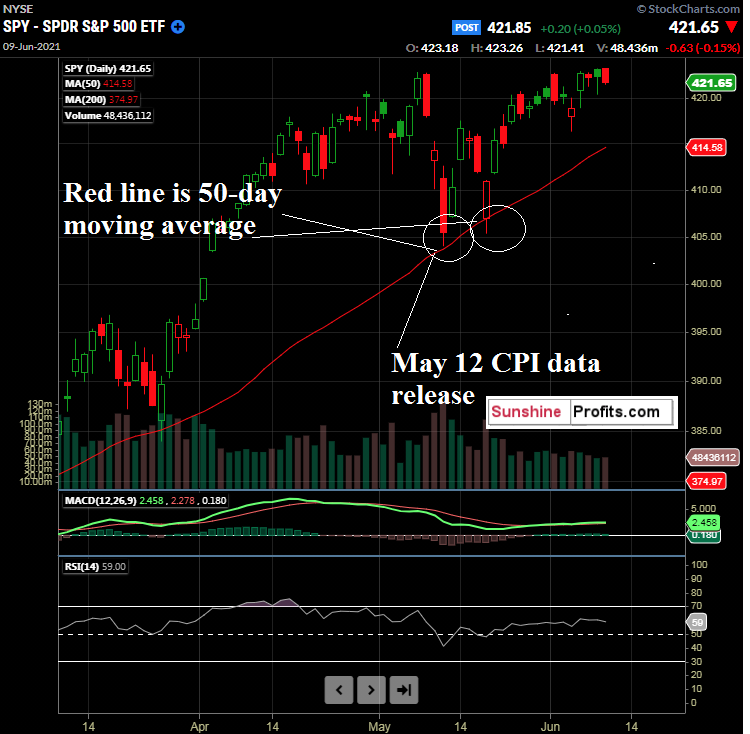
Figure 3 - SPY SPDR S&P 500 ETF March 9, 2021 - June 8, 2021, Daily Candles Source stockcharts.com
Next, no one knows with any degree of certainty how the equity markets will react to the CPI print, whether it exceeds or misses expectations. Here is what we do know: the last data release brought the cash S&P 500 near the 50-day moving average, which held up well. It then tested the 50-day moving average four trading sessions later, and it once again held up very well. Could the same type of price action be in store this time?
Nobody knows. However, I am inclined to look for a move for a potential pullback opportunity, between $412.26 (61.8% Fibonacci retracement level above) and the 50-day moving average ($414.58 as of the close on June 8th). If the market moves higher off the CPI data, so be it. The market will be there tomorrow. Remember to monitor the 50-day moving average level, as it changes each day!
To sum up the current viewpoint and opinion:
I have BUY opinions for:
- iShares Trust Russell 2000 ETF (IWM) for an index reconstitution trade. At this time, I would be looking to be long and then exiting upon the actual reconstituted index going into place on June 28, 2021. Buy the rumor, sell the fact type of trade. Buy Pullbacks. For equity-bearish folks, see the IWM/SPY spread idea in the May 27th publication. Always use a stop loss level that caters to your individual risk tolerance.
- Update: 06/10: The IWM shed 0.67% in yesterday’s session to close at 231.34. It is still well above the $223.36 level when initiating coverage. Opinion: stay long. I think there is still time to get on board here. See the May 27th publication.
- Defiance Quantum ETF (QTUM) between $44.00 - $47.25. Update 05/27: I will now raise my buy idea zone upwards to $47.60. Look for pullbacks for entries. Update 06/10: QTUM closed at $48.54 in yesterday’s session. Always use a stop loss level that caters to your individual risk tolerance.
- Amplify Transformational Data Sharing ETF (BLOK) between $37.68 - $37.91. BLOK has a history of high volatility, so proceed with caution. Always use a stop loss level that caters to your individual risk tolerance. Update 06/10: Patience still. Bitcoin and crypto have been weak and another shoe could drop. Monitoring.
- Invesco MSCI Sustainable Future ETF (ERTH) between $67.76 - $70.82. Always use a stop loss level that caters to your individual risk tolerance. Update 06/10: ERTH closed at $75.57 yesterday. Hold longs. Chugging along.
- Invesco Exchange-Traded Fund Trust - S&P SmallCap 600 Pure Value ETF (RZV) at the 50-day moving average. Patience and wait for the pullback. Always use a stop loss level that caters to your individual risk tolerance. Update 06/10: RZV 50-day MA is 91.80 as of the close yesterday. The last trade on 06/08 was $98.93. Monitoring.
- iShares Global Timber & Forestry ETF (WOOD) Initial buy idea zone between $79.07 and the 200-day moving average. Update: Patience and wait for the pullback. Monitoring. Always use a stop loss level that caters to your individual risk tolerance.
- SPDR S&P 500 ETF (SPY) between $412.26 (61.8% Fibonacci retracement level above) and the 50-day moving average ($414.58 as of the close on June 8th). Always use a stop loss level that caters to your individual risk tolerance.
I have SELL opinions for:
NONE
I have a HOLD opinion for:
- First Trust NASDAQ Clean Edge Smart Grid Infrastructure Index Fund (GRID). GRID has traded through our idea range of between $86.91 and $88.17. Update 06/10: GRID closed at $91.54 yesterday. Opinion: hold longs.
- Always use a stop loss level that caters to your individual risk tolerance.
Brace for some price volatility from the CPI data today. Exercise patience and discipline. Have a great day!
Thank you,
Rafael Zorabedian
Stock Trading Strategist

