

Briefly:
Intraday trade: The S&P 500 index gained 0.3% on Thursday, after opening 0.2% higher. Our yesterday's intraday neutral outlook proved quite accurate. The stock market will likely open lower today. We may see some more short-term uncertainty along the resistance level. We prefer to be out of the market, avoiding low risk/reward ratio trades.
Medium-term trade: In our opinion, no medium-term positions are justified.
Our intraday outlook is neutral. Our short-term outlook is neutral, and our medium-term outlook is neutral:
Intraday outlook (next 24 hours): neutral
Short-term outlook (next 1-2 weeks): neutral
Medium-term outlook (next 1-3 months): neutral
The U.S. stock market indexes were mixed between -0.1% and +0.9% on Thursday, as investors continued to hesitate following Wednesday's FOMC's Rate Decision announcement, Thursday's ECB Statement release. The S&P 500 index is still close to its mid-March local high of around 2,800. It currently trades 3.1% below January's 26th record high of 2,872.87. The Dow Jones Industrial Average lost 0.1%, and the technology Nasdaq Composite gained 0.9% yesterday.
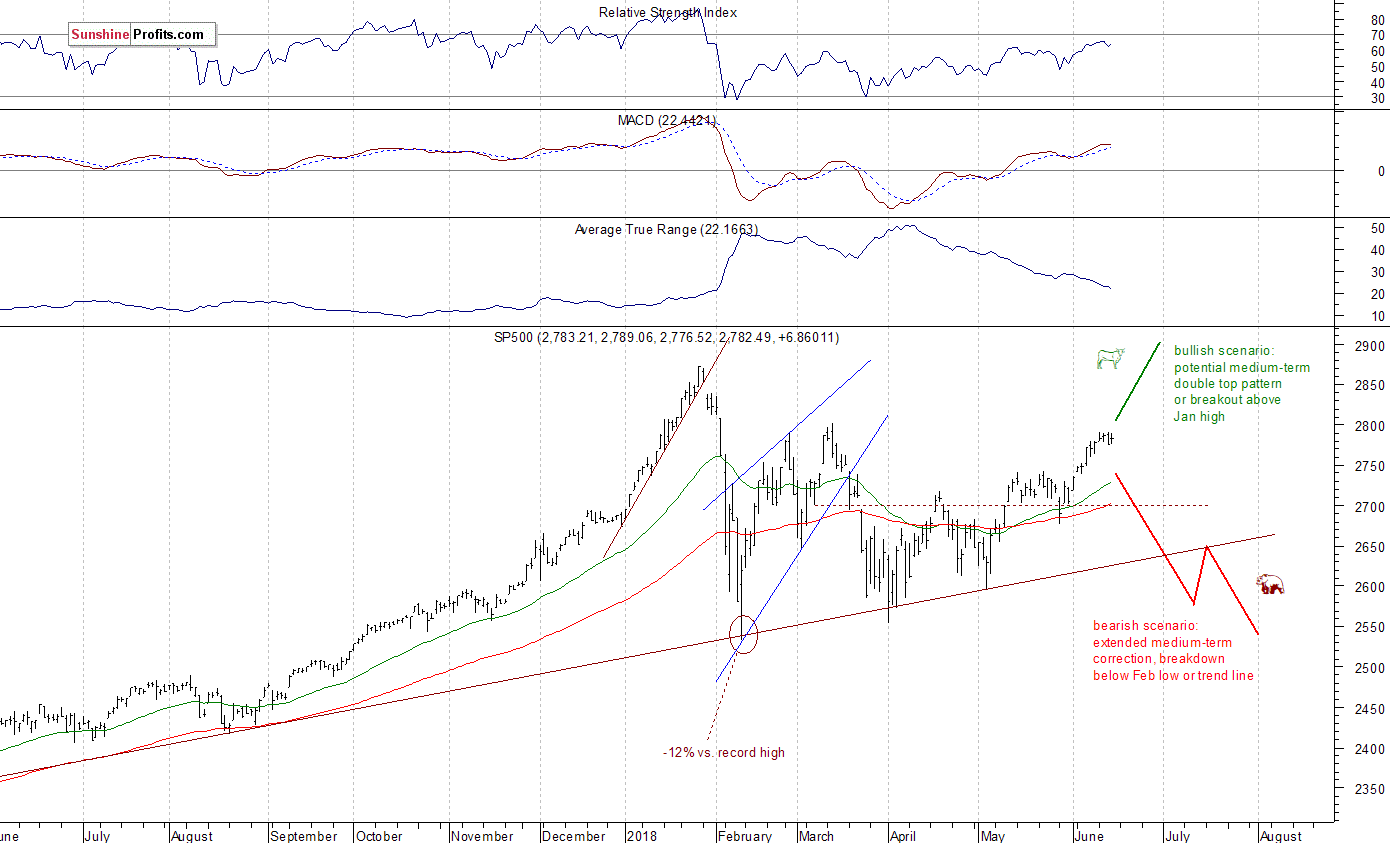
The nearest important level of resistance of the S&P 500 index remains at around 2,790-2,800, marked by the recent local highs along with mid-March local high. The next resistance level is at 2,830-2,840, marked by the late January short-term consolidation. On the other hand, support level is at 2,760-2,765, marked by the recent local lows. The next level of support is at 2,750, marked by previous level of resistance. The support level is also at 2,735-2,740, marked by last week's Monday's daily gap-up of 2,736.93-2,740.54.
The broad stock market accelerated its short-term uptrend a week ago following the S&P 500 index' breakout above the resistance level of 2,750. Will it continue higher? We continue to see investors' uncertainty and profit taking action, because the market is close to the resistance level of around 2,800. There are still two possible medium-term scenarios - bearish that will lead us below February low following trend line breakdown, and the bullish one in a form of medium-term double top pattern or breakout towards 3,000 mark. There is also a chance that the market will just go sideways for some time, and that would be positive for bulls in the long run (some kind of an extended flat correction):
Negative Expectations, but Still Within a Consolidation
The index futures contracts trade 0.3-0.6% lower vs. their yesterday's closing prices this morning. So expectations before the opening of today's trading session are negative. The main European stock market indexes have been mixed so far. Investors will now wait for series of economic data announcements this morning: Empire State Manufacturing Index at 8:30 a.m., Industrial Production, Capacity Utilization Rate at 9:15 a.m., Michigan Sentiment number at 10:00 a.m. The broad stock market may extend its short-term consolidation today. There may be some more profit taking action, because investors get bored of seeing the same prices over and over again. However, there have been no confirmed negative signals so far.
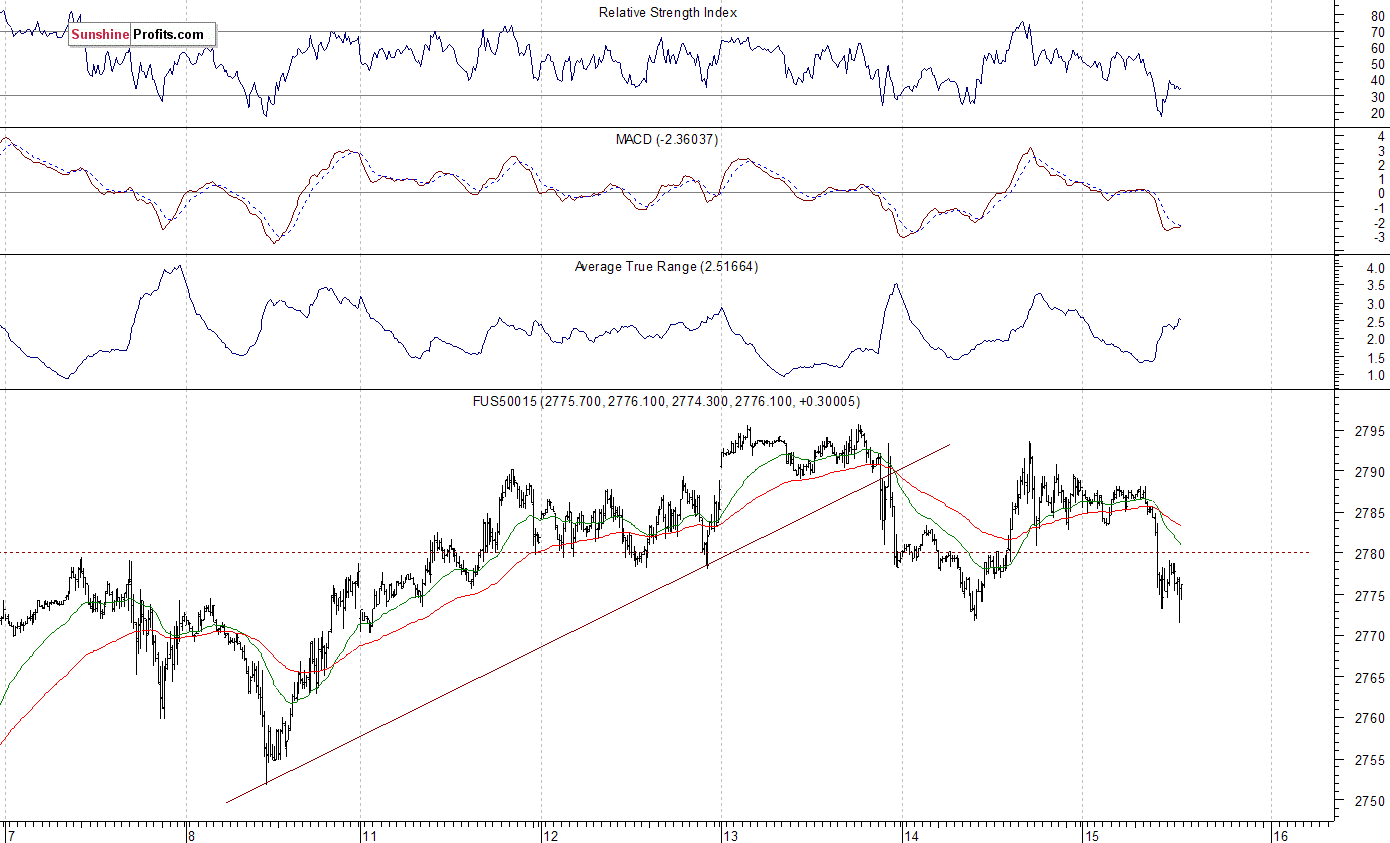
The S&P 500 futures contract trades within an intraday downtrend, as it retraces most of its yesterday's intraday advance. The nearest important level of resistance remains at around 2,795-2,800, marked by the local highs. On the other hand, support level is now at 2,770-2,775, marked by some short-term local lows. The support level is also at 2,750-2,760. The futures contract extends its short-term consolidation, as we can see on the 15-minute chart:
Nasdaq at New Record High
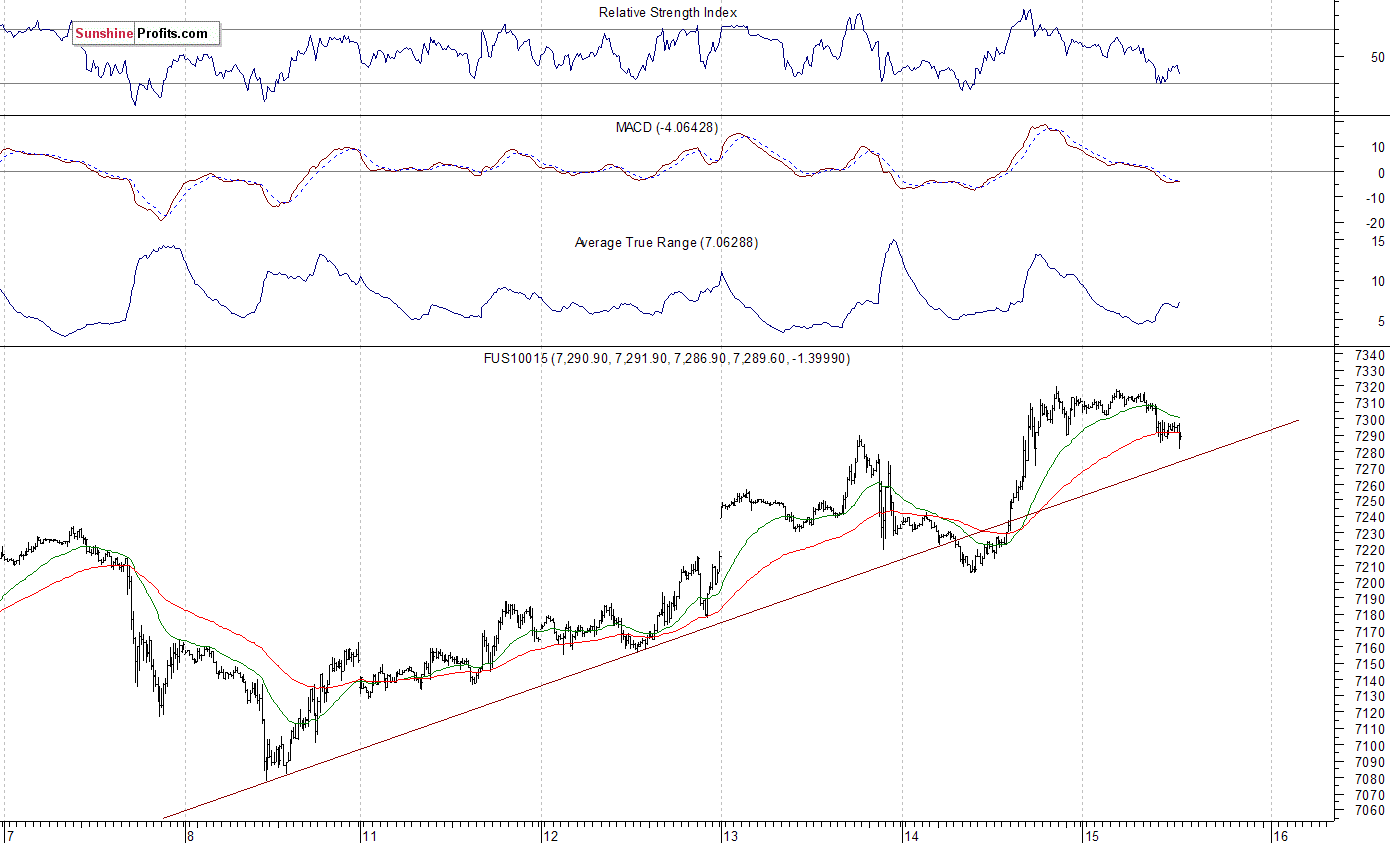
The technology Nasdaq 100 futures contract reached new record high yesterday, as it broke slightly above the level of 7,300. The market remains close to 7,300 mark this morning. Will it continue even higher? We can see some short-term overbought conditions. The nearest important level of support is at around 7,200-7,250, marked by the recent fluctuations. On the other hand, the resistance level is at 7,320. The Nasdaq futures contract continues to trade along its upward trend line, as the 15-minute chart shows:
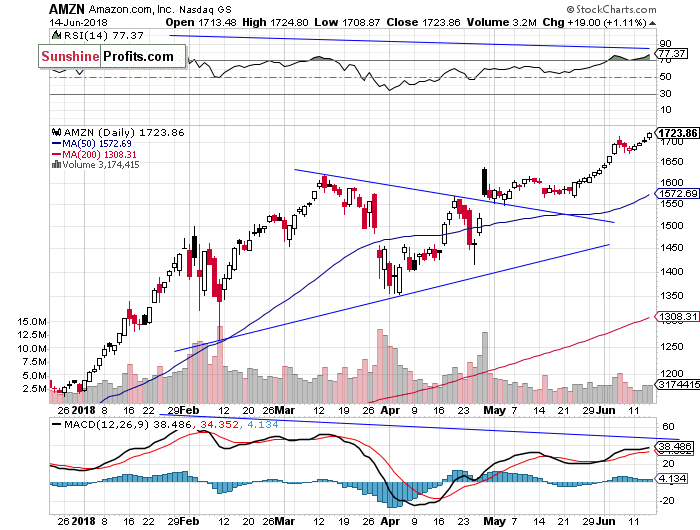
Apple Goes Sideways, Amazon Breaks Higher
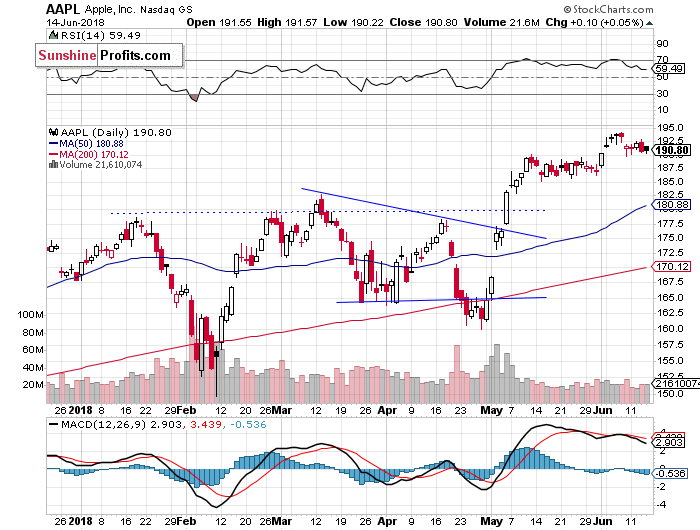
Let's take a look at Apple, Inc. stock (AAPL) daily chart (chart courtesy of http://stockcharts.com). It reached new record high a week ago, as it slightly extended its short-term uptrend following last week's Monday's breakout above $190. Then the stock retraced some of its advance, as it fell closer to $190 again. Investors' sentiment remains bullish, but will the uptrend continue? There have been no confirmed negative signals so far. For now, it looks like a short-term consolidation:
Now let's take a look at Amazon.com, Inc. stock (AMZN) daily chart. It reached new record high yesterday. Is this a topping pattern before a downward reversal? There have been no confirmed negative signals so far. However, we can see some negative technical divergences that may lead to a downward correction:
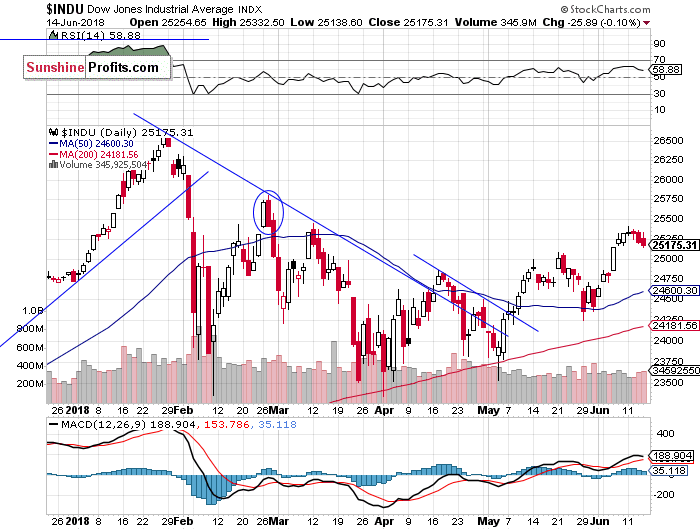
Dow Jones Relatively Weaker Again
The Dow Jones Industrial Average extended its short-term consolidation yesterday. The blue-chip index remains above the level of 25,000 following its recent advance. Will the uptrend continue? There is a potential level of resistance at around 25,400-25,500, marked by mid-march local high. But there have been no confirmed negative signals so far:
The S&P 500 index trades within a short-term consolidation since Monday, as investors hesitate following last week's advance. Is this a topping pattern or just flat correction before another leg higher? The market remains below the resistance level of around 2,800. For now, it looks like a correction within an uptrend, but if the index breaks below its recent local lows, it could accelerate lower.
Concluding, the S&P 500 index will likely open lower today, as investors get bored of seeing the same price action over and over again and they may take profits off the table at some point. Will the sentiment improve later in the day? It's hard to say. There have been no confirmed negative signals so far.
Currently, we prefer to be out of the market, avoiding low risk/reward ratio medium-term trades. We will let you know when we think it is safe to get back in the market.
To summarize: no medium-term positions are justified from the risk/reward perspective at this moment.
Intraday trade:
No intraday position is justified from the risk/reward perspective today.
No medium-term position is justified from the risk/reward perspective at this moment.
Thank you.
Paul Rejczak
Stock Trading Strategist
Stock Trading Alerts

