

Briefly: In our opinion, speculative short positions are favored (with stop-loss at 2,510, and profit target at 2,300, S&P 500 index).
Our intraday outlook is bearish, and our short-term outlook is bearish. Our medium-term outlook remains neutral, following S&P 500 index breakout above last year's all-time high:
Intraday outlook (next 24 hours): bearish
Short-term outlook (next 1-2 weeks): bearish
Medium-term outlook (next 1-3 months): neutral
Long-term outlook (next year): neutral
The U.S. stock market indexes were mixed between -0.04% and +0.03% on Monday, as investors hesitated following recent rally. The S&P 500 index remained close to its Friday's new all-time high level of 2,463.54. The broad stock market gauge has broken above its previous July 19 record high above 2,450 mark. The Dow Jones Industrial Average remained above 21,600 mark, close to its new record high of 21,661.81. The technology Nasdaq Composite got closer to its June 6 all-time high of 6,341.7. The nearest important support level of the S&P 500 index is now at around 2,450-2,455, marked by June 19 local high. The next level of support is at 2,430-2,435, marked by last Wednesday's daily gap up of 2,429.30-2,435.75. The support level also remains at 2,400-2,410, marked by the May 25 daily gap up of 2,405.58-2,408.01, among others. On the other hand, potential level of resistance is at 2,465, marked by new all-time high. The next resistance level is at 2,500 mark. There have been no confirmed negative signals so far. However, we can see overbought conditions and negative technical divergences. The S&P 500 index broke above its over month-long consolidation, as we can see on the daily chart:
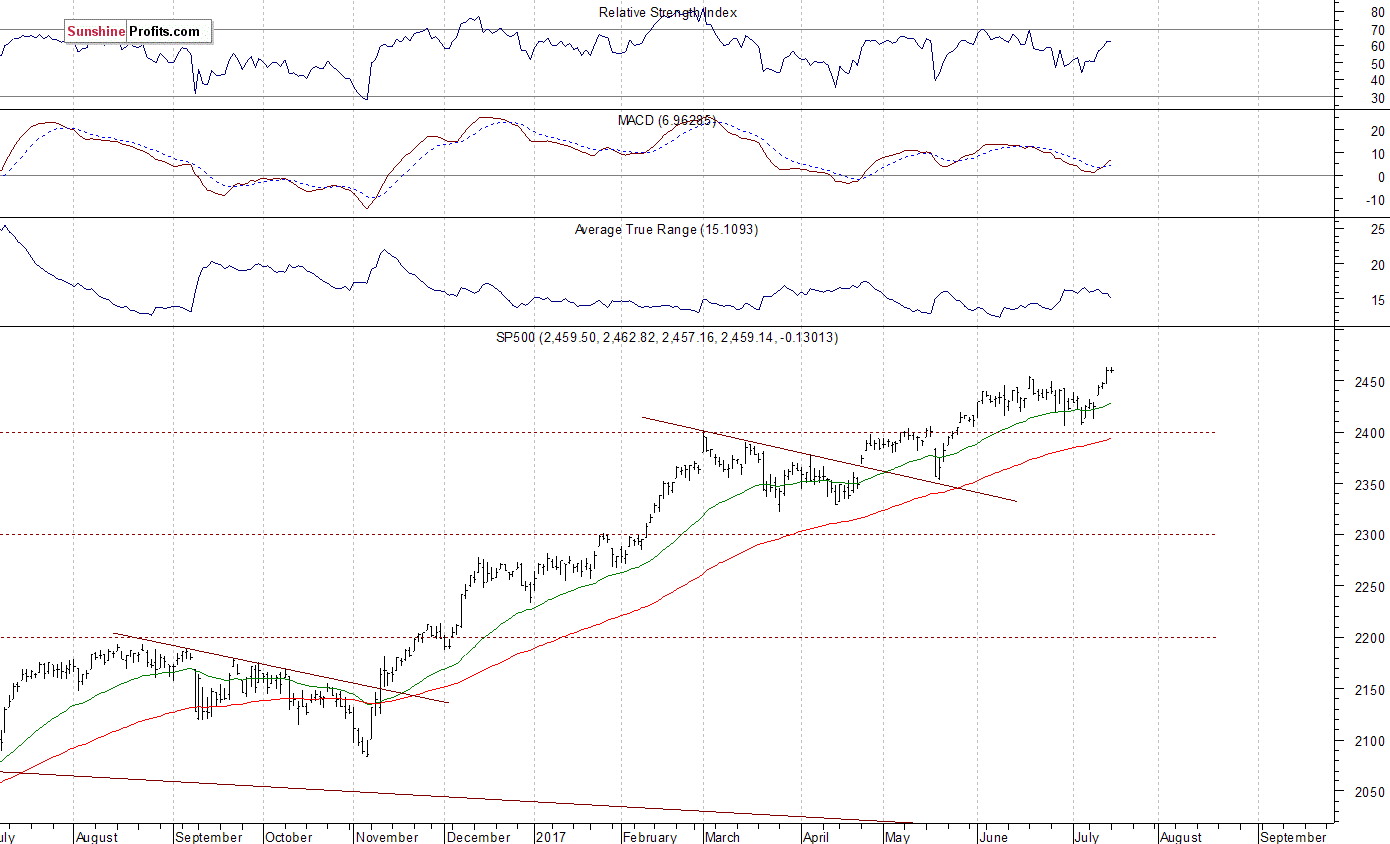
Consolidation At New Record High
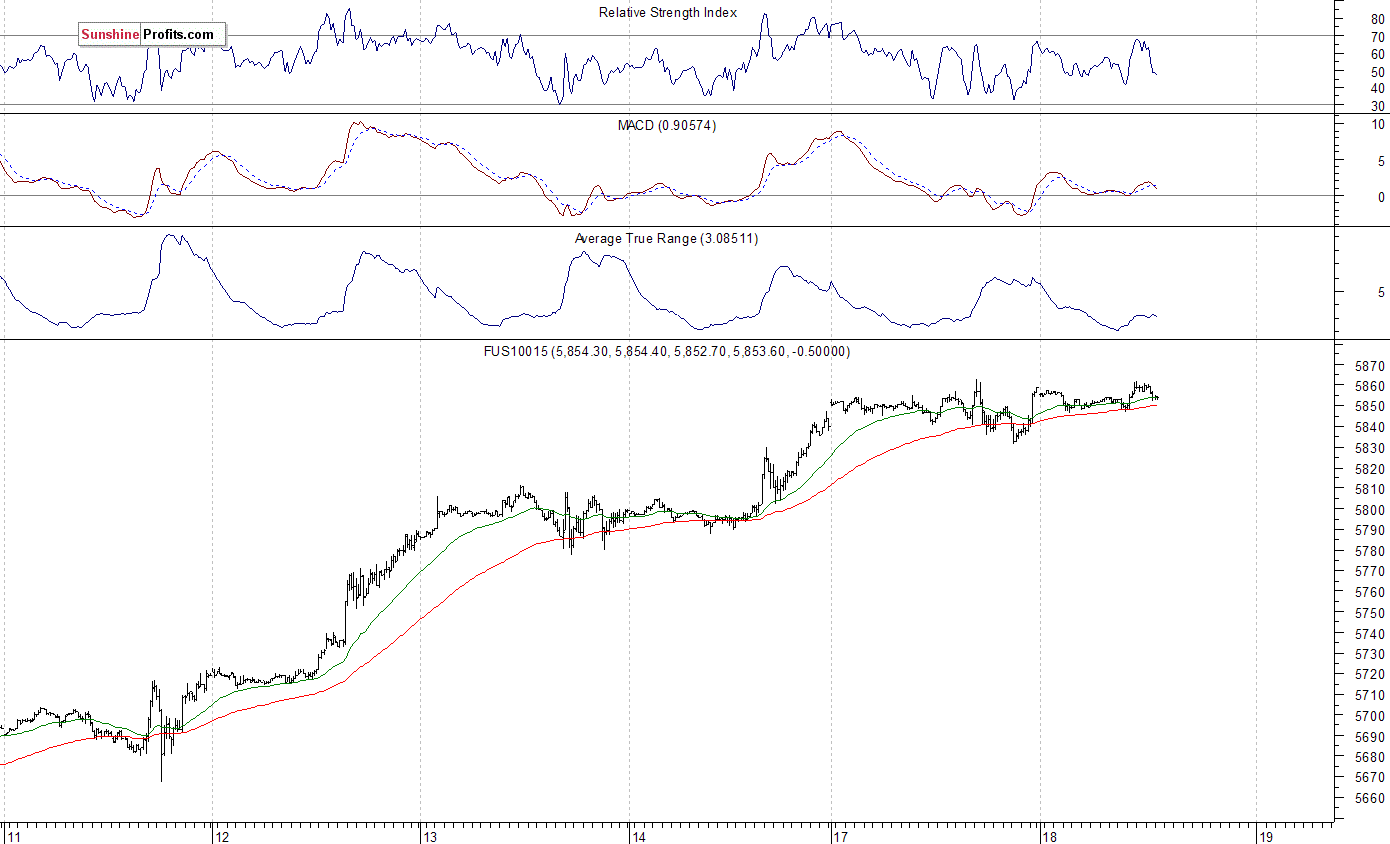
Expectations before the opening of today's trading session are virtually flat, with index futures currently between -0.02% and +0.03% vs. their Monday's closing prices. The European stock market indexes have been mixed so far. Investors will now wait for quarterly corporate earnings releases. The S&P 500 futures contract trades within an intraday consolidation, following Friday's rally. The market trades close to its new record high slightly above the level fo 2,460. The nearest important level of resistance is at around 2,455-2,460, marked by record high. On the other hand, support level is at 2,440-2,450, and the next support level is at 2,420-2,430, marked by recent consolidation. Will the market extend its uptrend? Or is this some topping pattern before downward reversal?
Big Tech Earnings In Focus
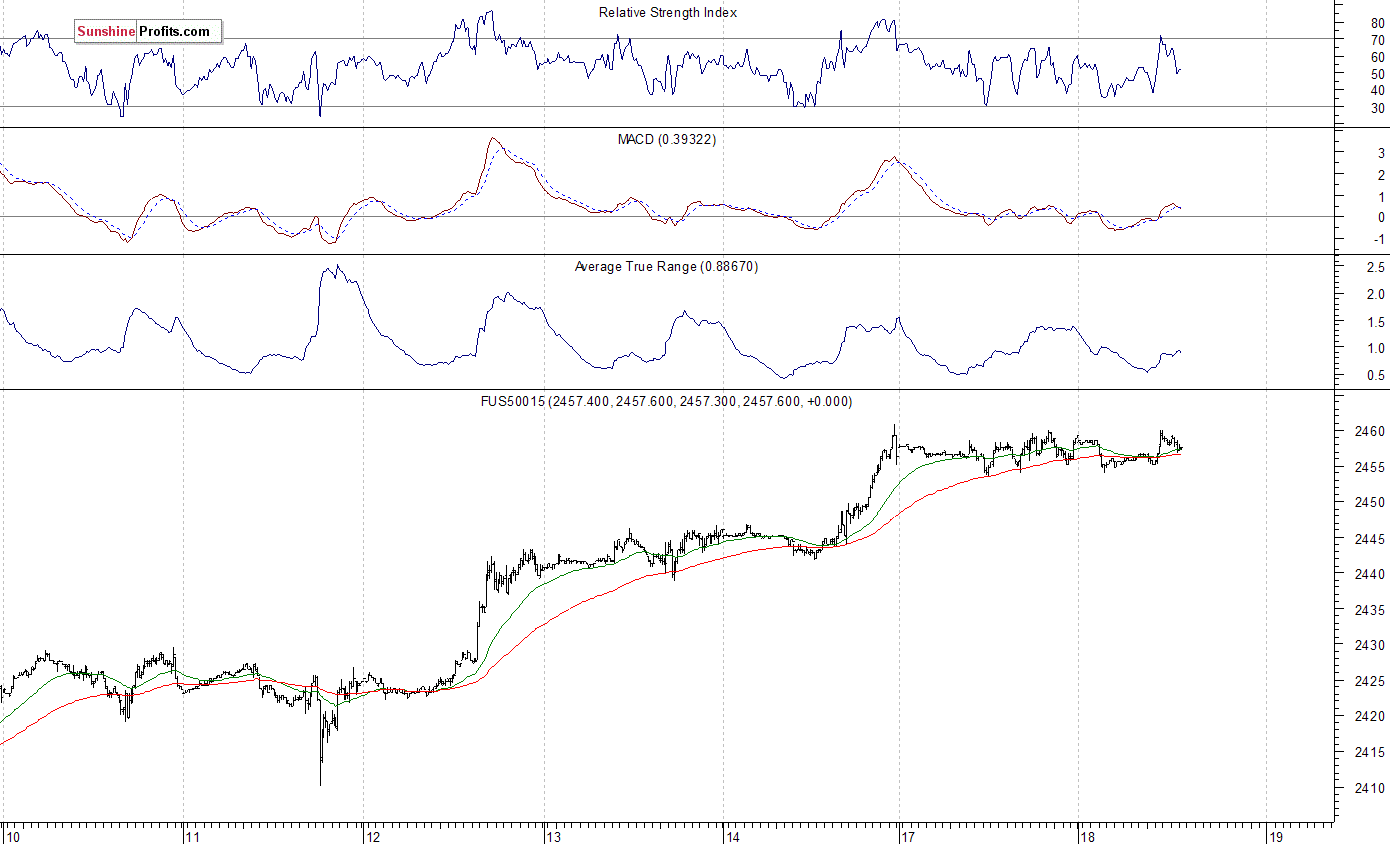
The technology Nasdaq 100 futures follows a similar path, as it trades within an intraday consolidation. It fluctuates along local high of around 5,860, as investors react to yesterday's better-than-expected Netflix' quarterly earnings release. The Nasdaq futures contract has retraced almost all of its June decline. It currently trades closer to record high, and less than 1% below 5,900 mark. The nearest important level of resistance is at around 5,870-5,900, marked by all-time high. On the other hand, support level is at 5,800-5,820, and the next level of support is at 5,780, marked by some recent fluctuations, as the 15-minute chart shows:
Concluding, the S&P 500 index broke above its month-long trading range on Friday, as investors' sentiment much improved. It fluctuated within a relatively narrow trading range on Monday. Will uptrend accelerate towards 2,500 mark? Or is this some topping pattern before downward reversal? There have been no confirmed negative signals so far. However, we still can see negative technical divergences, along with medium-term overbought conditions.
Therefore, we continue to maintain our speculative short position (opened at 2,437.83 on June 5 - opening price of the S&P 500 index). Stop-loss level is at 2,510 and potential profit target is at 2,300 (S&P 500 index). You can trade S&P 500 index using futures contracts (S&P 500 futures contract - SP, E-mini S&P 500 futures contract - ES) or an ETF like the SPDR S&P 500 ETF - SPY. It is always important to set some exit price level in case some events cause the price to move in the unlikely direction. Having safety measures in place helps limit potential losses while letting the gains grow.
To summarize: short position in S&P 500 index is justified from the risk/reward perspective with the following entry prices, stop-loss orders and profit target price levels:
S&P 500 index - short position: profit target level: 2,300; stop-loss level: 2,510
S&P 500 futures contract (September) - short position: profit target level: 2,297; stop-loss level: 2,507
SPY ETF (SPDR S&P 500, not leveraged) - short position: profit target level: $230; stop-loss level: $251
SDS ETF (ProShares UltraShort S&P500, leveraged: -2x) - long position: opening price: $12.56; profit target level: $13.98; stop-loss level: $11.82
Due to a holiday break, beginning from Wednesday, July 19 until Friday, July 28, there will be no Stock Trading Alerts. We apologize for inconvenience.
As stated above, we continue to maintain our short position for the coming two weeks. The stop-loss remains at 2,510, and potential profit target is at 2,300 (S&P 500 index).
Thank you.
Paul Rejczak
Stock Trading Strategist
Stock Trading Alerts

