

We’ve reached a very critical juncture in the markets. Last week, I mentioned how this reminded me of the Q4 2018 pullback (read my story here), and still maintain that there is way too much complacency in this market. Stock markets are risky for a reason, something many Robinhood traders are sure to find out this year.
My goal for these updates is to educate you, give you ideas, and help you manage money like I did when I was pressing the buy and sell buttons for $600+ million in assets. I left that career to pursue one where I could help people who needed help, instead of the ultra high net worth. Hopefully, you’ll find the below enlightening from my perspective, and I welcome your thoughts and questions.
Stocks closed the week with their first weekly declines in nearly a month.
The pullbacks weren't anything astronomical, but it could potentially be the start of the Q1 declines that I have been predicting.
For one, valuations are insane, and the tech IPO market is looking like clown school. The S&P 500 is trading near its highest forward P/E ratio since 2000, while the Russell 2000 has never traded this high above its 200-day moving average.
Signs are starting to point towards the return of inflation by mid-year as well. As the 10-year yield ticked up to its highest level since March, economist Mohammed El-Erian said “if we were to see another 20 basis point move in yields, that would be bad news.”
Expectations haven’t been this high for inflation in years either. According to Edward Jones, the 10-year breakeven rate hit its highest level since 2018 last week due to rising commodity prices, a weaker dollar, and broad stimulus policy. The 10-year breakeven rate is a market-based measure of inflation expectations.
What’s also concerning is that investors didn’t seem to bat an eye at Joe Biden’s $1.9 trillion stimulus package!
What does this tell me?
That maybe this was anticipated and priced in already. According to Jim Cramer on his Mad Money show on CNBC, “When an event occurs and the market gets exactly what it wants, but nothing more, it’s treated as a reason to sell, not to buy.”
Although this week's decline was moderate, I still feel that a correction between now and the end of Q1 2020 is likely amidst a tug of war between good news and bad news.
Generally, corrections are healthy for markets and more common than most realize. Only twice in the last 38 years have we had years WITHOUT a correction (1995 and 2017). The last time we saw one was in March 2020, so we could be well overdue.
Corrections are healthy market behavior and could be an excellent buying opportunity for what should be a great second half of the year.
Therefore, to sum it up:
While there is long-term optimism, there are short-term concerns. A short-term correction between now and Q1 2021 is possible. I don't think that a decline above ~20%, leading to a bear market will happen.
I hope everyone has a great day. Best of luck, and happy trading!
The S&P 500’s Pullback Was Not Enough…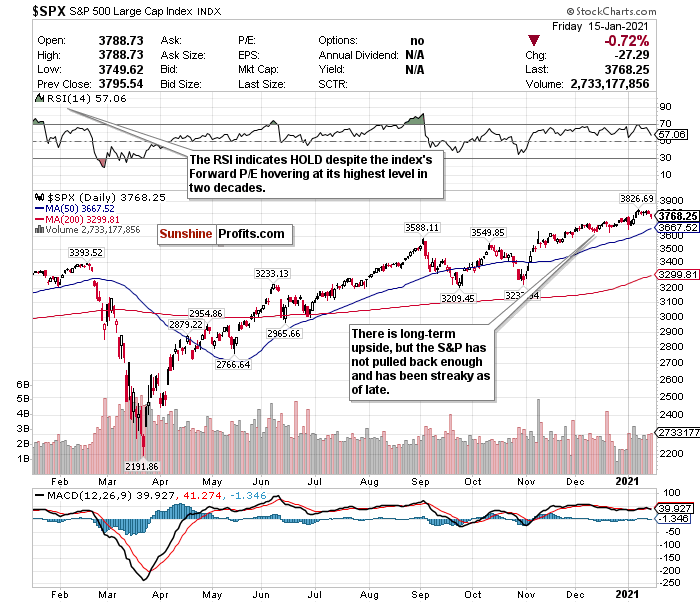

Figure 1- S&P 500 Large Cap Index $SPX
What tells me everything I need to know about the S&P 500 right now is JP Morgan’s earnings report.
On the surface, JP Morgan blew past top and bottom line estimates, and saw a net income year over year growth of 42%.
However, the stock declined 1.79% on the day.
On one hand, the decline could be misguided and a good buying opportunity as banks are expected to execute stock buybacks and hike dividends this year.
On the other hand, look deeper into the call, and there are some things to get nervous about.
JP Morgan reported a net benefit of $1.89 billion in credit reserves and is maintaining a reserve topping $30 billion.
Why is this worrying? According to CEO Jamie Dimon, this is because of “significant near term uncertainty” due to the pandemic.
Dimon further added that despite vaccine and stimulus-related optimism, JP Morgan is holding onto these reserves in order to “withstand an economic environment far worse than the current base forecast by most economists.”
Conventional wisdom would tell you that the S&P had overheated and valuations are crazy- especially considering the economic climate we’re in right now. The index’s forward P/E ratio is nearly the highest it’s been in two decades.
The index seems to go on multiple day winning streaks and losing streaks. After seeing its worst sell-off since October last Monday (Jan. 4), for example, it went on a four-day win streak and broke past 3800.
The index has pulled back somewhat now and is hovering around the 3760 level.
So where does it go from here? Personally, I love gains. All-time highs are nice. But discount shopping is even more fun for the long-term.
I would like to see a deeper drop to around 3600 or below before making a BUY call for the long-term. There is clear upside for the second half of 2021, but I would prefer to maximize it from a lower level.
A short-term correction could inevitably occur by the end of Q1 2021, but for now, I am sticking with the S&P as a HOLD.
For an ETF that attempts to directly correlate with the performance of the S&P, the SPDR S&P ETF (SPY) is a good option.
Can Small-caps Own 2021?
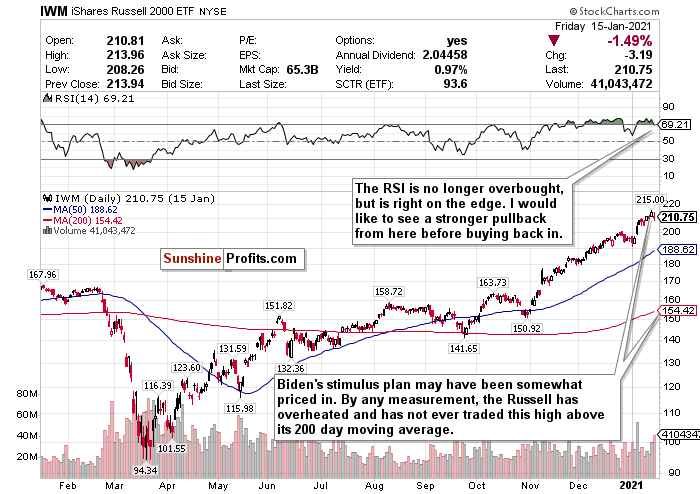
Figure 2- iShares Russell 2000 ETF (IWM)
Before Friday’s decline (January 15), small-caps popped as the most likely beneficiaries from a Biden-led stimulus plan and Democrat-controlled Congress.
But I go back to Cramer’s quote about how when investors finally get what they expect (i.e., a large stimulus package), it is usually a cause to sell rather than buy. Markets don’t care about the here and now- they care about the future.
While I love small-cap stocks in the long-term, especially as the world reopens, the index has overheated by any measurement. Before January 4, the RSI for the IWM Russell 2000 ETF was at an astronomical 74.54. I called a sell-off happening in the short-term due to this RSI, and it happened.
After the RSI hit another scorching hot level of nearly 77 last Wednesday (January 13), the IWM Russell 2000 ETF declined by another 1.5%. I said that Russell stocks would imminently cool down because the RSI was so hot, and precisely that’s what happened.
Stocks don’t always go up in a straight line, and that’s what the Russell 2000 did between November and Christmas before pulling back. The trajectory looked eerily similar between January 4 and Friday, January 15. So I’m not surprised in the least that it fell as hard as it did to close the week out.
Small-caps are more sensitive to the news. On the positive news front, vaccine-related gains may have been baked in by now. I’m starting to think that some stimulus gains have been baked in as well. Although Biden’s stimulus plan isn’t official (he isn’t even the president just yet), the proposal was what investors wanted and did not exceed expectations.
I hope small-caps decline a minimum of 10% before jumping back in for long-term buying opportunities.
SELL and take profits if you can- but do not fully exit positions. If there is a deeper pullback, this is a STRONG BUY for the long-term recovery.
The Nasdaq’s RSI Indicates Hold- But is a Deeper Pullback Coming?
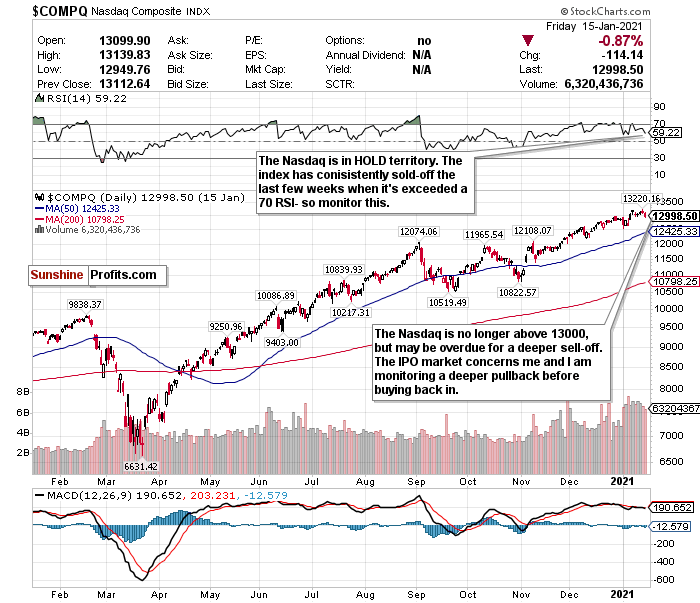
Figure 3- Nasdaq Composite Index $COMP
It’s impossible to ignore the sex appeal of tech stocks. These stocks have astronomical growth potential and are at the forefront of disruption and innovation.
Pay close attention, especially to cloud computing, e-commerce, and fintech opportunities, in 2021.
I am keeping the theme of using the RSI to judge how to call the Nasdaq. An overbought RSI does not automatically mean a trend reversal, but with the Nasdaq, I always keep a close eye on this.
I initially changed my short-term call on the Nasdaq from a SELL to a HOLD on January 5. I liked the Nasdaq’s declines to start 2021, especially after overheating. The RSI was no longer overbought as well.
After changing the call back to a SELL on January 11, the Nasdaq declined 1.45%.
Over the last several weeks, this has been a consistent pattern for the Nasdaq. The Nasdaq pulled back on December 9 after exceeding an RSI of 70 and briefly pulled back again after passing 70 again three weeks ago. We also exceeded 70 RSI before the new year, and what happened on the first trading day of 2021? A decline of 1.47%.
The Nasdaq is no longer technically overbought, and its RSI is now back below 60. However, the tech IPO market screams dot-com bubble to me. Just this past week, Lender Affirm nearly doubled in its public debut, while Poshmark surged by over 130% during its world premiere.
I have no other words to describe this besides a circus of greed.
I still love tech and am generally bullish for 2021. But I need to see the Nasdaq take a more significant breather and move closer to its 50-day moving average before thinking about buying back in.
I also have some concerns with the Democrats winning Senate control and its potential consequences for tech. The Democrat sweep is better for small-caps than tech.
It may not happen in 2021, but a Democrat-controlled Congress could raise taxes and further regulate tech companies experiencing high growth.
Because the RSI is still in HOLD territory, I’m keeping my call for now as a HOLD.
If the RSI ticks back up above 70, I’m switching back to SELL. The Nasdaq is trading in a clear pattern.
For an ETF that attempts to directly correlate with the performance of the NASDAQ, the Invesco QQQ ETF (QQQ) is a good option.
Mid-Term/Long-Term
Taiwan and Others for Emerging Market Exposure - Not China
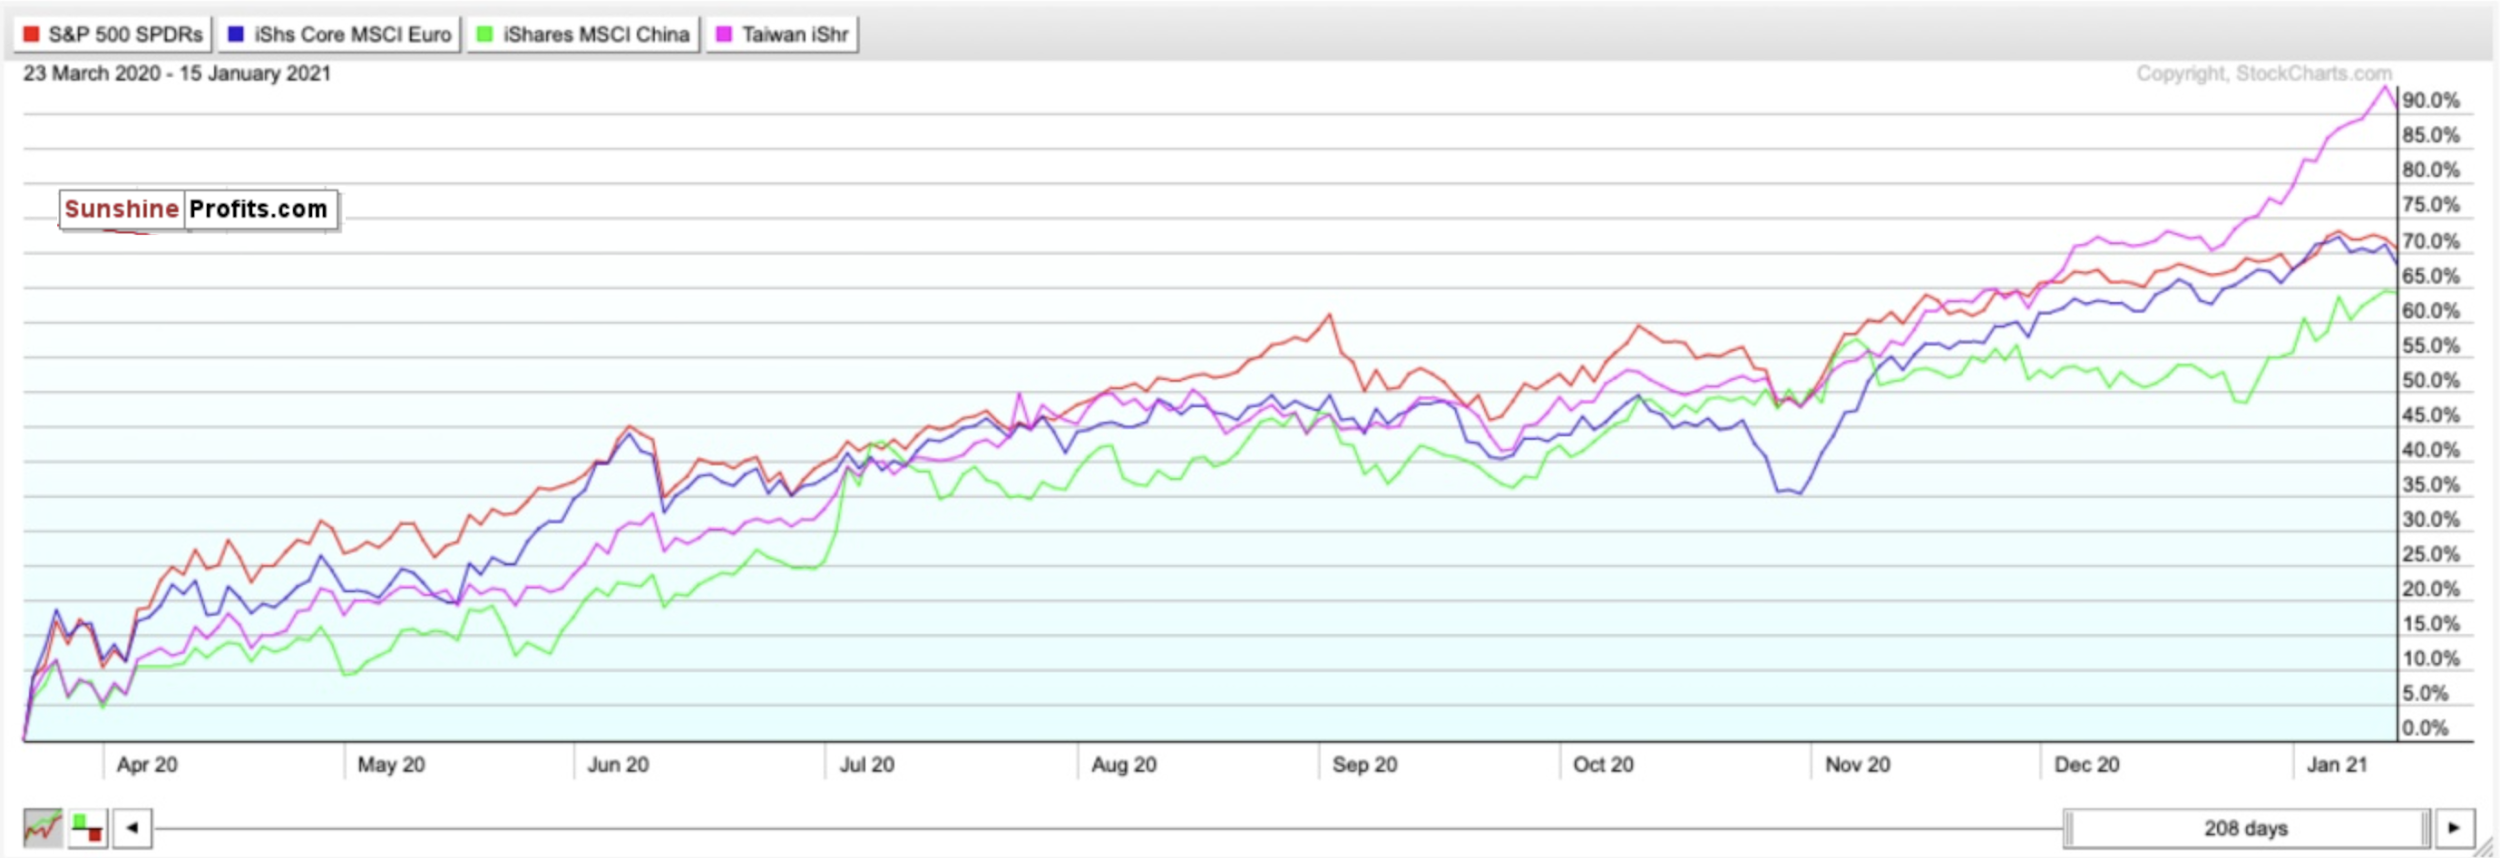
Figure 4- SPY, IEUR, MCHI, and EWT comparison chart-March 23, 2020-Present
We are in an environment prime for emerging markets to shine in both the medium-term and long-term. But it is very country-specific.
China garners most of the attention as a so-called “emerging market.” But it is truly hard to consider it an emerging market any longer. What is “emerging” about being the largest economy in the world with over a billion people?
Although China outperformed in the last week, over the short-term, medium-term, and long-term, it has underperformed many country-specific and region-specific ETFs since the markets bottomed on March 23rd.
Despite the minor rally in the last week, I don’t see China as a top option for international exposure in 2021. While China’s regional upside is undeniable, it also has geopolitical risks and a baked-in economic recovery.
Continue to look at the Taiwan iShares ETF (EWT) as an alternative. Taiwan has outperformed China in the short-term, medium-term, and long-term.
As seen in the chart below, ever since I first called the Taiwan ETF (IWT) a BUY on December 3rd it has outperformed the MSCI China ETF (MCHI), the SPDR S&P ETF (SPY), and iShares Core Europe ETF (IEUR).
The EWT has gained 13.78%. This is nearly double the MSCI China ETF’s (MCHI) returns- despite the MCHI outperforming the EWT in the last week.
The Taiwan ETF has also outperformed the SPY S&P 500 ETF by nearly 4.75x.
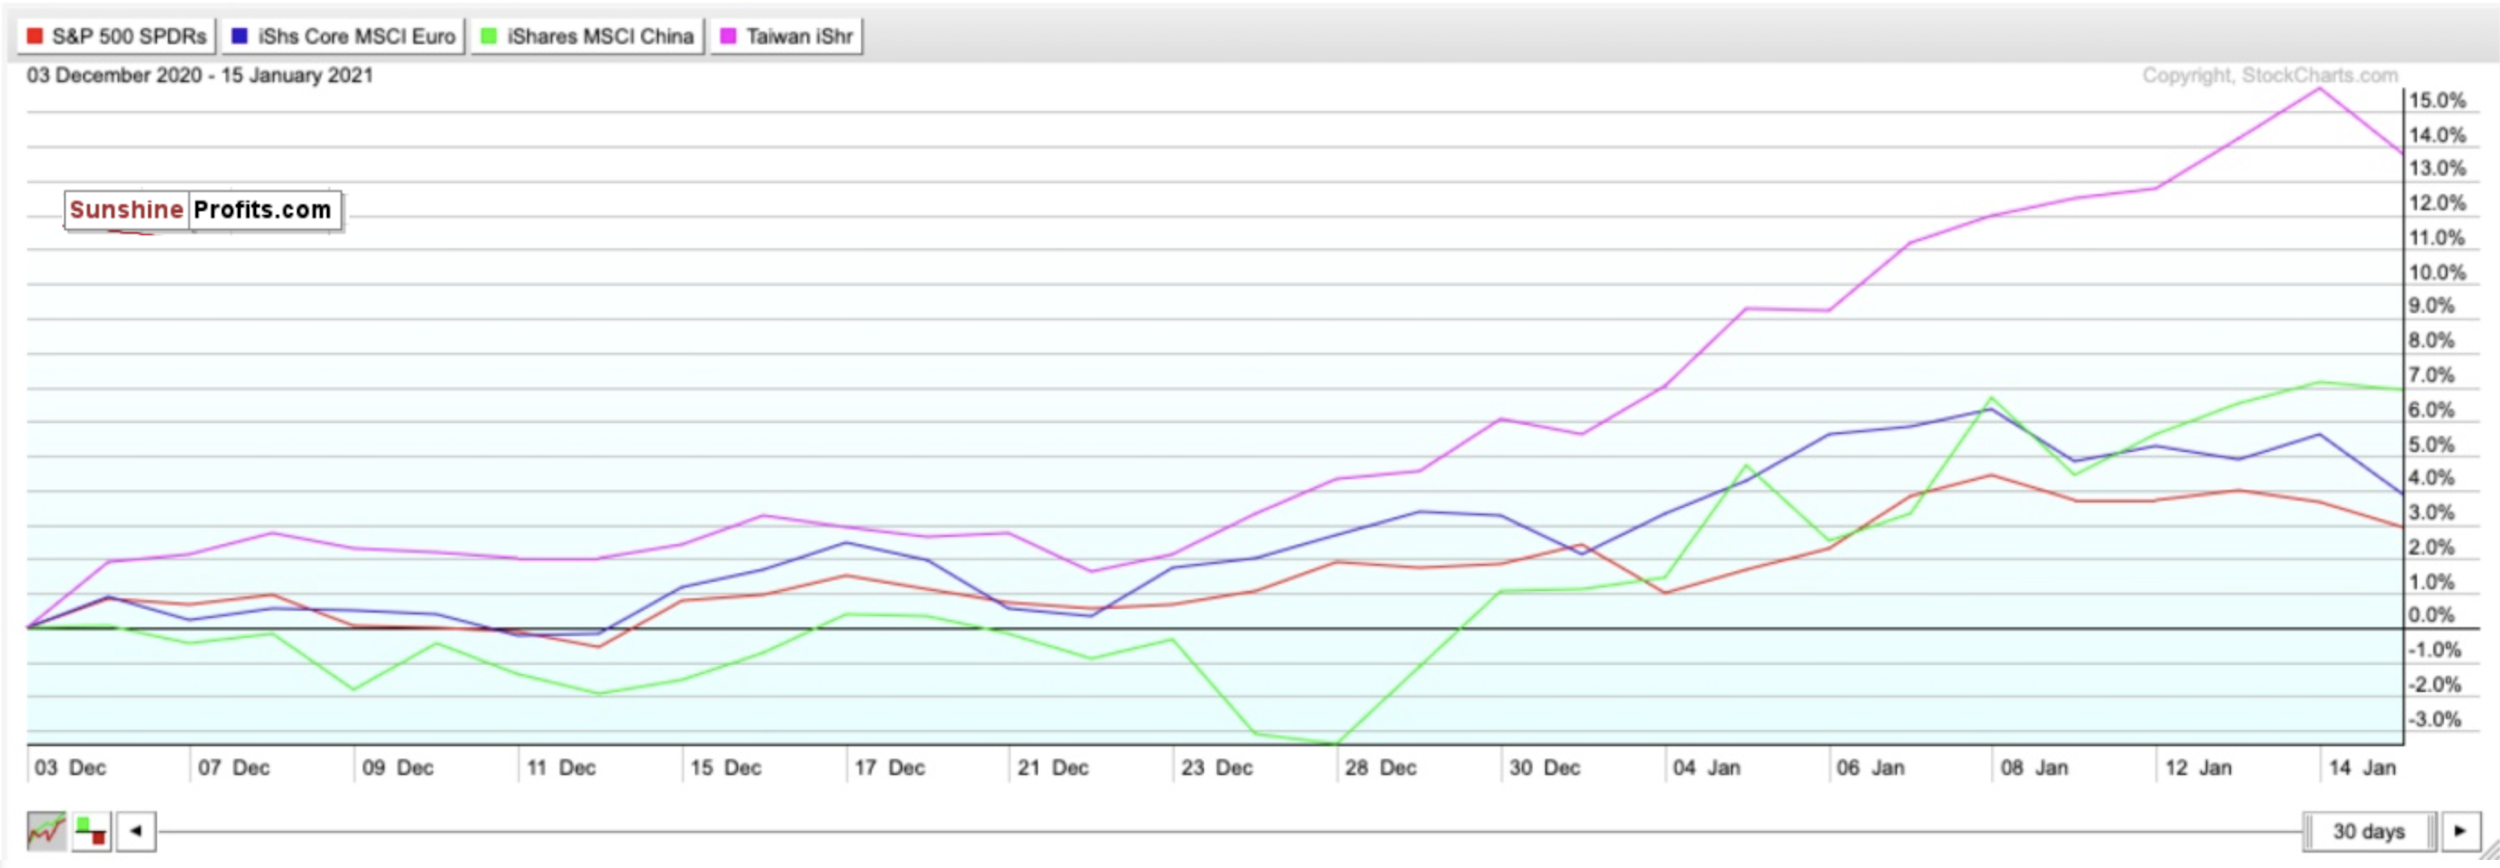
Figure 5- SPY, IEUR, MCHI, and EWT comparison chart- Dec. 3, 2020-Present
There are two other emerging markets I am very bullish on for 2021 as well- Thailand and Russia.
According to a Bloomberg study from December 16th projecting the top emerging markets for 2021, Thailand topped the list due to solid reserves and a high potential for portfolio inflows, Russia came in second due to robust external accounts, a strong fiscal profile, and an undervalued currency.
Guess who scored last on this list? China. High expectations were largely already baked in during its 2020 recovery, and there is no longer upside.
Do you also know who significantly outperformed the Taiwan ETF (IWT), the MSCI China ETF (MCHI), the SPDR S&P ETF (SPY), and iShares Core Europe ETF (IEUR) since Election Day? The iShares MSCI Thailand ETF (THD) and the iShares MSCI Russia ETF (ERUS).
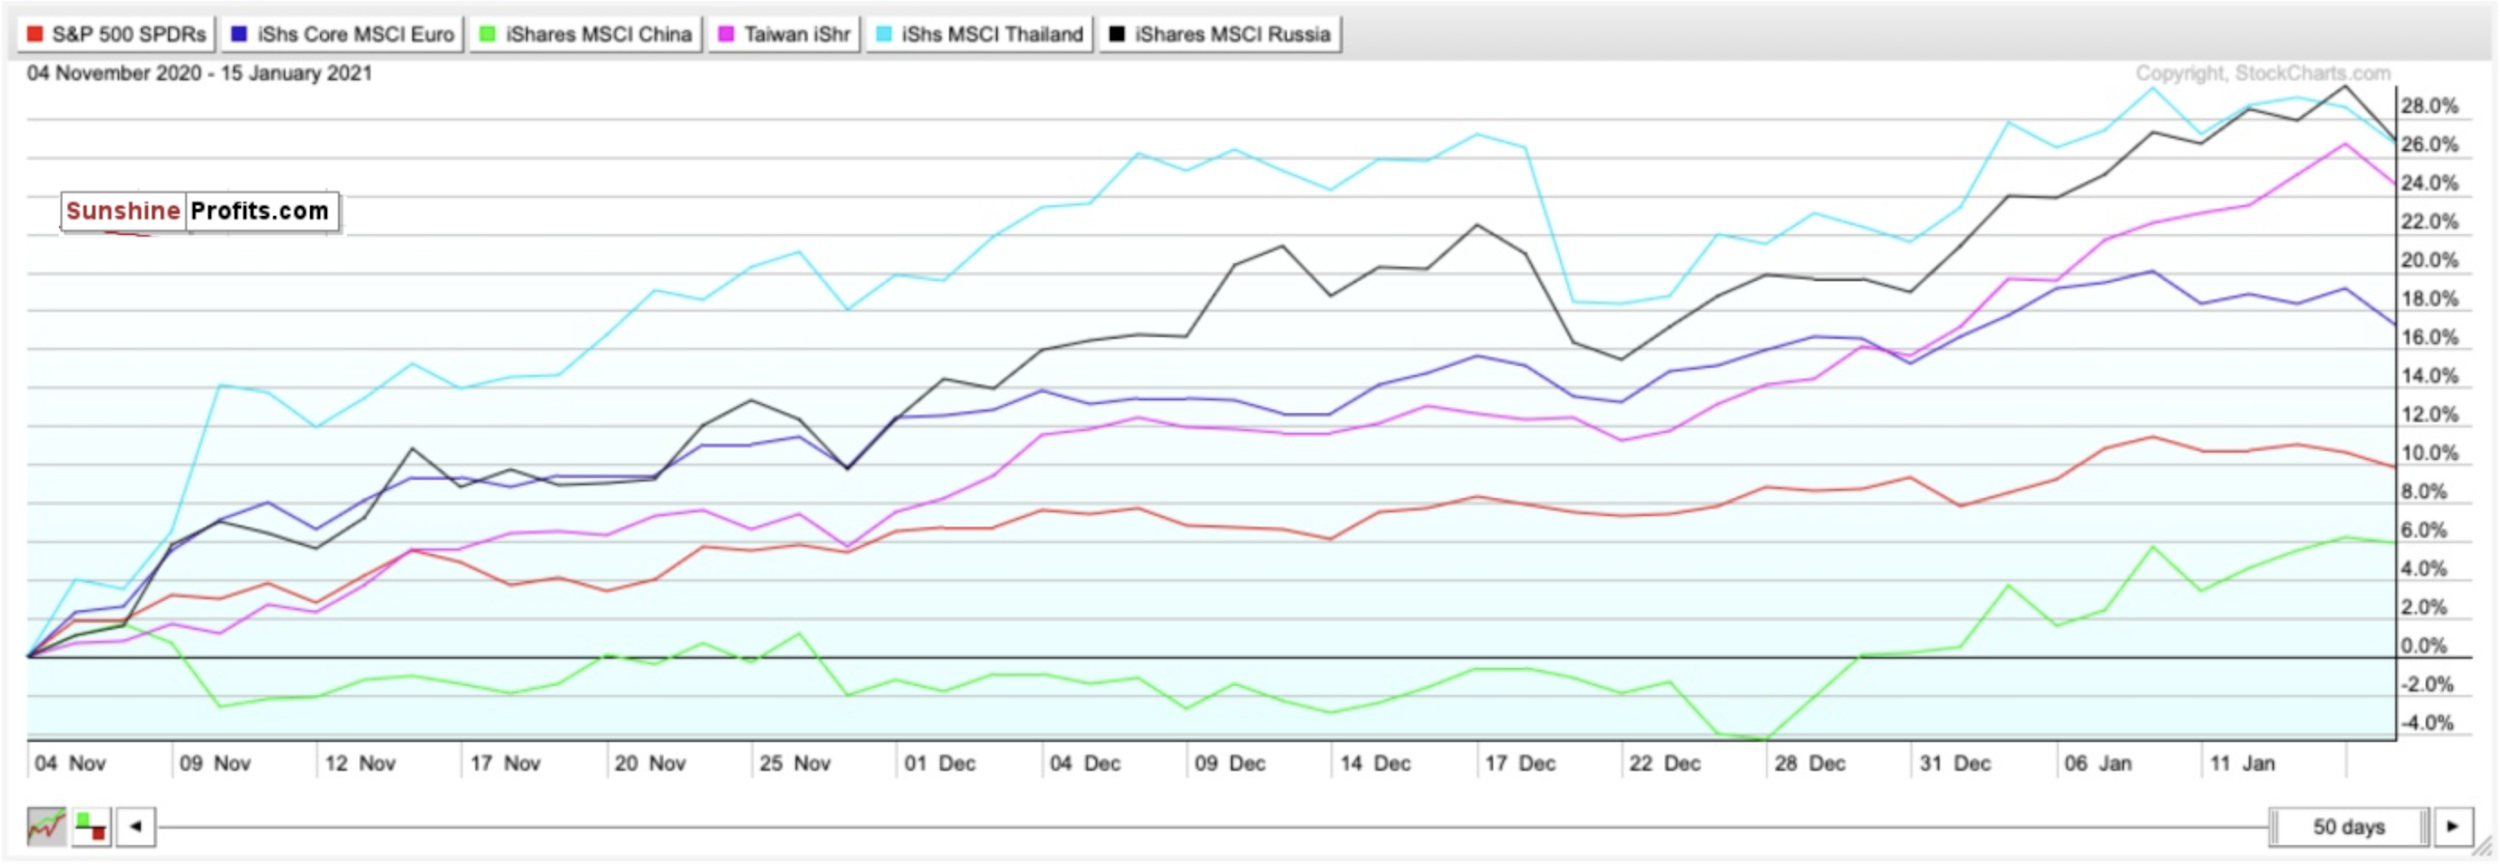
Figure 6- SPY, IEUR, MCHI, EWT, THD, ERUS comparison chart- Nov. 4, 2020-Present
For broad exposure to Emerging Markets, you will want to BUY the iShares MSCI Emerging Index Fund (EEM), for exposure to a regional economic power without the geopolitical risks of China, you will want to BUY the iShares MSCI Taiwan ETF (EWT). Consider the iShares MSCI Thailand ETF (THD) and the iShares MSCI Russia ETF (ERUS) as well for 2021 upside.
The Dollar Saw Another Rally- but I Don’t Buy It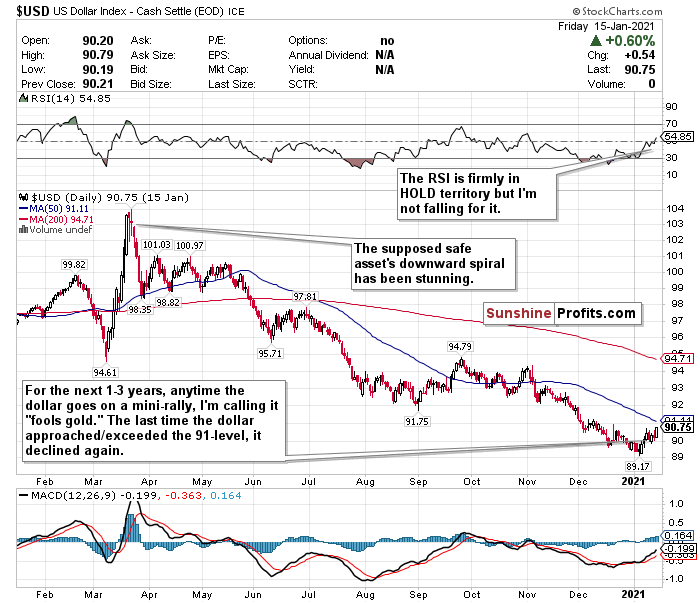

Figure 7- U.S. Dollar $USD
Although the U.S. Dollar ticked up somewhat the last two weeks, I still do not see the greenback as a safe asset.
I’m still calling out the dollar’s weakness after several weeks and expect the decline to restart thanks to a dovish Fed and multiple headwinds.
Any time the U.S. Dollar rallies, I am calling it “fools gold.”
Since I started doing these newsletters about a month ago, I have consistently said that any minor rally the dollar experienced would be a mirage. After it briefly pierced the 91-level on December 9th, it fell sharply.
Although the dollar is nearly back at the 91-level, I don’t think it will last.
With Democrats in full control of the government, Biden’s $1.9 trillion stimulus plan could further devalue the dollar.
I do not foresee how you can be remotely bullish on the U.S. Dollar. You can’t keep printing money and expect the dollar to magically go up. This is real life, not a board game with pretend money.
With inflation possibly creeping back sooner than we realize, the dollar could be entering a typhoon of headwinds.
I also have too many doubts on the effect of interest rates this low for this long, the strengthening of emerging markets, commodity prices, and yes, even cryptocurrencies, to be remotely bullish on the dollar’s prospects over the next 1-3 years.
Meanwhile, the US has $27 trillion of debt, and it’s not going down anytime soon.
According to The Sevens Report, if the dollar falls below 89.13, this could raise the prospect of a further 10.5% decline to the next support level of 79.78 reached in April 2014. We are closer to this point than most realize, with more stimulus on the horizon.
When COVID-19 fears outweigh any other positive sentiments, dollar exposure might be useful since it is a safe harbor. But you can do a whole lot better than the U.S. dollar for safety. Since hitting a nearly 3-year high on March 20th, the dollar has plunged almost 12%
Where possible, HEDGE OR SELL USD exposure.
Pay Very Close Attention to Inflation
Pay very close attention to the possible return of inflation within the next 6-12 months. The Fed has said it will allow the GDP to heat up, and it may overshoot in the medium-term as a result. GDP growth may stutter in Q1 2021 but pay close attention to what happens in Q2 and Q3 once vaccines begin to be rolled out on a massive scale. It is only inevitable that inflation will return with the Fed’s policy and projected economic recovery by mid-2021.
The 10-year’s recent rally reflects this as well.
If you are looking to the future to hedge against inflation, look into TIPS, commodities, gold, and potentially some REITs.
In the mid-term, I have BUY calls on the SPDR TIPS ETF (SPIP), the Invesco Optimum Yield Diversified Commodity Strategy No K-1 ETF (PDBC), the SPDR Gold Shares ETF (GLD), and the iShares Cohen & Steers REIT ETF (ICF).
Long-Term
There is so much to worry about in the short-term. But I’m convinced that economic stimulus and the progress made with administering the vaccines bodes well for the second half of 2021. We may be at the beginning of the end of the pandemic-but over the next 1-3 months, this could be a very bumpy ride back.
There does seem to be one consensus though: 2021 could be a big year for stocks.
I have a very good feeling about stocks, especially small-caps, value stocks, and cyclicals. I just have a much better feeling for them in the second half of 2021. I almost hope we see a correction within the first 3 months of 2021. This could be a very strong buying opportunity.
Summary
The current headwinds are very concerning. But I remain optimistic for the second half of 2021 despite the bumpy road there. Until COVID-19 is eradicated, there will inevitably be a tug of war between optimism and pessimism.
A short-term correction could be inevitable-but do not let this scare you.
Remember- corrections are NORMAL and markets tend to look 6-12 months down the road. If there is a short-term downturn, take a breath, and use it as a time to find buying opportunities for the second half of 2021. Do not get caught up in fear if there is a correction.
NEVER TRADE WITH EMOTIONS.
Consider this. Since markets bottomed on March 23rd, ETFs tracking the indices have seen returns like this: Russell 2000 (IWM) up 113.97%. Nasdaq (QQQ) up 83.87%. S&P 500 (SPY) up 70.66%. Dow Jones (DIA) up 67.79%.
In the long-term, markets always end up moving higher and are focused on the future rather than the present.
To sum up all our calls, in the short-term I have a SELL call for:
- The iShares Russell 2000 ETF (IWM) (but do not fully exit positions- trim profits),
I have a HOLD call for:
- The Invesco QQQ ETF (QQQ),
- the SPDR S&P ETF (SPY), and
- the SPDR Dow Jones ETF (DIA)
I also have a long-term STRONG BUY call for:
- the iShares Russell 2000 ETF (IWM) BUT IF AND WHEN IT PULLS BACK
For all these ETFs, I am more bullish in the long-term for the second half of 2021.
For the mid-term and long-term, I recommend selling or hedging the US Dollar, and gaining exposure into emerging markets.
I have BUY calls on:
- The iShares MSCI Emerging Index Fund (EEM),
- the iShares MSCI Taiwan ETF (EWT),
- the iShares MSCI Thailand ETF (THD), and
- the iShares MSCI Russia ETF (ERUS).
Additionally, because I foresee inflation returning as early as mid to late 2021…
I also have BUY calls on:
- The SPDR TIPS ETF (SPIP),
- the Invesco Optimum Yield Diversified Commodity Strategy No K-1 ETF (PDBC)
- the SPDR Gold Shares ETF (GLD), and
- the iShares Cohen & Steers REIT ETF (ICF)
Thank you.
Matthew Levy, CFA
Stock Trading Strategist

