

Trading position (short-term; our opinion): short positions at market (100% position size) with stop-loss level at 2985 and the binding take-profit at 2850.
During the first half of yesterday's session, the bulls were in the driving seat after repelling sellers at the open. Yet again, their gains have evaporated, and stocks not only broke to new lows, but also closed there. Will today's session be any different?
With the sizable daily volatility, it's well worth checking the downswing on the weekly chart (charts courtesy of http://stockcharts.com).
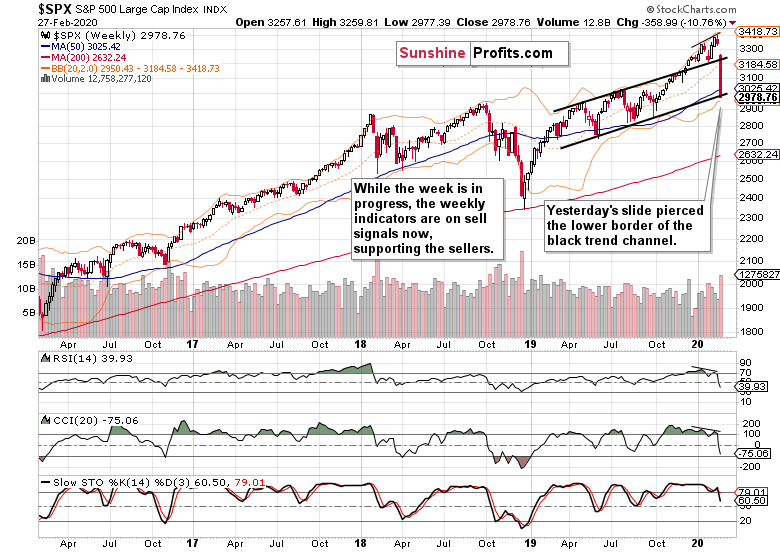
Yesterday's plunge took prices all the way down to the lower border of the rising black trend channel, and then some. The breakdown hasn't been confirmed yet, but unless the bulls really show up today, prices will close the week below the channel. And frankly, we don't expect them to.
Our yesterday's observations ring as true today as they did throughout the week:
(...) Yesterday's slide turned the weekly indicators' sell signals even more into negative territory. The bulls woefully failed to lift prices and this week's sizable bearish gap stands unchallenged. Both the gap and the indicators continue to support the bears.
The preceding divergencies are still being resolved. Let's quote our Monday's observations when we discussed the comparison between:
(...) the levels of both of these indicators with the price action. Stocks have been rising while both the RSI and CCI made lower highs. You can see it marked on the above chart with thin black lines. We have two divergences here - in other words, they didn't confirm the price advance.
How does yesterday's session look on the daily chart?
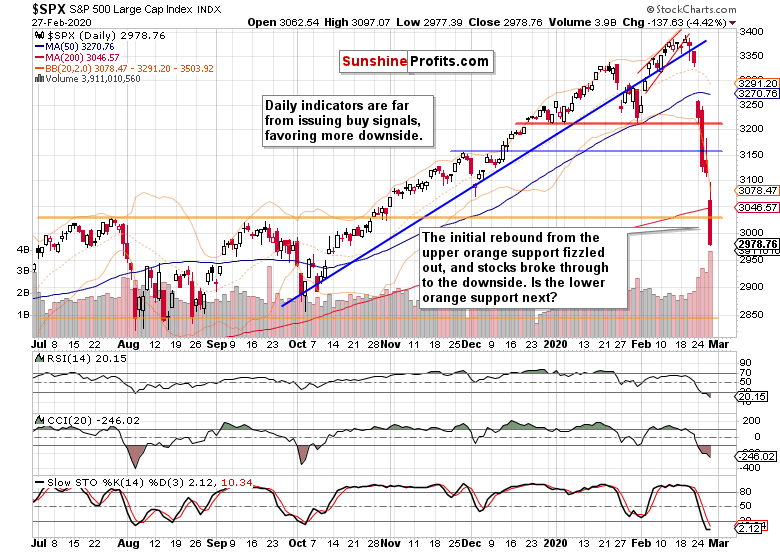
Another day, another bearish gap. The opening bell was met with heavy selling, which took stocks right through the upper orange support, reaching 3006. The bulls stepped in and midway into the session, it appeared that the breakdown attempt would be invalidated. But as the closing bell draw nearer, the bears kept driving prices back through the orange support, forcing a close well below it.
Our subscribers have been ready, and we captured more than 95 points of the slide.
And what about today?
The bulls are attempting to lift prices in the premarket trading. Yet, they have reached only 2950 so far. Not a really convincing show of strength. It looks like we're in for yet another dead-cat bounce.
There are quite a few reasons for why this slide has more to go.
In yesterday's Alert, we have commented extensively on the evolving coronavirus situation the ground. The only thing to add today, is to pinpoint the likely catalyst - the first US case without any ties to China. Now, we'll expand the below assessment along the economic lines:
(...) In public consciousness, this has further to go before true panic has been reached. The reality is currently only starting to be recognized, there's still some denial present in the mix. Burying head in the sand, if you will.
Fundamentally, we haven't yet seen earnings impact. The same goes for mounting supply chain disruptions. Consumer confidence still remains high. So do sales. That's the low-hanging fruit...
It makes sense to strike an optimistic tone when addressing the crisis. It's about managing expectations and softening the blow the virus is making on economic activity and consumer perceptions. The toll is heavy already, and likely to get worse before it gets better again.
Some places are attempting to counter the economic impact. Hong Kong has announced cash handouts and tax relief to its residents in a confidence boost attempt. The bets on Fed taking action have sharply increased - will the rate cut come as early as March?
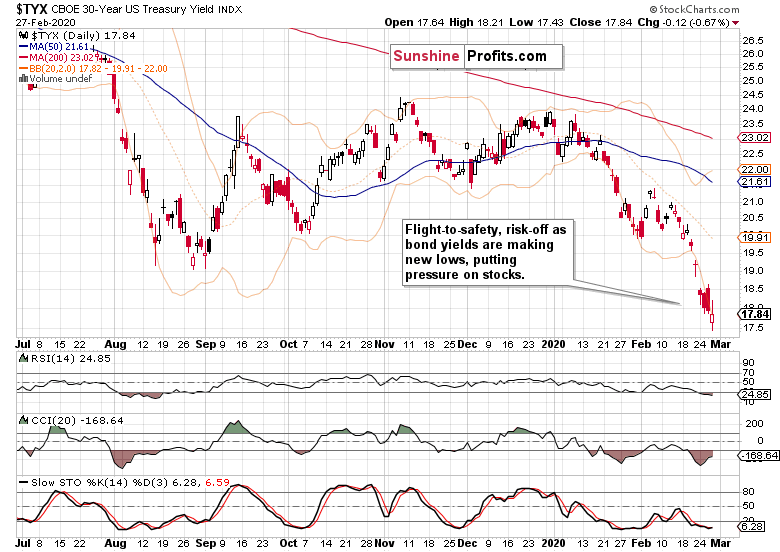
Let's check now how the risk-off trade has been doing since we showed you the US Treasuries and Japanese yen charts yesterday. Is it still hotly pursued as our yesterday's comments have indicated?
Let's start with US Treasuries - the 30-year bond yield has been plunging to new lows. When its yield goes down, it indicated that the demand for safety of US Treasuries is overwhelming the supply. Whenever yield plunges without end in sight, it indicates stress in the system. Little surprise that stocks are taking it on the chin. See for yourself the below chart.
Next, let's examine the key move underway in the Japanese yen. This safe-haven currency also points to the rising risk-off trade appeal:
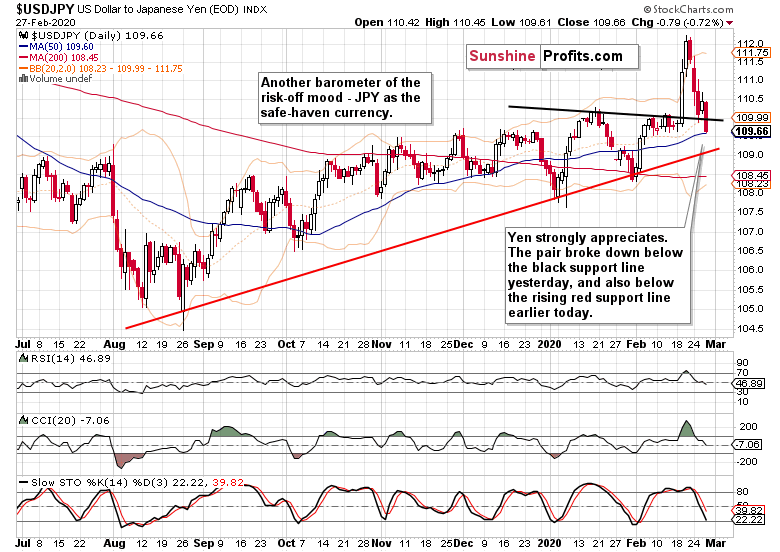
The awaited breakdown below the declining black trend line came already yesterday, and the daily indicators continue favoring more downside. Looking at today's action so far, the rising red trend line has already been broken as the pair trades at around 108.65 currently. Will the 200-day moving average provide an excuse for the bulls to step in?
Both of these charts confirm the downside move in stocks and hint at more to come.
But where is the next support located? The daily chart shows that the lower orange support just below 2850 could be next in line. But is the momentum as strong so as to reach these August and October 2019 lows?
As the S&P 500 futures change hands at around 2925 currently, it appears likely that the bears will show up in force today as well. After all, they annihilated yesterday's 90 point rally within a few short hours. It's not unthinkable they'll repeat the same feat today should another relief rally arrive.
Let's quote our Wednesday's comments:
(...) Unless we see response on par with the People's Bank of China interventions, which would radically change the game, S&P 500 rallies should be viewed with a hefty dose of skepticism.
Therefore, we're of the opinion that a short position is justified from the risk-reward perspective. You can find the details thereof below.
In the current environment, we aim to ride the very likely downswing all the way to the next important support and possibly beyond. Depending on the commitment of the bulls and breaking announcements, we'll manage our open trade accordingly.
Summing up, the medium-term S&P 500 outlook has shifted to bearish, and more downside remains probable before this correction is over both in time in in price. Both the daily and weekly charts attest to that. The divergencies between RSI, CCI and stock prices aren't yet finished being resolved to the downside. The slide continues and all we've been getting, were dead-cat bounces. While the daily volatility is at recent record highs, the weekly one still has a way to go. The failures of the bulls throughout the week favors more downside before the panic selling is over - and we aim to milk it for what it's worth. We've not yet seen a catalyst that would facilitate the reversal higher, and buy-the-dip mentality doesn't seem to be a winning proposition these days. While the stock bull market remains intact in the long term, it appears too early to bet on letting its many long-term bullish factors work to our benefit.
Trading position (short-term; our opinion): short positions at market (100% position size) with stop-loss level at 2985 and the binding take-profit at 2850.
Thank you.
Monica Kingsley
Stock Trading Strategist
Sunshine Profits - Effective Investments through Diligence and Care

