

Briefly:
Intraday trade: Our Monday's intraday outlook was neutral. The S&P 500 index gained 0.8% after opening 0.5% higher. So, basically it was a quite neutral intraday trading action. However, the market broke above its short-term consolidation and got the highest since March 22. Will uptrend accelerate? There is some resistance level ahead. Therefore, we still prefer to be out of the market, avoiding low risk/reward ratio trades.
Medium-term trade: In our opinion, no medium-term positions are justified.
Our intraday outlook is neutral. Our short-term outlook is neutral, and our medium-term outlook is neutral:
Intraday outlook (next 24 hours): neutral
Short-term outlook (next 1-2 weeks): neutral
Medium-term outlook (next 1-3 months): neutral
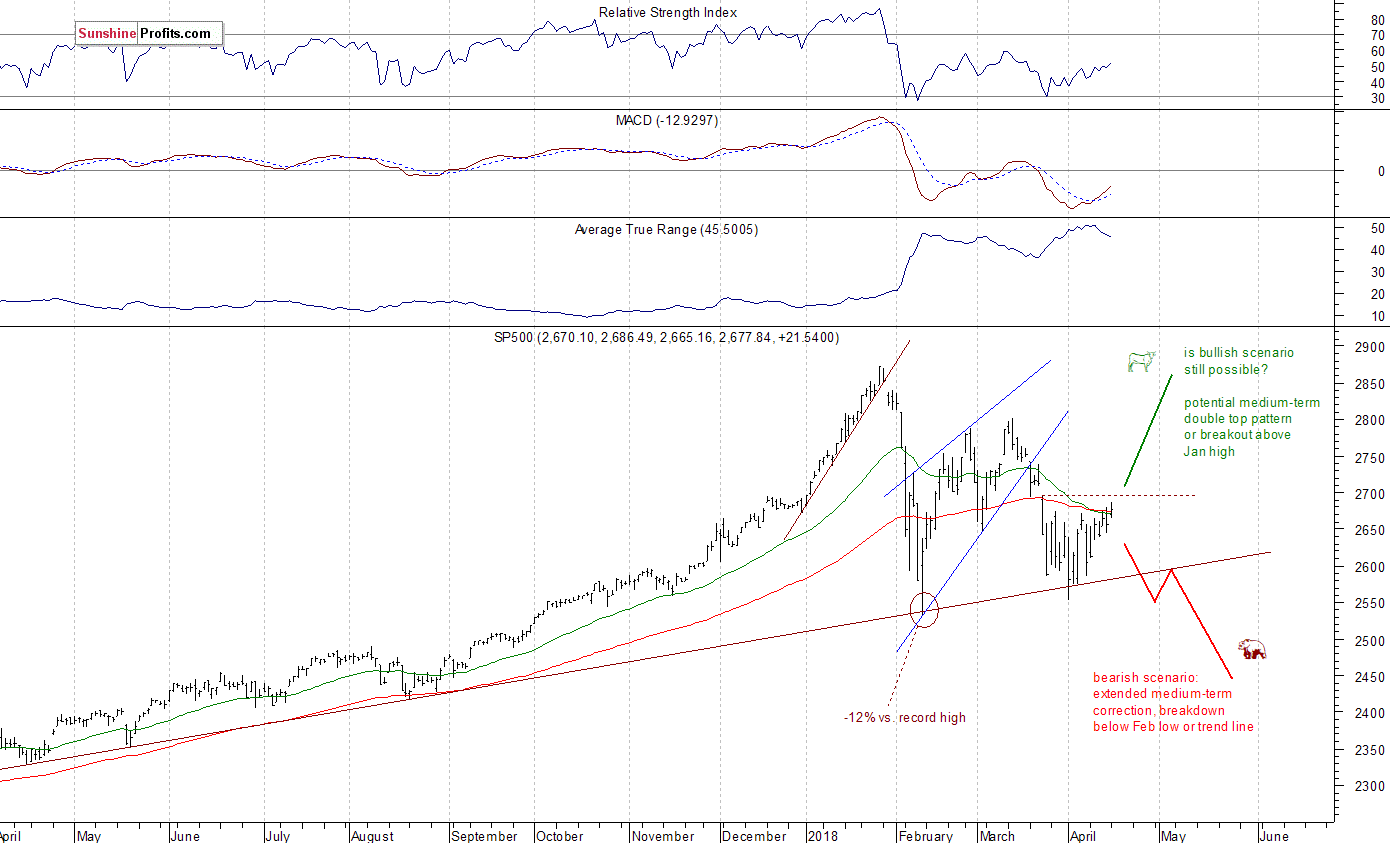
The U.S. stock market indexes gained 0.7-0.8% on Monday, as investors' sentiment improved ahead of quarterly earnings, economic data releases. The market shrugged off worries about Syrian conflict and trade war. The S&P 500 index got the highest since late March and it currently trades 6.8% below its January 26 record high of 2,872.87. The Dow Jones Industrial Average gained 0.8% and the technology Nasdaq Composite gained 0.7% yesterday.
The nearest important level of resistance of the S&P 500 index is at 2,695-2,710, marked by March 22 daily gap down of 2,695.68-2,709.79. The next resistance level is at around 2,740, marked by some March local highs. On the other hand, support level is now at 2,665, marked by yesterday's daily low. The next level of support is at 2,645-2,650, marked by Friday's daily low.
Stocks are in the middle of their over two-month-long consolidation following the early February sell-off. The market keeps bouncing off its year-long medium-term upward trend line, which is currently close to 2,600 mark. Is this a bottoming pattern before another leg higher within the long-term bull market? Or just pause before another wave of selling? So, there are still two possible future scenarios - bearish that will lead us below February low following trend line breakdown, and the bullish one in a form of medium-term double top pattern or breakout towards 3,000 mark. But for now, the S&P 500 index is at the above-mentioned resistance level marked by the late March daily gap down:
Positive Expectations, Breakout Confirmed?
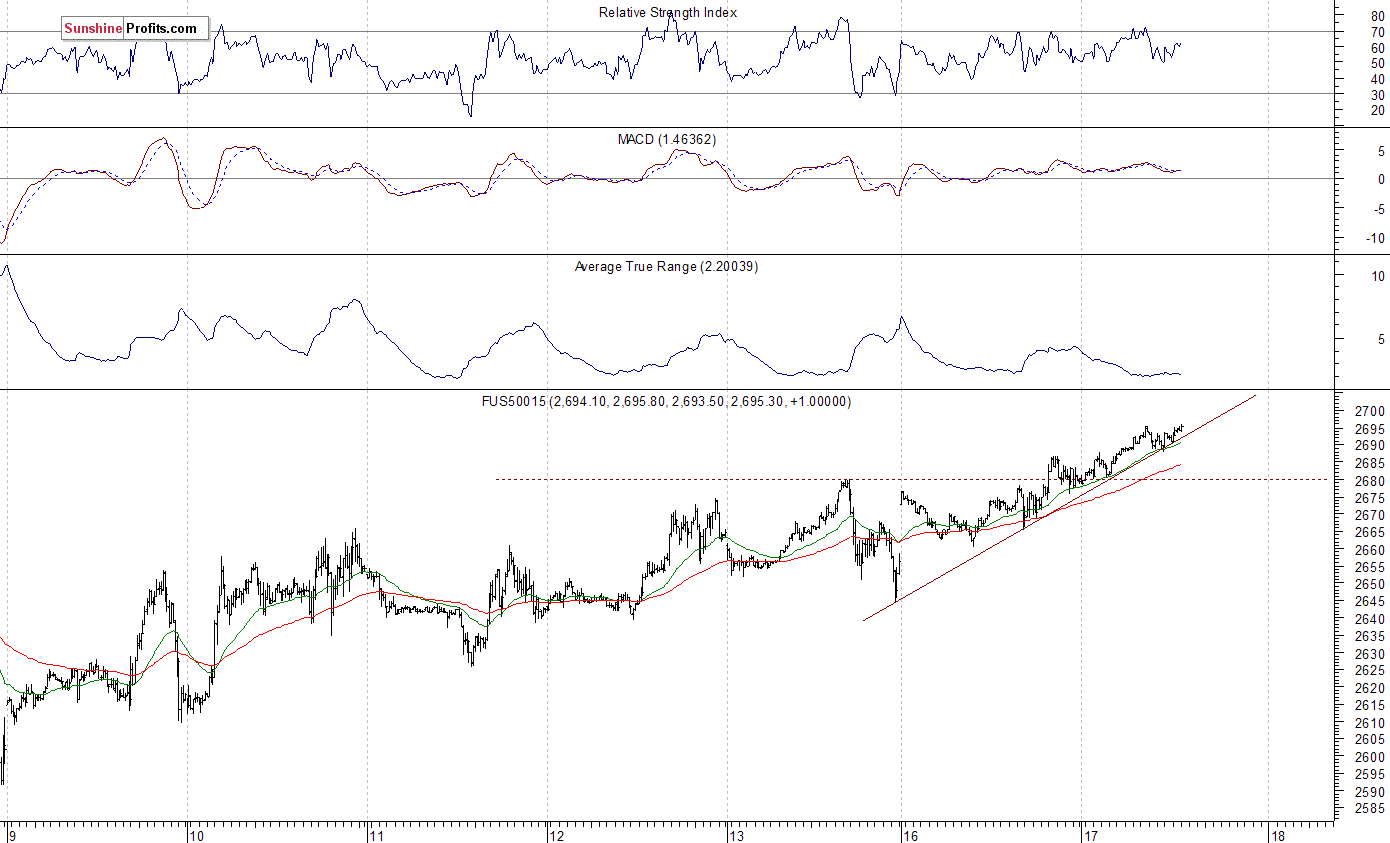
Expectations before the opening of today's trading session are positive, because the index futures contracts trade 0.7-0.8% above their yesterday's closing prices. Investors' sentiment improved following quarterly earnings release from Netflix, among others. The European stock market indexes have gained 0.2-0.9% so far. Will stocks extend their gains after opening higher? The bulls are on the run following yesterday's breakout. So, we may see an attempt at reaching the above-mentioned March 22 gap down resistance level. Investors will wait for some economic data announcements this morning: Housing Starts, Building Permits at 8:30 a.m., Industrial Production, Capacity Utilization at 9:15 a.m. They will also wait for more quarterly earnings releases.
The S&P 500 futures contract trades within an intraday consolidation following an overnight move up. The market extended its yesterday's advance. Potential resistance level is at around 2,695-2,700, marked by previous level of support. The next level of resistance is at 2,720-2,730, among others. On the other hand, support level is now at 2,675-2,680, marked by recent fluctuations. The next level of support remains at 2,660. The futures contract trades along its short-term upward trend line, as we can see on the 15-minute chart:
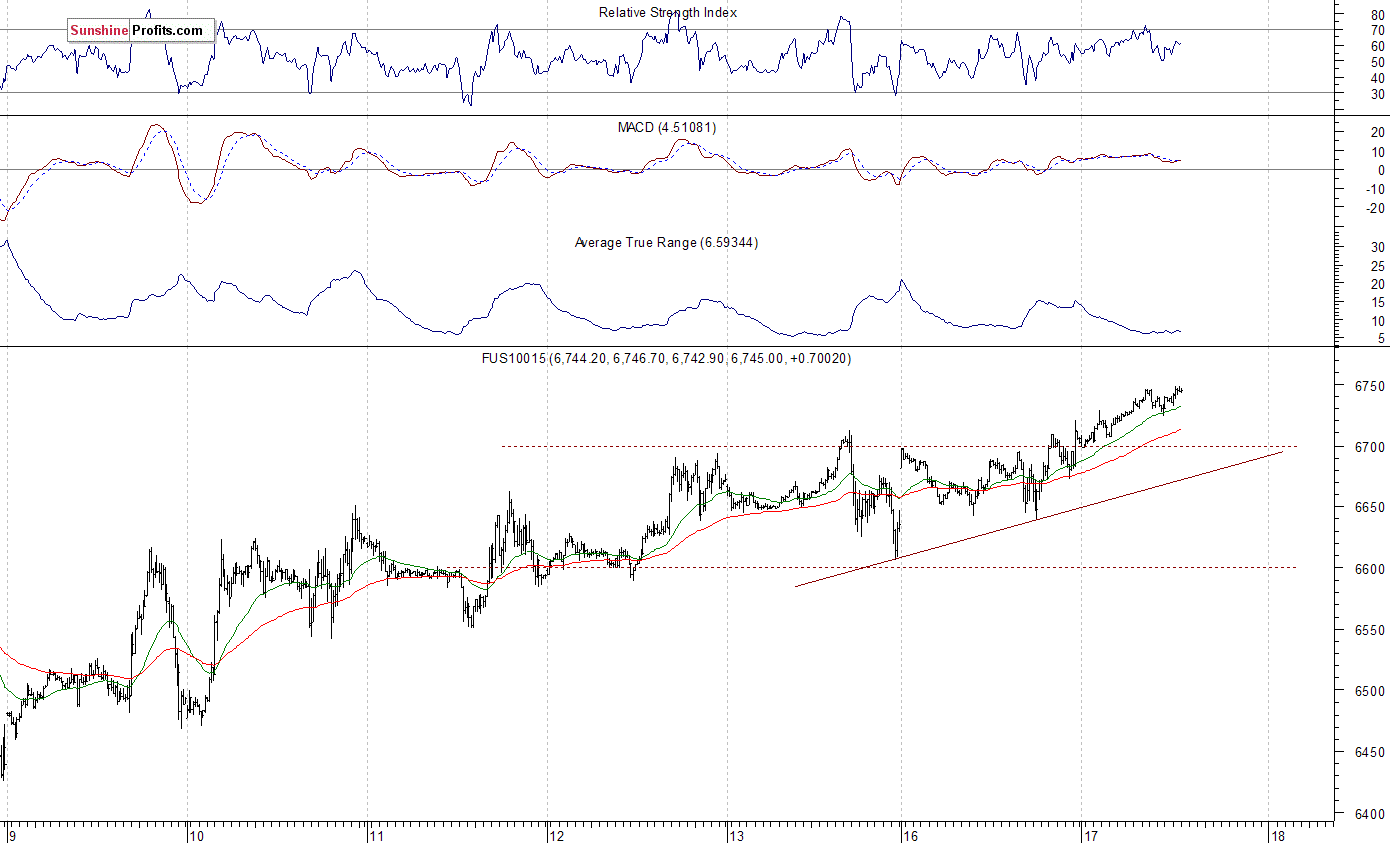
Nasdaq Above 6,700
The technology Nasdaq 100 futures contract follows a similar path, as it fluctuates following overnight move up. The market extended its uptrend after better-than-expected quarterly earnings release from Netflix. It continues higher following breakout above 6,700 mark. Potential resistance level is at around 6780-6,800, marked by some previous fluctuations. On the other hand, support level is at 6,700-6,710, marked by recent resistance level. The Nasdaq futures contract broke above its recent horizontal trading channel, as the 15-minute chart shows:
Big Cap Tech Stocks Driven Higher by Earnings
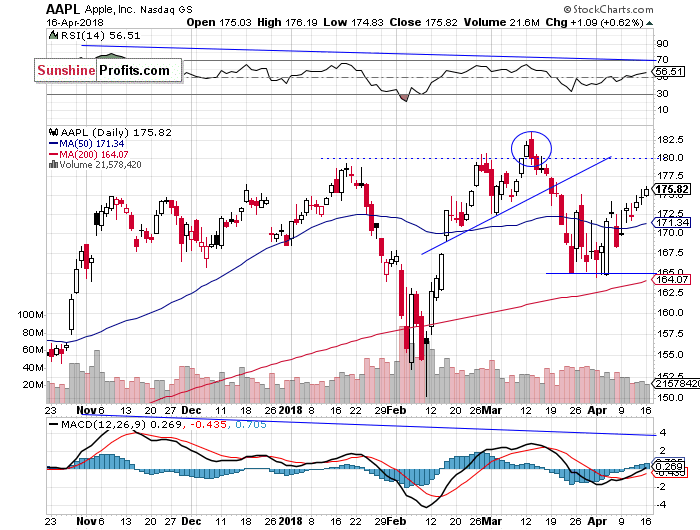
Let's take a look at Apple, Inc. stock (AAPL) daily chart (chart courtesy of http://stockcharts.com). It broke above the resistance level of $175 yesterday, so it continues retracing its March move down. The nearest important level of resistance is at around $180-183, marked by record high. Apple will release its earnings report on May 1 and we may see some kind of "buy the rumor, sell the news" action beforehand. However, there are still medium-term negative technical divergences:
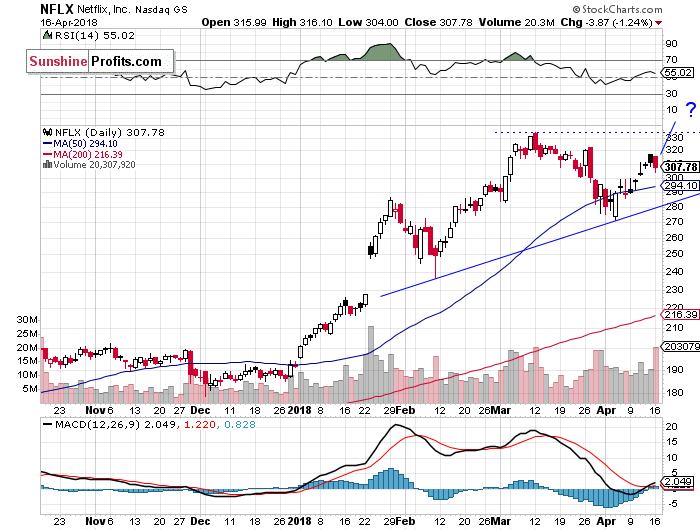
Now let's take a look at Netflix, Inc. (NFLX) daily chart. The company has released its quarterly earnings release yesterday after market close. Investors' reaction was very positive, and we may see an attempt at breaking above March 12 record high of $333.98. However, there could be some short-term profit taking action along the resistance level of $330-$335:
Dow Jones Still at Downward Trend Line
The Dow Jones Industrial Average bounced off its medium-term downward trend line on Friday, but it came back higher yesterday. Will it break above that line? It looks like a possible short-term scenario. The market is trading within a potential level of resistance, marked by the late March daily gap down. For now it looks like an upward correction of a medium-term downtrend after "Harami" upward reversal candlestick pattern formed at the beginning of April:
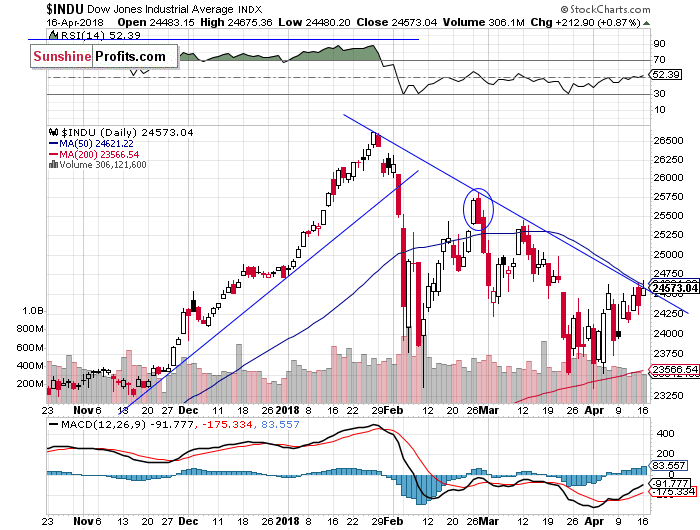
The early March rally failed to continue following monetary policy tightening, trade war fears, among others. What was just profit-taking action, quickly became a meaningful downtrend. Breakdown below over-month-long rising wedge pattern made medium-term bearish case more likely, and after some quick consolidation, the index accelerated towards its early February low. Just like we wrote in our several Stocks Trading Alerts, the early February sell-off set the negative tone for weeks or months to come. However, recent fluctuations looked like some bottoming pattern before an upward reversal. Yesterday's breakout may have confirmed change of trend, but there are some important resistance levels ahead.
Concluding, the S&P 500 index will probably open higher today, following quarterly earnings releases. However, we may see some uncertainty closer to resistance level of the late March daily gap down. It seems that coming quarterly corporate earnings releases outweigh trade war fears, Syrian conflict escalation worries at this moment.
Currently, we prefer to be out of the market, avoiding low risk/reward ratio medium-term trades. We will let you know when we think it is safe to get back in the market.
To summarize: no medium-term positions are justified from the risk/reward perspective at this moment.
Intraday trade:
No intraday position is justified from the risk/reward perspective today.
No medium-term position is justified from the risk/reward perspective at this moment.
Thank you.
Paul Rejczak
Stock Trading Strategist
Stock Trading Alerts

