

Briefly: In our opinion, no speculative positions are justified.
Our intraday outlook is now neutral, and our short-term outlook is neutral. Our medium-term outlook remains neutral, following S&P 500 index breakout above last year's all-time high:
Intraday outlook (next 24 hours): neutral
Short-term outlook (next 1-2 weeks): neutral
Medium-term outlook (next 1-3 months): neutral
Long-term outlook (next year): neutral
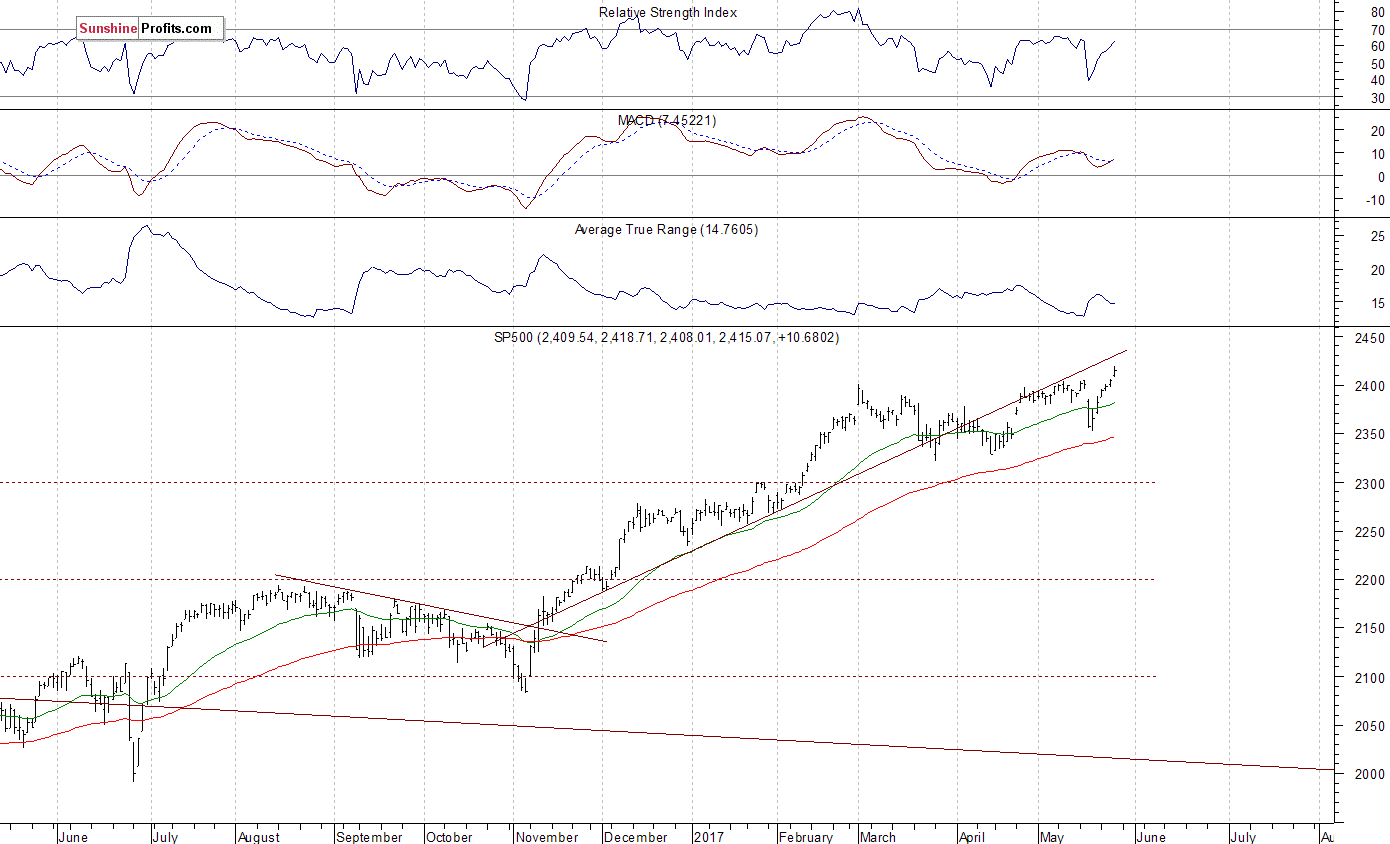
The main U.S. stock market indexes gained between 0.3% and 0.8% on Thursday, extending their short-term uptrend, as investors' sentiment remained bullish following last week's rebound. Investors continued to react to Wednesday's FOMC Meeting Minutes release, among others. The S&P 500 index has reached new all-time high at the level of 2,418.71, as it broke above its May 16 high of 2,405.77. The broad stock market has retraced its whole last week's Wednesday's move down yesterday. The Dow Jones Industrial Average remained above the level of 21,000, however, it failed to reach new record high. The technology Nasdaq Composite continued its rally, as it broke above the level of 6,200 for the first time. The nearest important resistance level of the S&P 500 index is at around 2,415-2,420, marked by new record high. On the other hand, support level is currently at around 2,400-2,410, marked by previous level of resistance, along with yesterday's daily gap up of 2,405.58-2,408.01. The next level of support remains at 2,390-2,395, marked by some short-term local lows. The support level is also at 2,385, marked by local low. Will the uptrend continue towards 2,500 mark? There have been no confirmed negative signals so far. However, we can see some overbought conditions and negative technical divergences. The S&P 500 index continues to trade below its November-April upward trend line, as we can see on the daily chart:
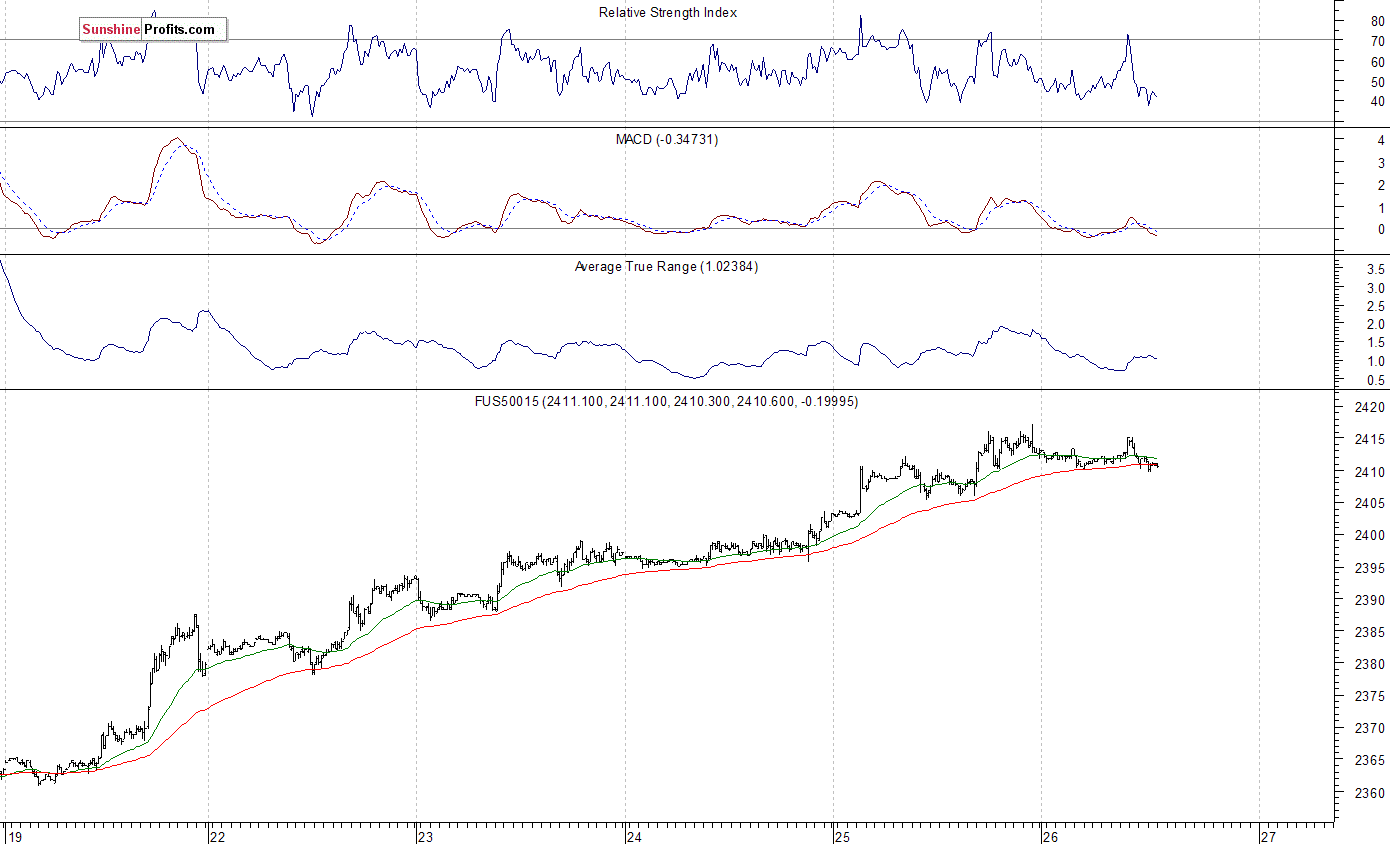
Expectations before the opening of today's trading session are virtually flat, with index futures currently down 0.1%. Investors take some short-term profits off the table following recent rally. The European stock market indexes have been mixed so far. Investors will now wait for series of economic data announcements: GDP Second Estimate, Durable Orders at 8:30 a.m., Michigan Sentiment - Final at 10:00 a.m. The market expects that the U.S. GDP grew 0.9% in last quarter, and the Michigan Sentiment was at 97.6 in May. The S&P 500 futures contract trades within an intraday consolidation, following yesterday's advance. It is currently trading slightly below new record high above the level of 2,417. The nearest important level of resistance is at around 2,415-2,420, marked by that new all-time high. On the other hand, support level is at 2,400-2,405, marked by previous level of resistance. The next important level of support is at 2,390-2,395, marked by recent fluctuations. The market continues to trade within a relatively strong short-term uptrend off last week's Thursday's overnight lows. There have been no confirmed negative signals so far. However, we can see some short-term overbought conditions, along with negative technical divergences:
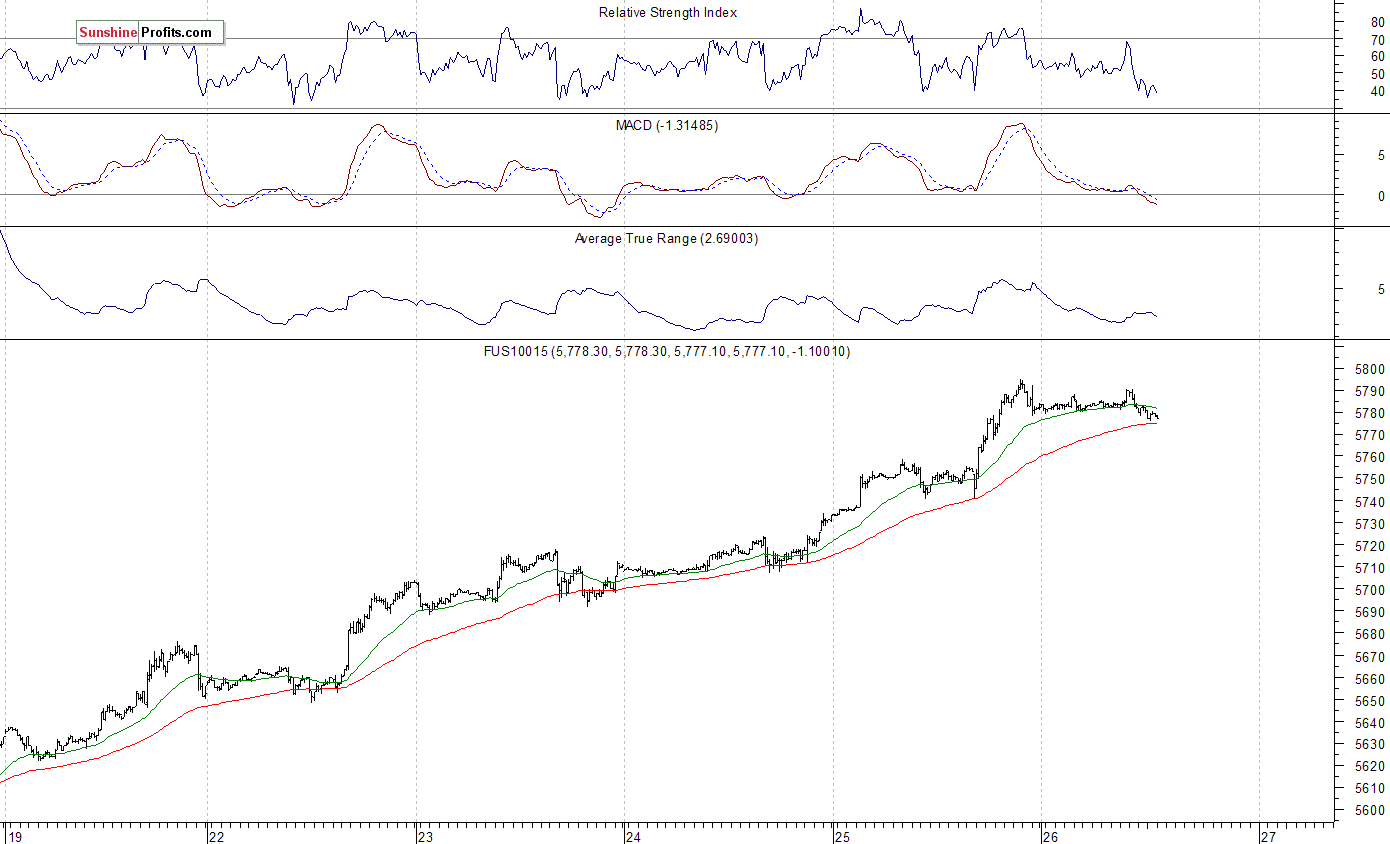
The technology Nasdaq 100 futures contract follows a similar path, as it currently trades within an intraday consolidation along new record high slightly below 5,800 mark. The nearest important level of resistance is at around 5,790-5,800. On the other hand, support level is at 5,740-5,760, marked by yesterday's intraday consolidation. The next level of support is at around 5,700-5,720, marked by previous resistance level, as the 15-minute chart shows:
Concluding, the S&P 500 index broke above its mid-May high yesterday, as the broad stock market gauge extended week-long rally off last week's local low of 2,352.72. It continues over eight-year-long bull market. The index broke above three-month-long medium-term consolidation along the level of 2,400. But will the uptrend accelerate? Or is this some topping pattern before downward reversal? We still can see some negative medium-term technical divergences. However, there have been no confirmed negative signals so far.
Our speculative short position (opened on February 15 at 2,335.58 - opening price of the S&P 500 index) has been closed yesterday overnight, at the stop-loss level of 2,410 - S&P 500 index, as the S&P 500 futures contract broke above the level of 2,407. We lost 74.42 index points on that trade, betting against over year-long medium-term uptrend off last year's February local low. It is always important to set some exit price level in case some events cause the price to move in the unlikely direction. Having safety measures in place helps limit potential losses while letting the gains grow. Currently, we prefer to be out of the market, avoiding low risk/reward ratio trades. We will let you know when we think it is safe to get back in the market.
To summarize: no speculative positions are justified from the risk/reward perspective at this moment.
Thank you.
Paul Rejczak
Stock Trading Strategist
Stock Trading Alerts

