

Briefly: In our opinion, no speculative positions are justified.
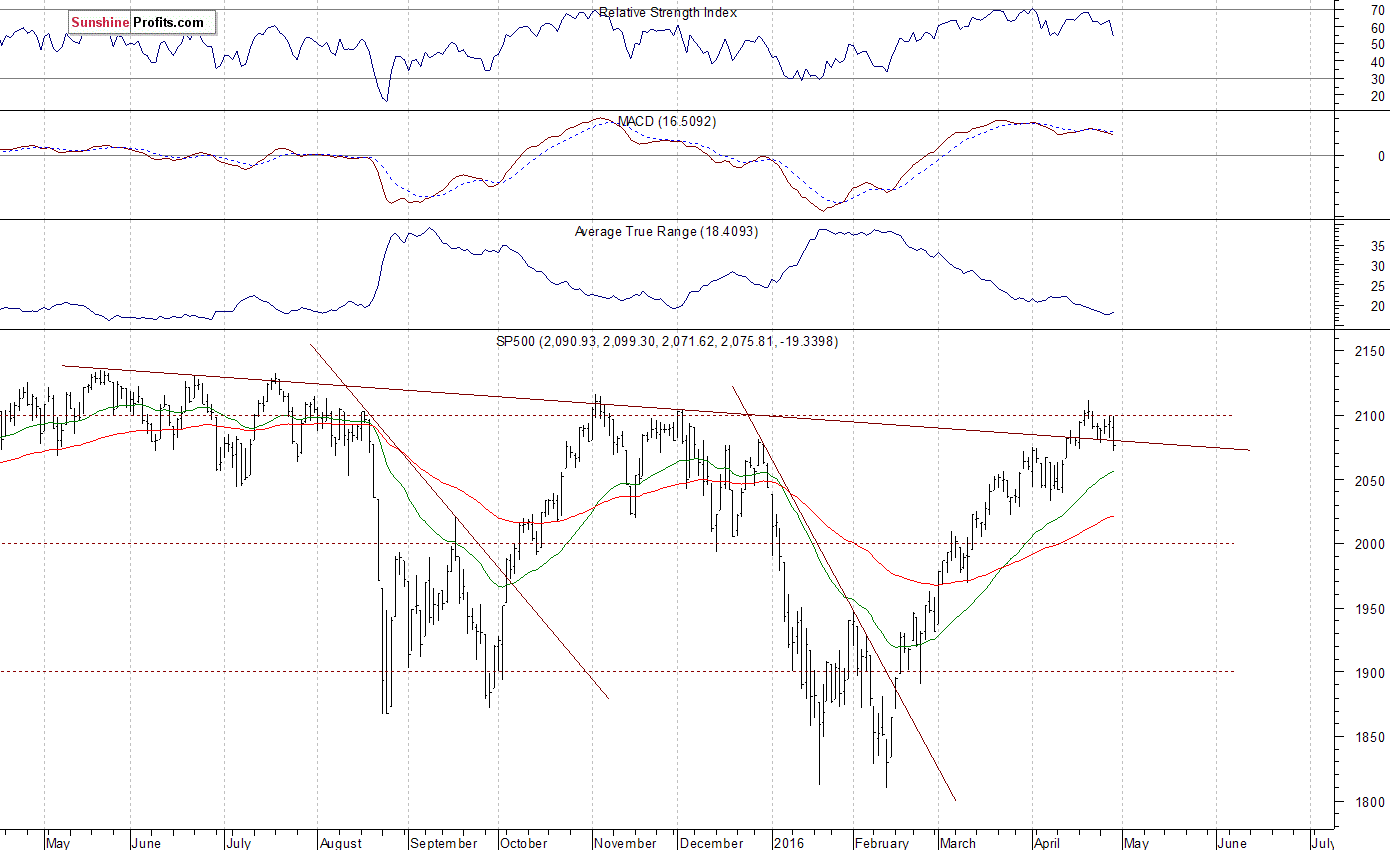
Our intraday outlook is neutral, and our short-term outlook is neutral. Our medium-term outlook remains bearish, as the S&P 500 index extends its lower highs, lower lows sequence:
Intraday outlook (next 24 hours): neutral
Short-term outlook (next 1-2 weeks): neutral
Medium-term outlook (next 1-3 months): bearish
Long-term outlook (next year): neutral
The main U.S. stock market indexes lost 0.9-1.2% on Thursday, breaking below their recent trading range, as investors reacted to economic data, quarterly corporate earnings releases. The S&P 500 index bounced off resistance level at around 2,100, after reaching daily high at 2,099.30. Then, it broke below its nearest support level of 2,075-2,080. The next level of support is at around 2,065, marked by the daily gap up of 2,065.05-2,065.92. On the other hand, resistance level remains at 2,100-2,115, marked by last year's medium-term local highs. The next important level of resistance is at 2,120-2,135, marked by last year's May S&P 500's all-time high of 2,134.72. Is this the end of two-month long uptrend? Or is this just a correction before another leg up reaching last year's all-time high? There have been no confirmed negative signals so far. However, we can some see technical overbought conditions:
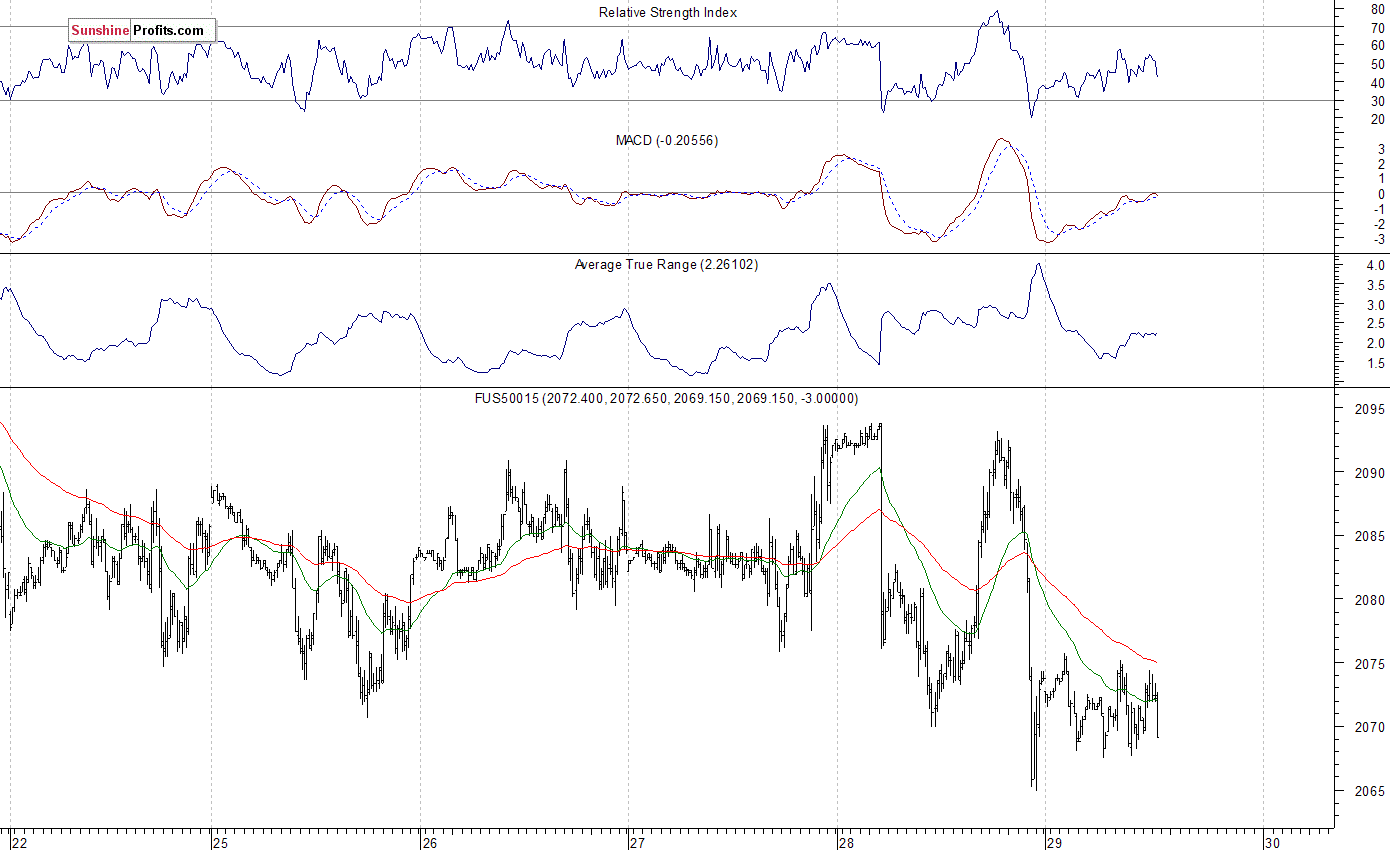
Expectations before the opening of today's trading session are virtually flat. The European stock market indexes have lost 0.9-1.7% so far. Investors will now wait for some economic data announcements: Personal Income, Personal Spending, PCE - Prices, Core PCE - Prices numbers at 8:30 a.m., Chicago PMI at 9:45 a.m., Michigan Sentiment at 10:00 a.m. The S&P 500 futures contract trades within an intraday consolidation, following yesterday's sell-off. The nearest important level of resistance is at around 2,075, and support level is at 2,065, among others. The market remains within a slightly descending short-term trading channel, as we can see on the 15-minute chart:
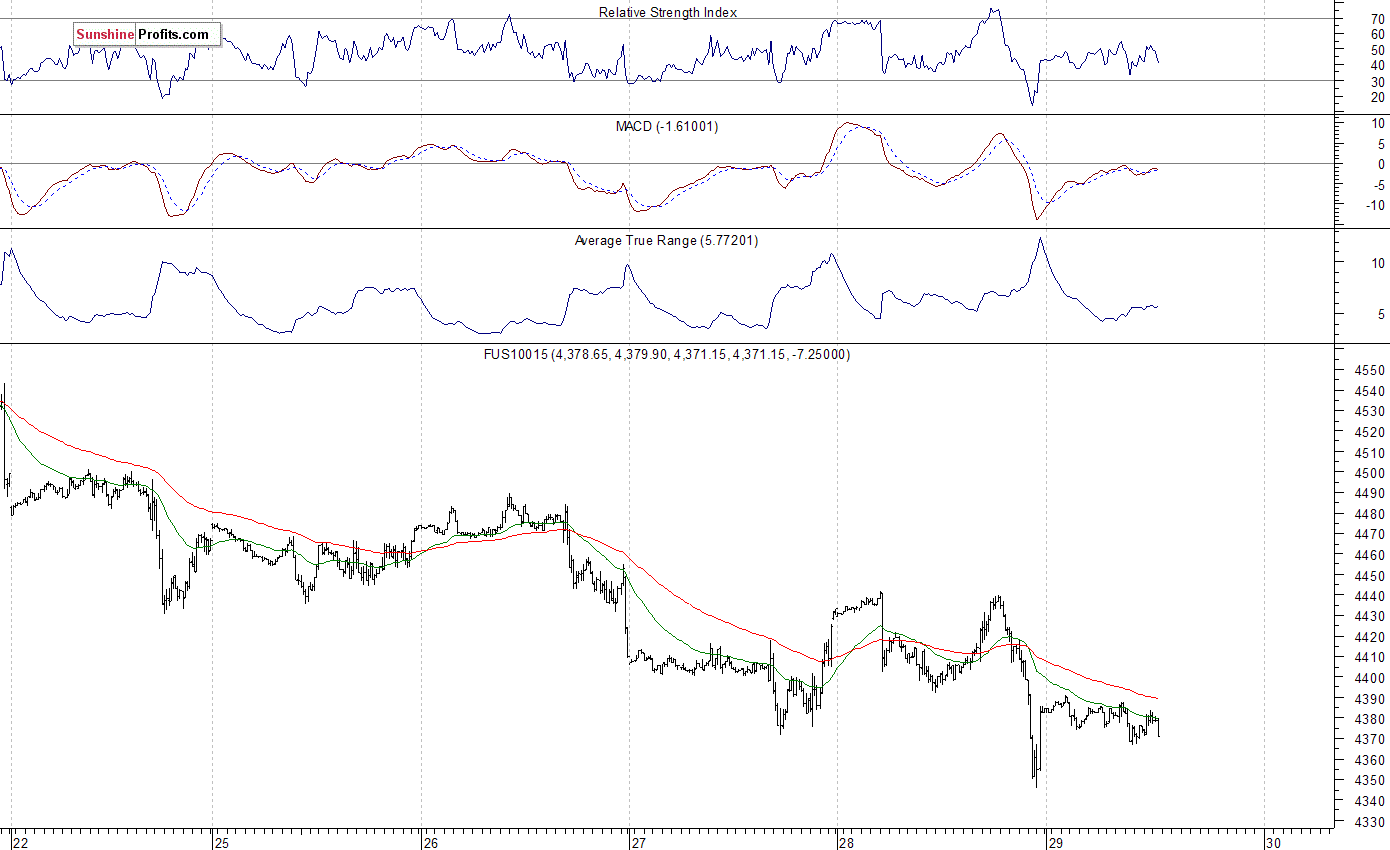
The technology Nasdaq 100 futures contract follows a similar path, as it fluctuates following yesterday's move down. Is this some bottoming action or just an upward correction within a short-term downtrend? The nearest important level of support remains at around 4,350. On the other hand, resistance level is at 4,400, among others, as the 15-minute chart shows:
Concluding, the broad stock market extended its short-term uncertainty on Thursday, as it reached the resistance level of 2,100, before selling off into session's close. Is this a new downtrend or just short-term consolidation? We still can see technical overbought conditions that may lead to uptrend's reversal or downward correction. However, there have been no confirmed short-term negative signals so far. For now, it looks like a flat correction within two-month-long medium-term uptrend. We prefer to be out of the market, avoiding low risk/reward ratio trades. We will let you know when we think it is safe to get back in the market.
Thank you.
Paul Rejczak
Stock Trading Strategist
Stock Trading Alerts

