

Briefly:
Intraday trade: The S&P 500 index lost 1.4% on Thursday after opening 0.2% lower. The broad stock market will probably open slightly higher today. We may see more short-term fluctuations following the recent rebound off the support level.
We still think that the speculative long position in the S&P 500 index is justified from the risk/reward perspective, because the market may have reached the panic bottom of a downward correction on October the 11th.
Trading position (short-term; our opinion): long positions in the S&P 500 index with a stop-loss order of 2,750 and the profit target of 2,890 are justified from the risk/reward perspective.
Our short-term outlook is bullish, and our medium-term outlook is neutral:
Short-term outlook (next 1-2 weeks): bullish
Medium-term outlook (next 1-3 months): neutral
The U.S. stock market indexes lost 1.3-2.1% on Thursday, retracing some of their recent rebound off support levels, as investors' sentiment worsened again. The S&P 500 index is currently 5.9% below its September the 21st record high of 2,940.91. The Dow Jones Industrial Average lost 1.3% and the Nasdaq Composite lost 2.1% on Thursday.
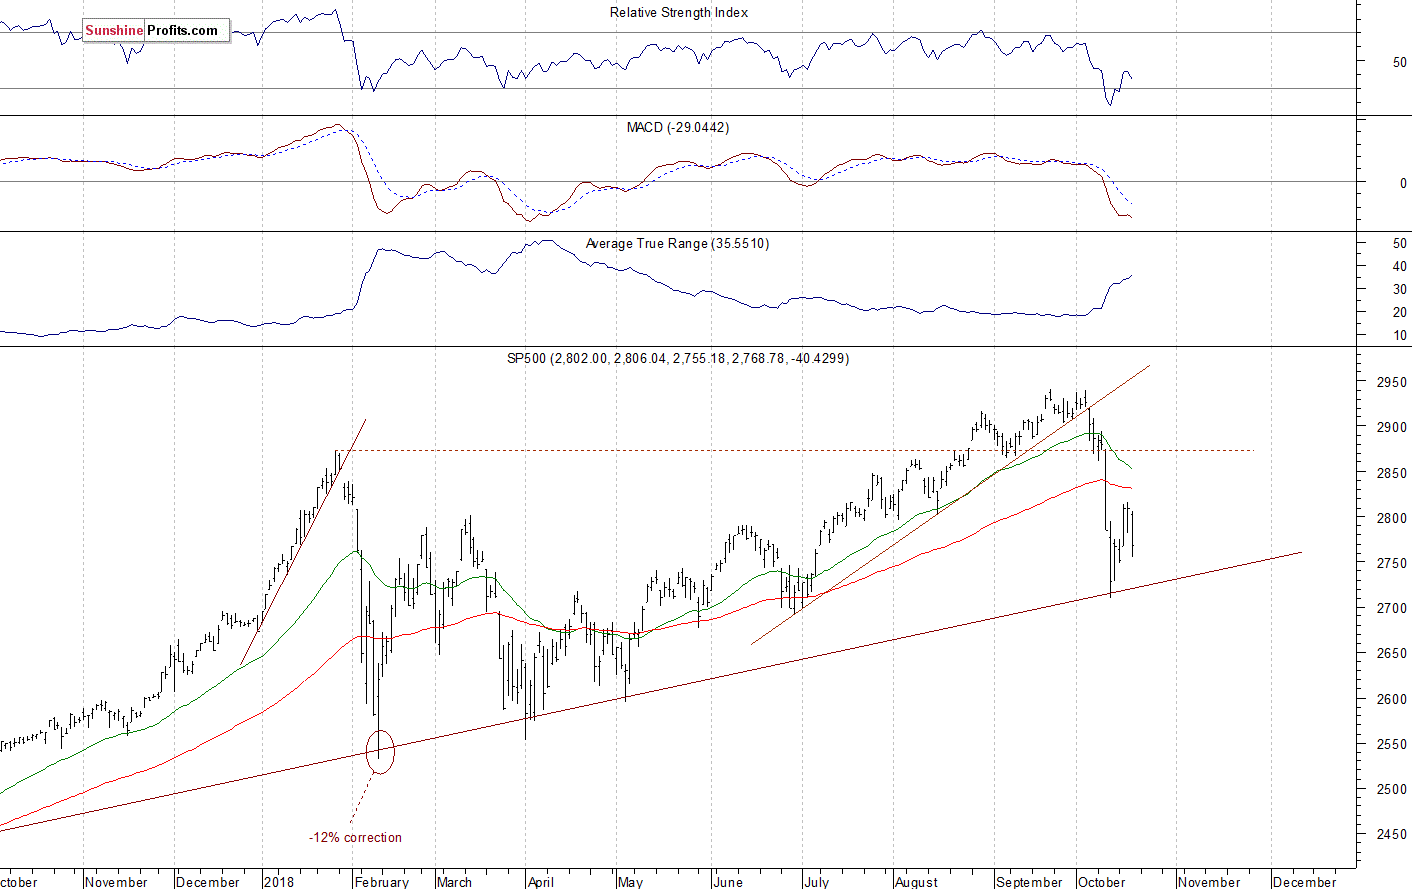
The nearest important level of resistance of the S&P 500 index is now at around 2,780-2,800, marked by the recent fluctuations. The next resistance level is at 2,825-2,830. On the other hand, the nearest important level of support is at 2,750, marked by Monday's daily low. The support level is also at 2,710-2,730, marked by last week' s low and the long-term trend line.
The broad stock market continued retracing its medium-term advance last week, as it got closer to 2,700 mark. Then it bounced on Friday, retracing some of the decline. On Tuesday the index broke above the resistance level of around 2,800. On Wednesday we saw a short-term consolidation. Then stocks sold off again yesterday. Will the market resume its downtrend and break below the long-term trend line? The support level remains slightly above 2,700 mark:
Short-term Fluctuations
Expectations before the opening of today's trading session are slightly positive, because the index futures contracts trade between +0.2% and +0.3% vs. their yesterday's closing prices. The European stock market indexes have been mixed so far. Investors will wait for the Existing Home Sales number release at 10:00 a.m. The broad stock market will likely fluctuate following its yesterday's decline. For now, it looks like a consolidation following last week's sell-off. If the S&P 500 breaks below the support level of 2,700, we could see more selling pressure.
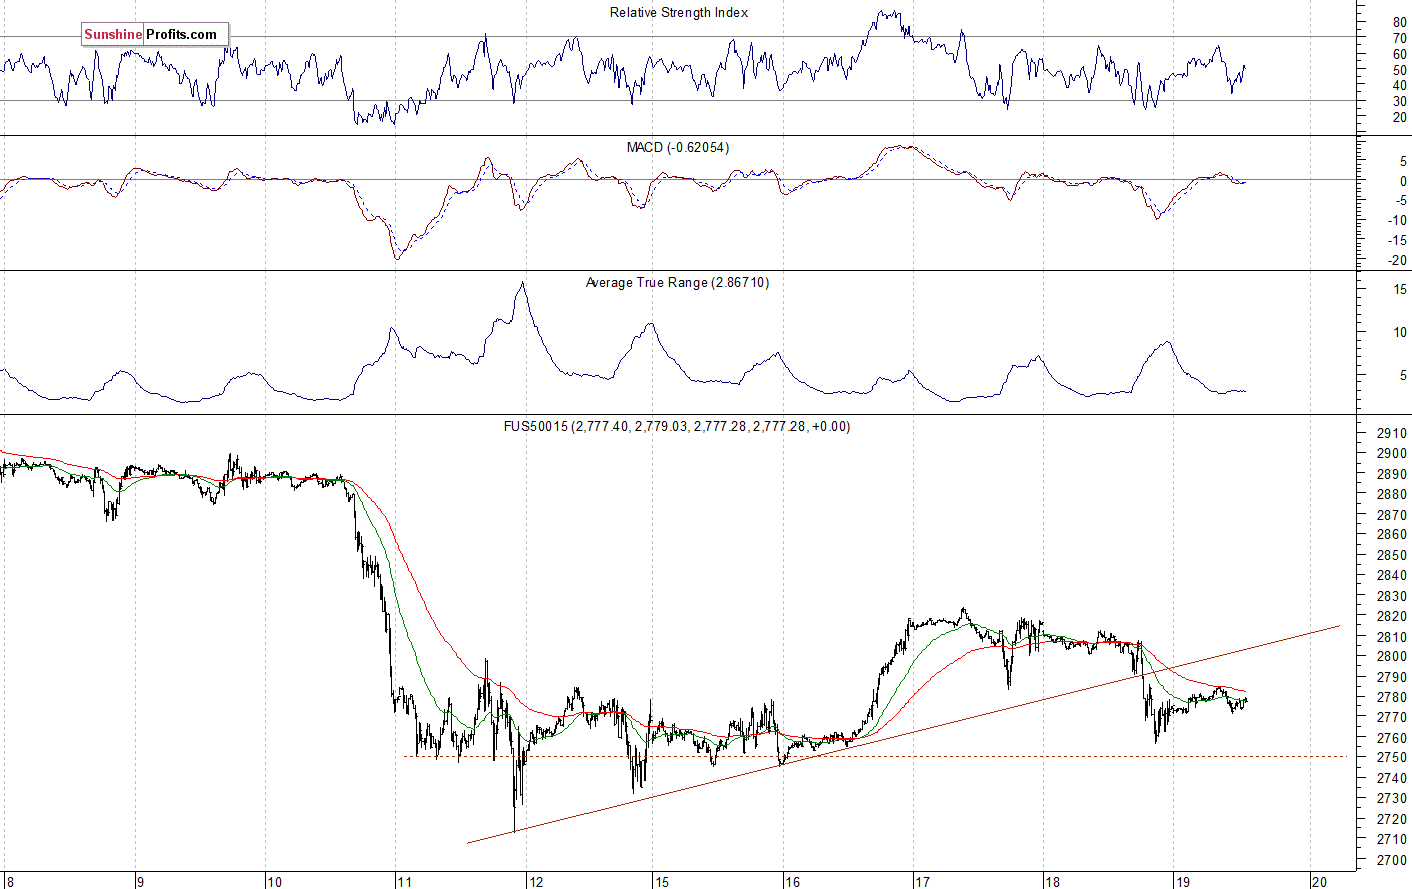
The S&P 500 futures contract trades within an intraday consolidation, as it fluctuates after the yesterday's decline. The nearest important level of resistance is at around 2,785-2,800. On the other hand, the support level is now at 2,755-2,760, marked by the local low. The futures contract trades below its recent short-term upward trend line, as we can see on the 15-minute chart:
Nasdaq Lower Again
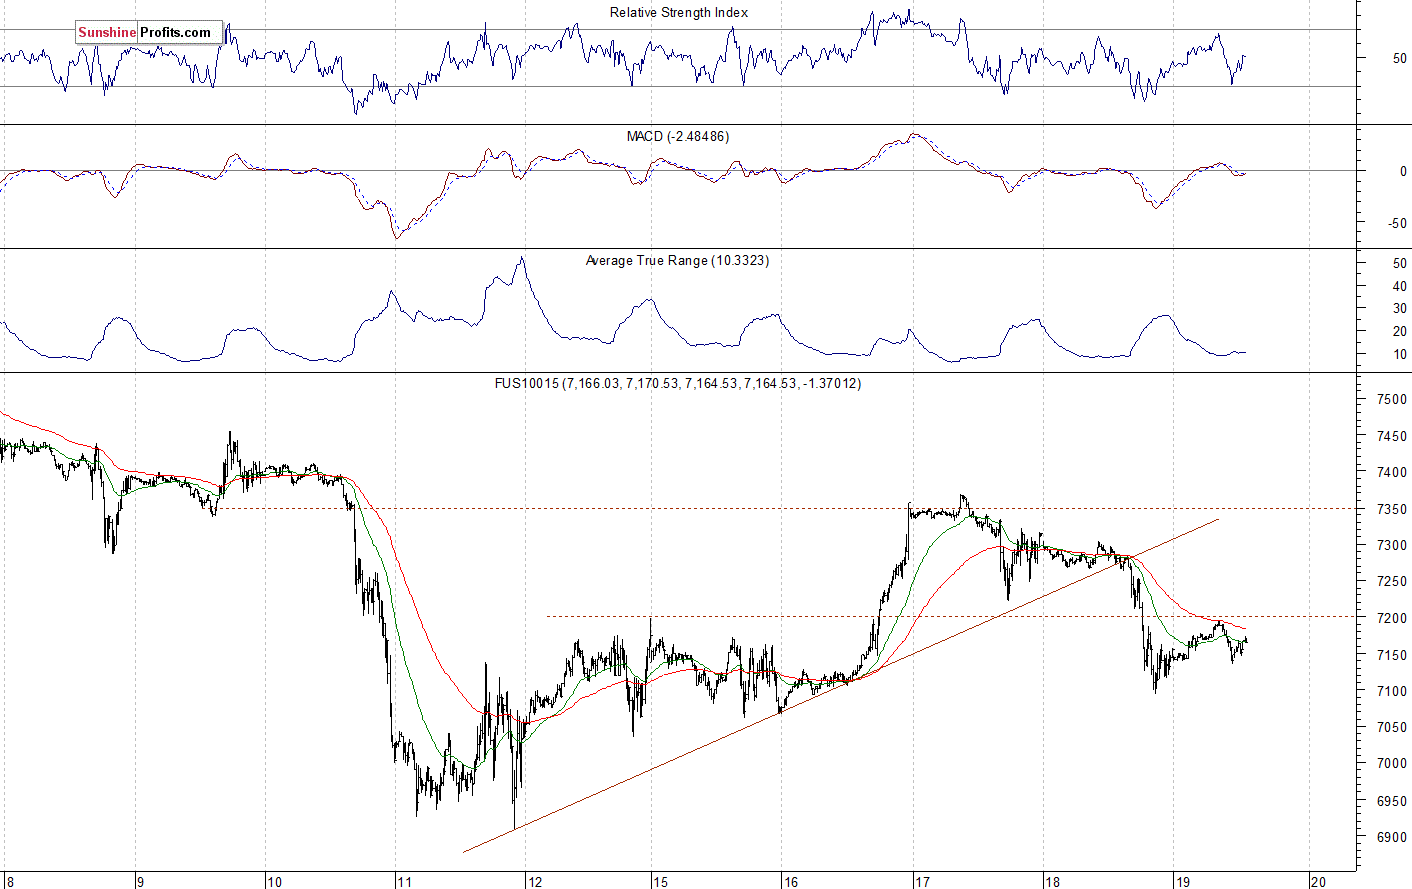
The technology Nasdaq 100 futures contract follows a similar path, as it fluctuates following yesterday's sell-off. The tech stocks' gauge broke below 7,000 mark recently, and it traded closer to the level of 6,900 on Thursday. So it fell over 800 points off its October the 1st record high above the level of 7,700. On Tuesday it bounced back above 7,350 mark. But then it fell below 7,100 again. We could see more short-term volatility. The nearest important level of resistance is now at around 7,200, marked by the local high. On the other hand, the support level is at 7,050-7,100. The Nasdaq futures contract got back to its Friday's-Tuesday's trading range, as the 15-minute chart shows:
Apple, Amazon - Uncertainty Ahead of Earnings Releases
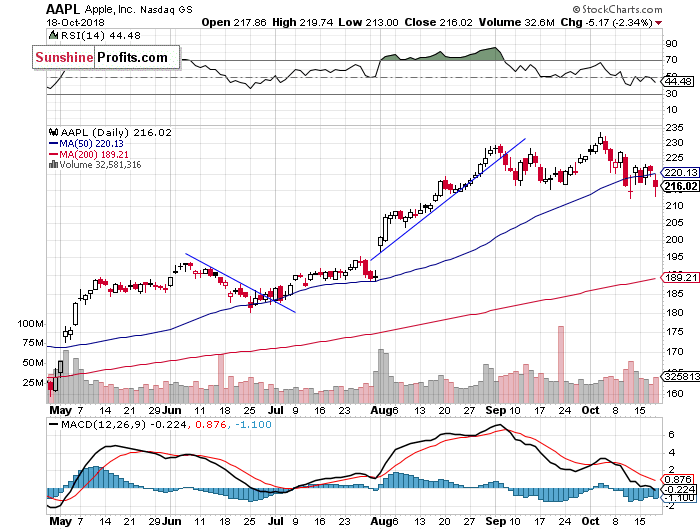
Let's take a look at Apple, Inc. stock (AAPL) daily chart (chart courtesy of http://stockcharts.com). It reached the new record high at the level of $233.47 in the early October, as it continued to act relatively strong. Then the stock retraced its rally. Apple trades within an almost two-month-long consolidation, and the support level remains at around $215:
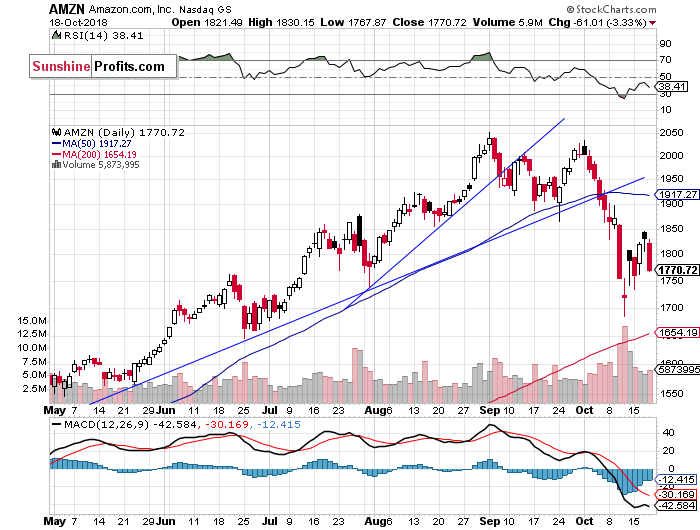
Now let's take a look at Amazon.com, Inc. stock (AMZN) daily chart. It traded within a clear short-term downtrend following breaking down below its upward trend lines last week. The downtrend accelerated on Wednesday, and the stock continued lower on Thursday. On Friday we wrote that "we can see an attempt at bouncing off the support level of around $1,700" And the stock did bounce off the support level. For now, it looks like an upward correction, as the price gets back lower:
Dow Jones Also Lower
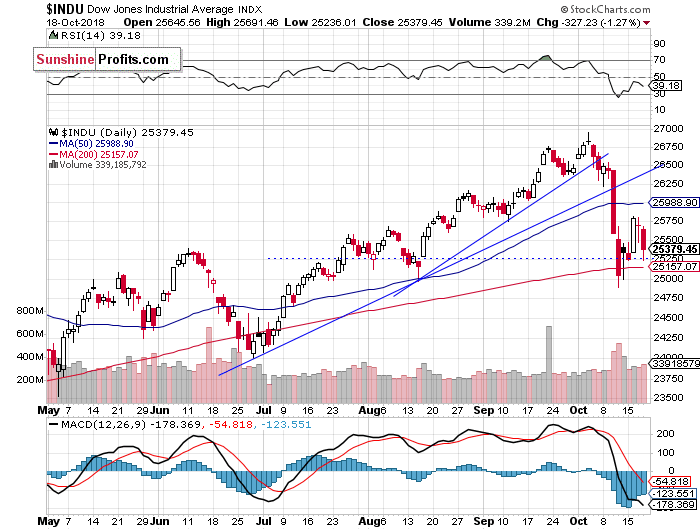
The Dow Jones Industrial Average reached its new all-time high at the level of 26,951.81 on October the 3rd. Then the blue-chip stocks' gauge broke below its medium-term upward trend lines and the support level of around 26,000. And then it accelerated lower. On Friday the market bounced off the support level of around 25,000. The index continued upwards on Tuesday, but it bounced off the resistance level of 26,000 yesterday:
The S&P 500 index sold off last week, following breaking down below its early September local lows. The market sharply reversed its medium-term uptrend. Then it fell closer to 2,700 mark on Thursday. Since then it retraced some of the decline. Yesterday trading session brought the medium-term sell-off fears again. For now, it looks like a consolidation following the last week's decline.
Concluding, the S&P 500 index will probably open slighlty higher today. The market trades within a short-term consolidation following the recent sell-off. We may see more volatility ahead.
Trading position (short-term; our opinion): long positions in the S&P 500 Index with a stop-loss order at 2,750 and the profit target of 2,890 are justified from the risk/reward perspective.
Thank you.
Paul Rejczak
Stock Trading Strategist
Stock Trading Alerts

