

As the NFP jobs number missed expectations of 645K-665K, with a print of only 559K, the equity indices jumped higher. What gives?
This lower print could be a prelude to the next Fed meeting, which happens on June 15-16. Weak job growth could give the Federal Reserve a reason to continue with the "lower for longer" theme and more dovish signals. The Ten-Year note yield moved lower on Friday off the jobs data, while the Nasdaq surged. Tech has been moving inversely to bond yields at a decent correlation in recent months and could be a sign of things to come.
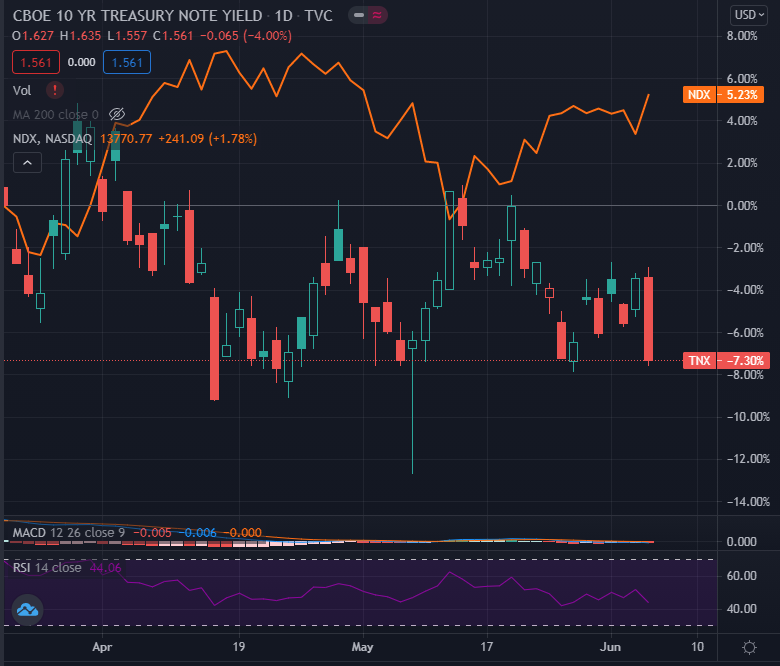
Figure 1 - $TNX 10-Year Note Yield (candlesticks) compared to $NDX Nasdaq 100 Index (sold red line) -March 23, 2021, - June 4, 2021, Source tradingview.com
Above, we can see the mostly negative correlation between the $TNX 10-Year Note yield (candlesticks) and the $NDX Nasdaq 100 Index (red line).
The Nasdaq 100 led all indices on Friday, tacking on 1.78%, while the 10-Year Note yield lost 4.00%, to settle at 1.561%. There is a Fed meeting approaching, and with the other major indices settling close to all-time highs on Friday, a breakout to the upside in the major indices could lead to lower yields. Will the weak jobs number be the Fed’s fundamental catalyst to more dovish inclinations?
The possibility exists.
Review of Our Latest ETF Picks
Now that the big jobs number is out of the way, and since we have covered so much during the month of May and into early June, I thought it would be an opportune time to recap some of the existing markets that we are following in greater depth. Let’s jump right in:
- (GRID) First Trust NASDAQ Clean Edge Smart Grid Infrastructure Index Fund. GRID analysis was first introduced in the May 6. 2021 publication with an idea buy level between $86.91 and $88.17.
The idea level was traded through between May 11 - May 13. GRID settled on Friday, June 4, at $91.64.
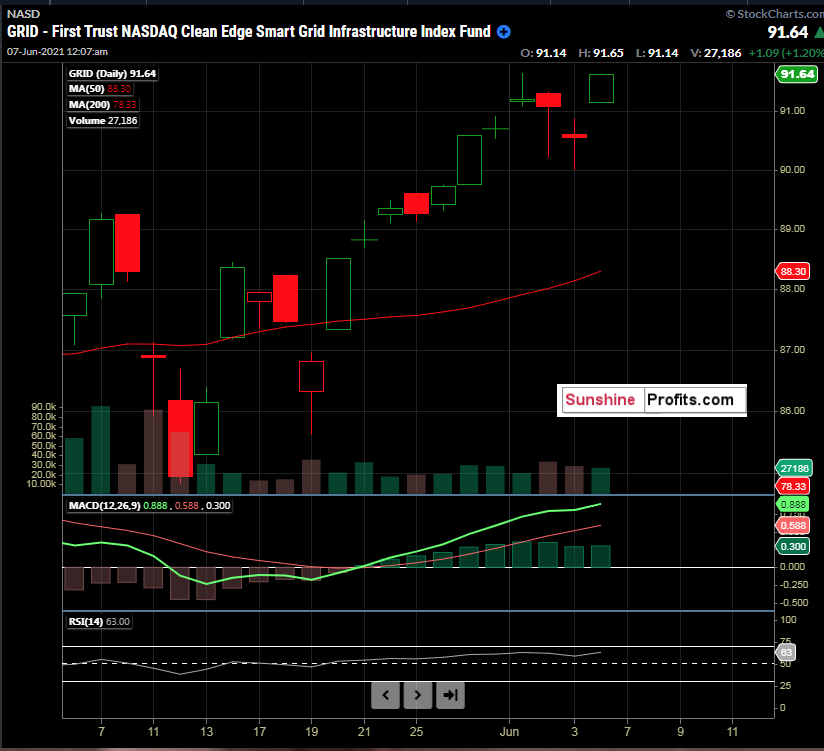 Figure 2 - First Trust NASDAQ Clean Edge Smart Grid Infrastructure Index Fund (GRID) Daily Candles May 6, 2021 - June 4, 2021. Source stockcharts.com
Shorter-term traders could have used the old 52-week high as an exit ($90.96) as mentioned in the May 6. 2021 publication. However, I continue to like this name given the infrastructure bill and will keep readers apprised of daily overbought technical levels and other ideas for exits in upcoming publications.
2. (ERTH) Invesco MSCI Sustainable Future ETF. ERTH analysis was first introduced in the May 10. 2021 publication with an idea buy level between the 200-day moving average and a key 61.8% retracement level. On May 10th, these levels were $67.76 - $68.49.
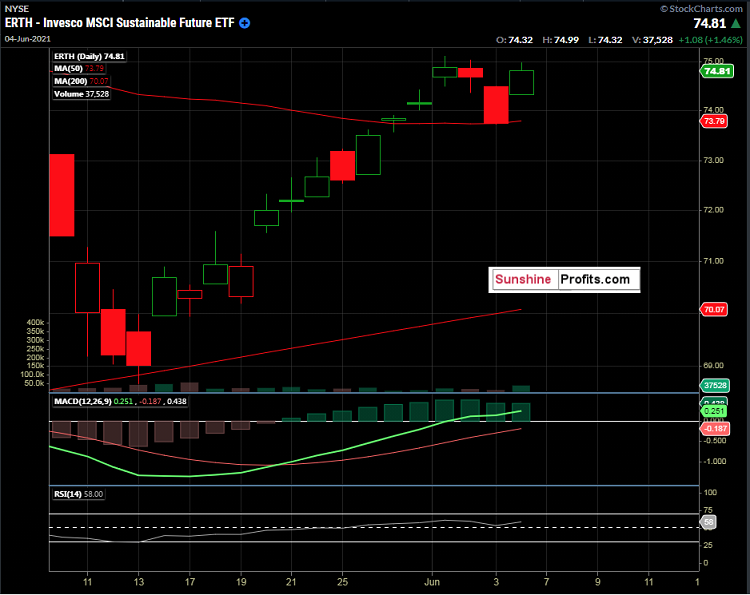
Figure 3 - Invesco MSCI Sustainable Future ETF (ERTH) Daily Candles May 10, 2021 - June 4, 2021 Source stockcharts.com
ERTH traded to its 200-day moving average on May 13, 2021; albeit briefly (see above). ERTH settled on Friday, June 4, at $74.81.
3. In the May 11, 2021 publication, we explored the 10-Year note yield. On that day, the June contract (ZNM2021) was the front-month and active contract. Since then, the contract roll has occurred, and September is now the active contract. The outlook on May 11, was for potentially higher yields, and lower prices. The idea zone to sell the June 10-year notes (ZNM2021) was 132'22 - 132'24'5 with a tight stop in the May 11th publication. We also revisited the idea on May 20th.
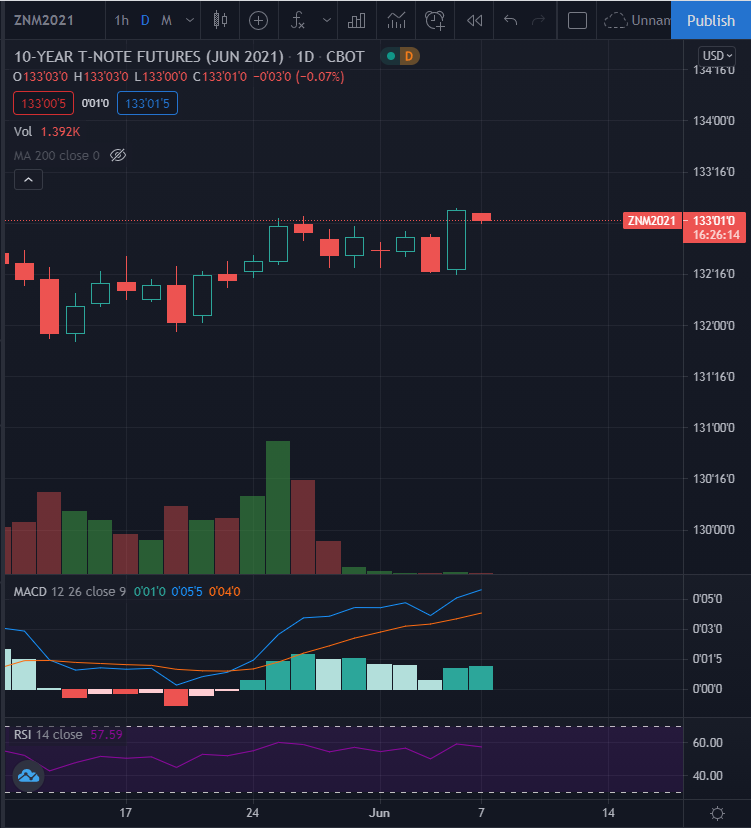
Figure 4 - June 10-Year notes May 11, 2021 - June 7, 2021, 12:40 AM ET Daily Candles Source tradingview.com
10-year notes had remained largely rangebound until Friday’s NFP jobs number and then moved higher off the data. Given the upcoming Fed meeting on June 15-16, and the move higher in the 10 Year note futures (lower $TNX yields) on Friday, my inclination is to be out of the 10-year notes at this time. Should equities move higher and rates lower, it would not be wise to be short the 10-year notes. Time will tell, but for me, I think there are other better places to be right now.
4. On May 25th, we discussed automation, artificial intelligence, and QTUM - Defiance Quantum ETF with a long entry idea between $44.00 - $47.25 (50-day moving average). It traded in this zone on May 25th, with a low of $47.05 and the next day (May 26th) made an intraday low of $47.21. QTUM closed on Friday, June 4, at $49.00.
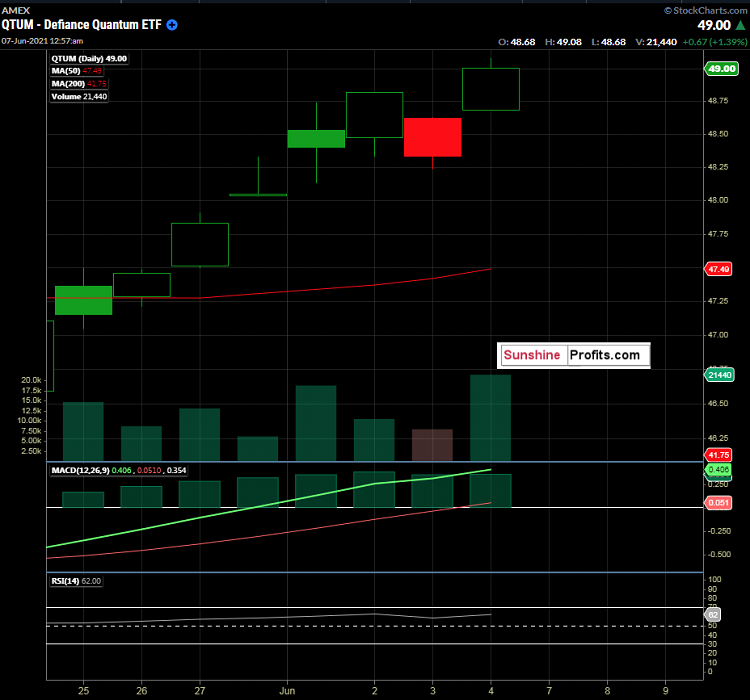
Figure 5 - QTUM Defiance Quantum ETF Daily Candles May 25, 2021 - June 4, 2021. Source stockcharts.com
5. In our May 27th publication, we examined the Russell Index reconstitution. It is a very curious yearly phenomenon that results in a newly balanced index on June 28th, 2021. We focused on the Russell 2000 Index via the IWM. IWM closed at $225.65 on May 27th and settled at $227.40 on Friday, June 4th.
Let’s also keep in mind that we have CPI data coming out this Thursday, June 10, at 8:30 AM ET.
To sum up the current viewpoint and opinion:
I have BUY opinions for:
- iShares Trust Russell 2000 ETF (IWM) for an index reconstitution trade. At this time, I would be looking to be long and then exiting upon the actual reconstituted index going into place on June 28, 2021. Buy the rumor, sell the fact type of trade. Buy Pullbacks. For equity-bearish folks, see the IWM/SPY spread idea in the May 27th publication. Always use a stop loss level that caters to your individual risk tolerance.
- Update 06/07: I like the idea of being long the IWM until June 28, 2021 (when the newly reconstituted index debuts).
- Defiance Quantum ETF (QTUM) between $44.00 - $47.25. Always use a stop loss level that caters to your individual risk tolerance.
- Amplify Transformational Data Sharing ETF (BLOK) between $37.68 - $37.91. BLOK has a history of high volatility, so proceed with caution. Always use a stop loss level that caters to your individual risk tolerance. Update 06/07: Still on the radar, but hasn’t pulled back to the 200-day moving average level yet (currently $38.86 as of 06/04 close). Always use a stop loss level that caters to your individual risk tolerance.
- Invesco MSCI Sustainable Future ETF (ERTH) between $67.76 - $70.82. Always use a stop loss level that caters to your individual risk tolerance.
I have SELL opinions for:
- Invesco DB Commodity Index Tracking Fund (DBC) $18.50 - $18.75. Target 17.50 (old highs) to $17.75. Always use a stop loss level that caters to your individual risk tolerance. Use caution if you are trying this trade, knowing that the DXY could capitulate. See the May 19th publication for more details. Update 06/07: There is CPI data coming out on June 10th. DBC has continued higher with the inflationary theme. However, it has put in doji looking reversal daily candles on several occasions last week. I would be looking to exit this trade ahead of Thursday’s CPI data (8:30 AM ET). So, if short, consider exiting Monday, Tuesday, or Wednesday. If there is another big CPI inflationary print, I would not want to be short DBC.
I have a HOLD opinion for:
- First Trust NASDAQ Clean Edge Smart Grid Infrastructure Index Fund (GRID). GRID has traded through our idea range of between $86.91 and $88.17. I do not encourage chasing it, if not already long, in my opinion. Update 06/07: Short-term traders could exit at the old 52-week high of $90.96. I like this name for a longer-term play given the infrastructure bill and will keep monitoring for overbought clues. Always use a stop loss level that caters to your individual risk tolerance.
Wishing you a great week ahead!
Thank you,
Rafael Zorabedian
Stock Trading Strategist

