

Briefly:
Intraday trade: Our Tuesday's intraday trading outlook was bearish. It proved wrong because the S&P 500 index gained 0.1%, following neutral opening of the trading session. The index traded within a relatively narrow intraday trading range once again. The market may retrace some of its recent rally. Therefore, intraday short position is favored. Stop-loss is at the level of 2,575 and potential profit target is at 2,540 (S&P 500 index).
Medium-term trade: In our opinion, no medium-term positions are justified.
Our intraday outlook is bearish today. Our short-term outlook is neutral, and our medium-term outlook is neutral:
Intraday outlook (next 24 hours): bearish
Short-term outlook (next 1-2 weeks): neutral
Medium-term outlook (next 1-3 months): neutral
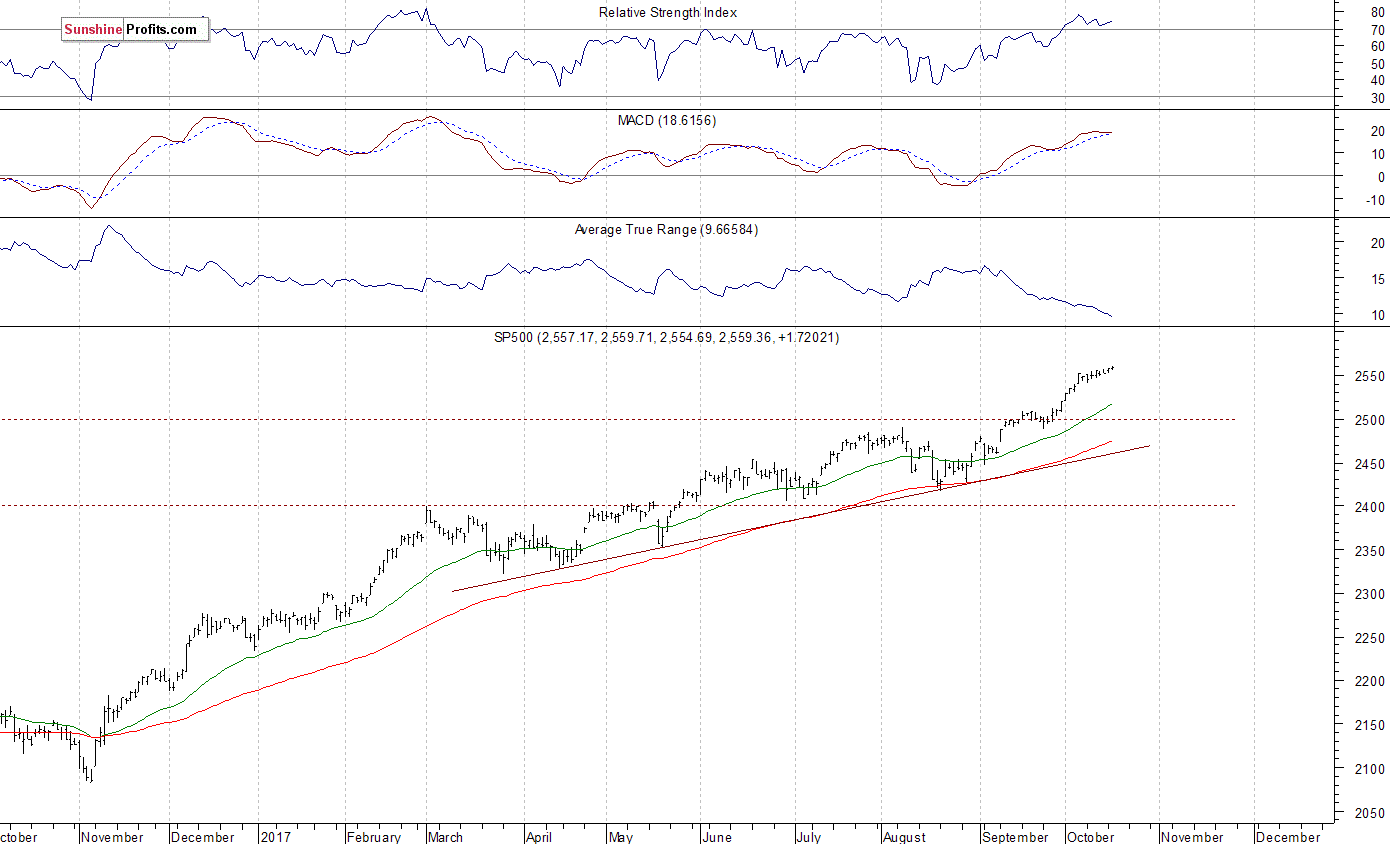
The U.S. stock market indexes were mixed between 0.0% and +0.2% on Tuesday, as they fluctuated along new record highs following economic data, quarterly earnings releases. The S&P 500 index has reached yet another new record high at the level of 2,559.71, around half of a point above its Monday's high. The Dow Jones Industrial Average reached new record high at the level of 22,302.20, as it gained 0.2%. The technology Nasdaq Composite remained slightly below its Friday's record high of 6632.50. The nearest important level of support of the S&P 500 index remains at around 2,550, marked by previous resistance level. The next support level is at 2,540, marked by recent fluctuations. The support level is also at 2,520-2,530, marked by previous daily gap up of 2,519.44-2,520.40 and short-term local lows. On the other hand, resistance level is at around 2,560, marked by the above-mentioned new all-time high. The S&P 500 index extends its uptrend, as it slowly climbs higher. We still can see medium-term negative technical divergences along with technical overbought conditions. However, there have been no confirmed negative signals so far:
Positive Expectations
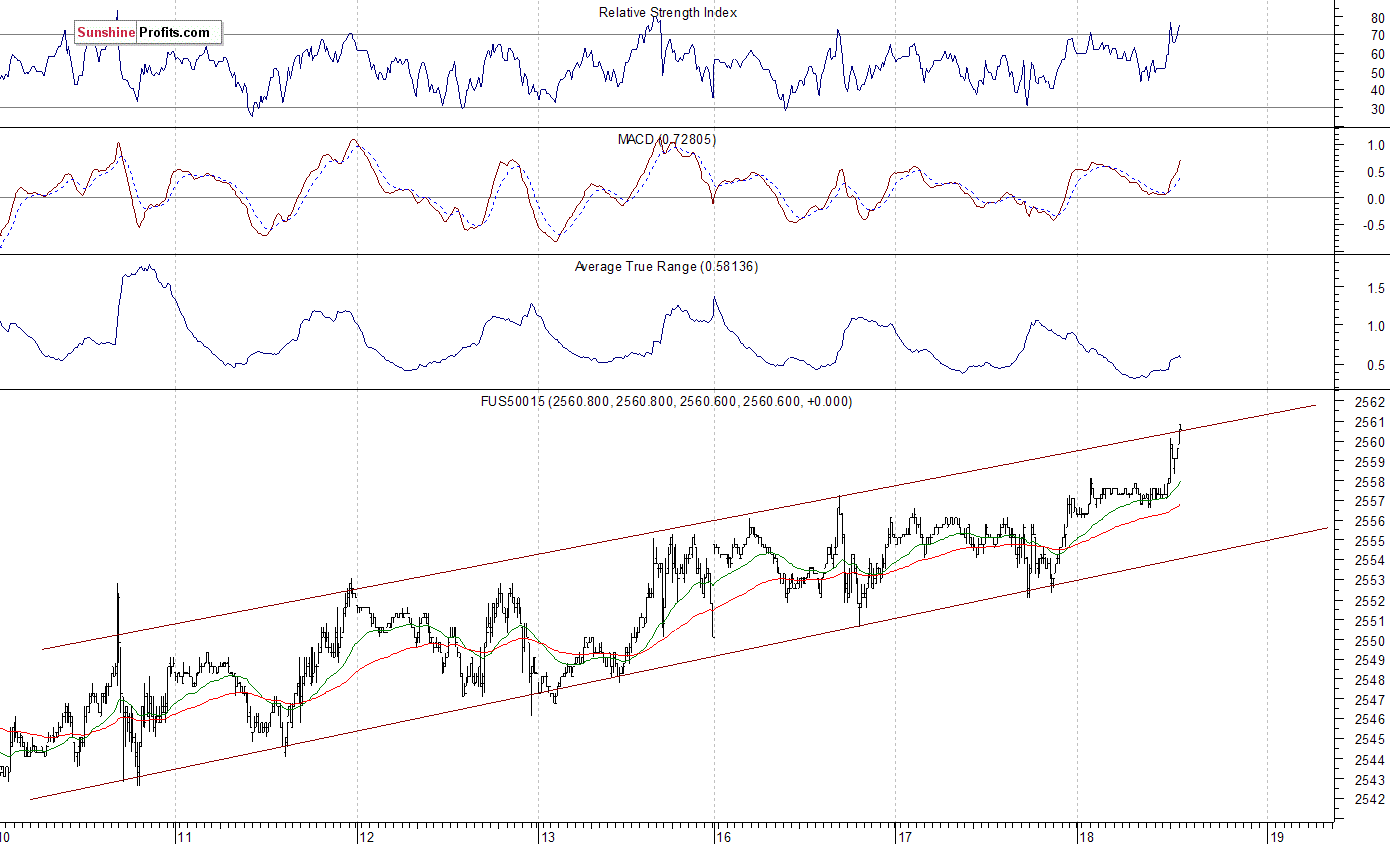
Expectations before the opening of today's trading session are mixed, with index futures currently between 0.0% and +0.3% vs. yesterday's closing prices. The European stock market indexes have gained 0.3-0.5% so far. Investors will now wait for some economic data announcements: Housing Starts, Building Permits at 8:30 a.m., Crude Oil Inventories at 10:30 a.m., Fed's Beige Book release at 2:00 p.m. The market expects that Housing Starts were at 1.18M, and Building Permits were at 1.25M in September. Investors will also wait for more quarterly corporate earnings releases. The S&P 500 futures contract trades within an intraday uptrend, as it reaches new all-time high along the level of 2,560. The nearest important resistance level is at around 2,560, marked by record high. On the other hand, the nearest important support level is at 2,550, marked by local lows. The next level of support is at 2,540-2,545, marked by previous resistance level and local lows. The futures contract is within an over-week-long upward trading channel, as we can see on the 15-minute chart:
Nasdaq At New Record
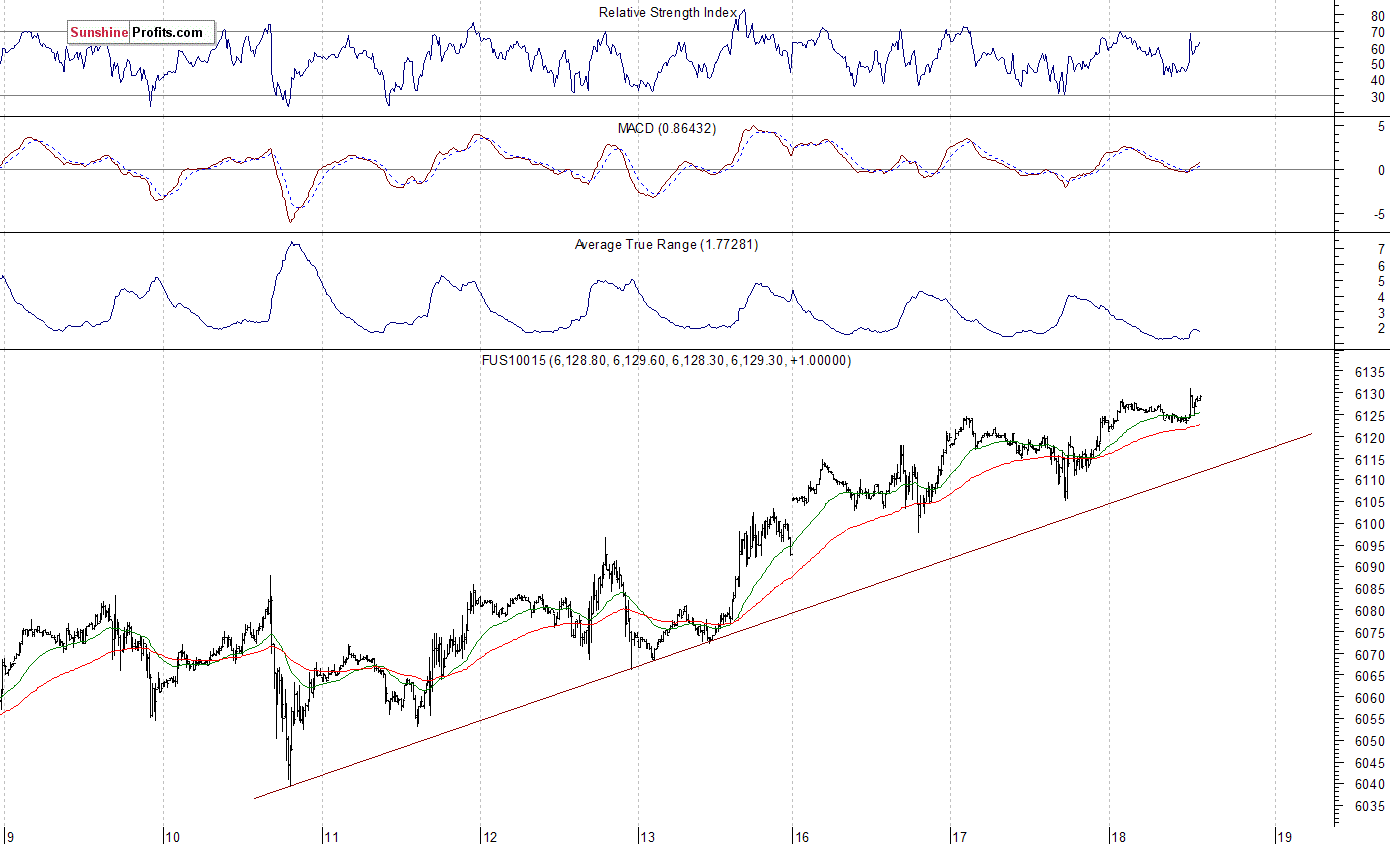
The technology Nasdaq 100 futures contract follows a similar path, as it reaches new record high at around 6,130. Potential resistance level is at 6,150-6,200. The nearest important support level is now at around 6,120, marked by some short-term local lows. The next support level is at 6,080-6,100. The Nasdaq 100 futures contract continues to trade above its upward trend line, as the 15-minute chart shows:
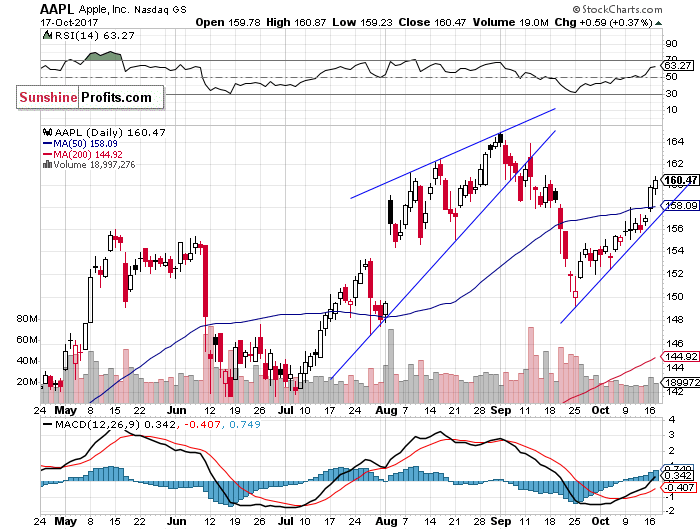
Let's take a look at Apple, Inc. stock (AAPL) daily chart (chart courtesy of http://stockcharts.com) again. It remained relatively stronger than broad stock market indexes recently, as it retraced some of its early September decline. The stock price bounced off support level at around $150 at the end of September. Is this a new uptrend or just upward correction?
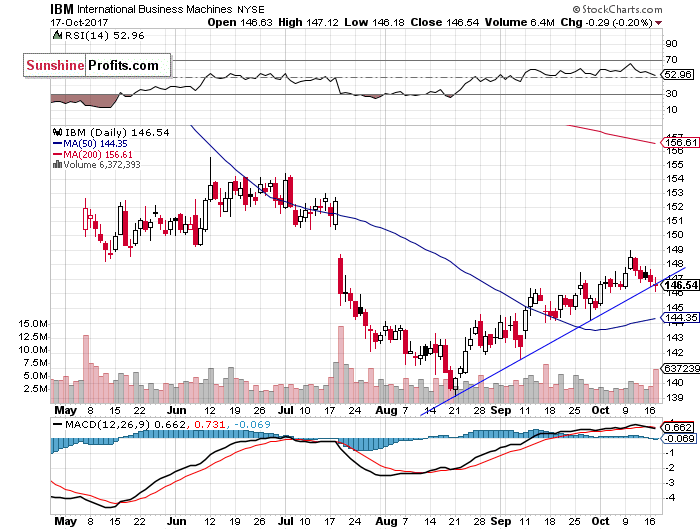
Now, let's take a look at the International Business Machines stock (IBM) daily chart (chart courtesy of http://stockcharts.com). The stock is expected to open around 5% higher today, following better-than-expected quarterly earnings release. The price will rebound off two-month-long upward trend line. Potential level of resistance is at $150-$155, marked by previous consolidation:
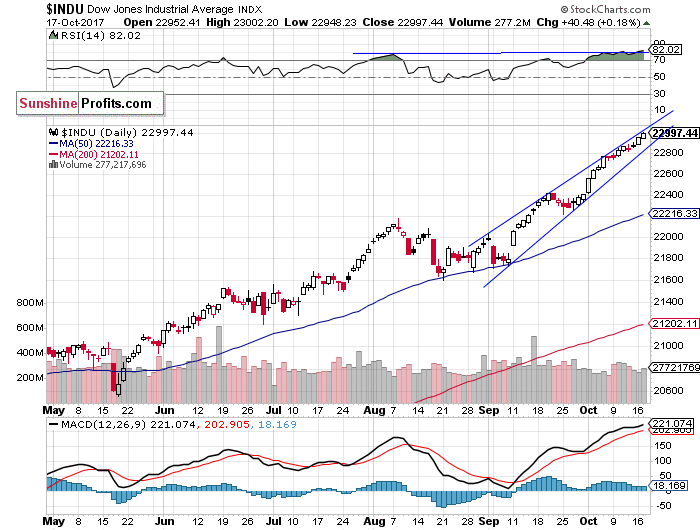
The Dow Jones Industrial Average daily chart (chart courtesy of http://stockcharts.com) shows that blue-chip index reaches new record highs, as it touches 23,000 mark for the first time. There have been no confirmed negative signals so far. We can see relatively steep month-long upward trading channel or a negative rising wedge pattern. Is this some medium-term topping pattern?
Concluding, the S&P 500 index slightly extended its uptrend yesterday, as it gained 0.1% and broke above its Monday's record high. Will uptrend continue? Or is this some topping pattern before downward correction? There have been no confirmed negative signals so far. However, we can see technical overbought conditions, along with very bullish investors' sentiment. The broad stock market may retrace some of its recent advance at some point.
Currently, we prefer to be out of the market, avoiding low risk/reward ratio medium-term trades. We will let you know when we think it is safe to get back in the market.
To summarize: no medium-term positions are justified from the risk/reward perspective at this moment.
Intraday trade:
S&P 500 index - short position: profit target level: 2,540; stop-loss level: 2,575,
S&P 500 futures contract (September) - short position: profit target level: 2,537; stop-loss level: 2,572
SPY ETF (SPDR S&P 500, not leveraged) - short position: profit target level: $254; stop-loss level: $257,5
Medium-term trade:
No medium-term position is justified from the risk/reward perspective at this moment.
Thank you.
Paul Rejczak
Stock Trading Strategist
Stock Trading Alerts

