

Briefly:
Intraday trade: Our Wednesday's intraday outlook was neutral. The S&P 500 index gained 0.1% after opening 0.1% higher. So, it was a neutral trading action. The market extended its short-term uptrend slightly, as the index remained above the level of 2,700. Investors may continue taking short-term profits off the table today. Therefore, we prefer to be out of the market, avoiding low risk/reward ratio trades.
Medium-term trade: In our opinion, no medium-term positions are justified.
Our intraday outlook is neutral. Our short-term outlook is neutral, and our medium-term outlook is neutral:
Intraday outlook (next 24 hours): neutral
Short-term outlook (next 1-2 weeks): neutral
Medium-term outlook (next 1-3 months): neutral
The main U.S. stock market indexes were mixed between -0.2% and +0.2% on Wednesday, as investors took short-term profits off the table following recent rally. The S&P 500 index remains above the level of 2,700 and it currently trades 5.7% below its January 26 record high of 2,872.87. The Dow Jones Industrial Average lost 0.2% and the technology Nasdaq Composite gained 0.2%, as it was relatively slightly stronger than the broad stock market yesterday.
The nearest important level of resistance of the S&P 500 index is at around 2,715-2,720, marked by yesterday's daily high. The next resistance level is at around 2,740, marked by some March local highs and March 19 daily gap down of 2,741.38-2,749.97. The resistance level is also at 2,760-2,765. On the other hand, the nearest important support level is now at 2,700, marked by previous resistance level. The support level is also at 2,685-2,695, marked by Tuesday's daily gap up of 2,686.49-2,692.05.
Stocks are in the middle of their over two-month-long consolidation following early February sell-off. The market bounced off its year-long medium-term upward trend line few weeks ago. Is this a bottoming pattern before another leg higher within the long-term bull market? Or just pause before another wave of selling? So, there are still two possible future scenarios - bearish that will lead us below February low following trend line breakdown, and the bullish one in a form of medium-term double top pattern or breakout towards 3,000 mark. For now, the S&P 500 index got closer to its mid-March consolidation below the level of 2,750. It trades along the above-mentioned March 19 daily gap down:
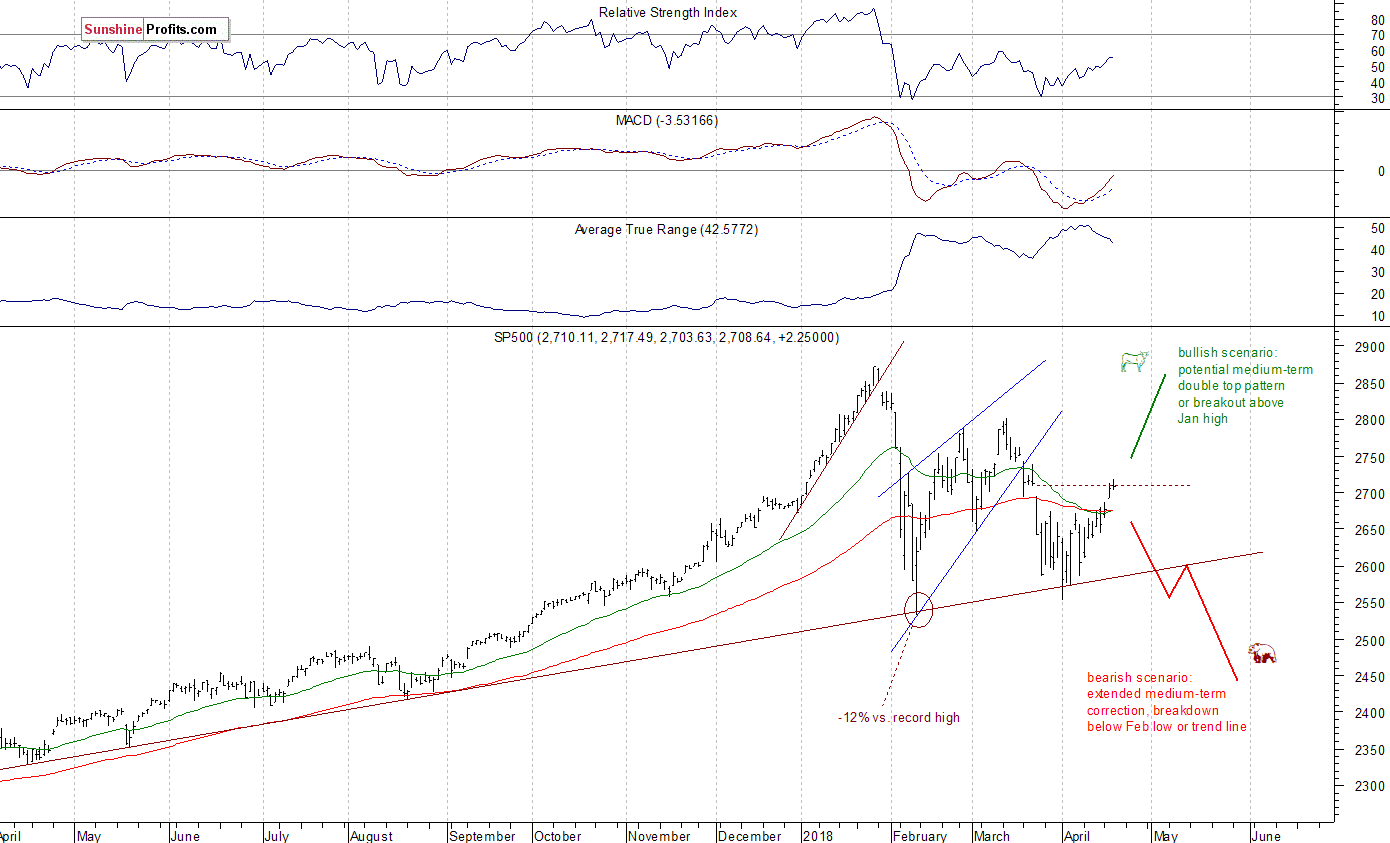
Downward Reversal or Just Profit Taking Action?
Expectations before the opening of today's trading session are slightly negative, because the index futures contracts trade 0.2% below their yesterday's closing prices. The European stock market indexes have been mixed so far. Investors may continue taking profits off the table following Tuesday's rally. Is short-term uptrend over? Probably not, but we will see if the index remains above previous resistance level of 2,695-2,700 or gets back lower again. Investors will wait for some economic data announcements today: Initial Claims, Philadelphia Fed Manufacturing Index at 8:30 a.m., Leading Indicators at 10:00 a.m. Investors will also wait for more quarterly earnings releases.
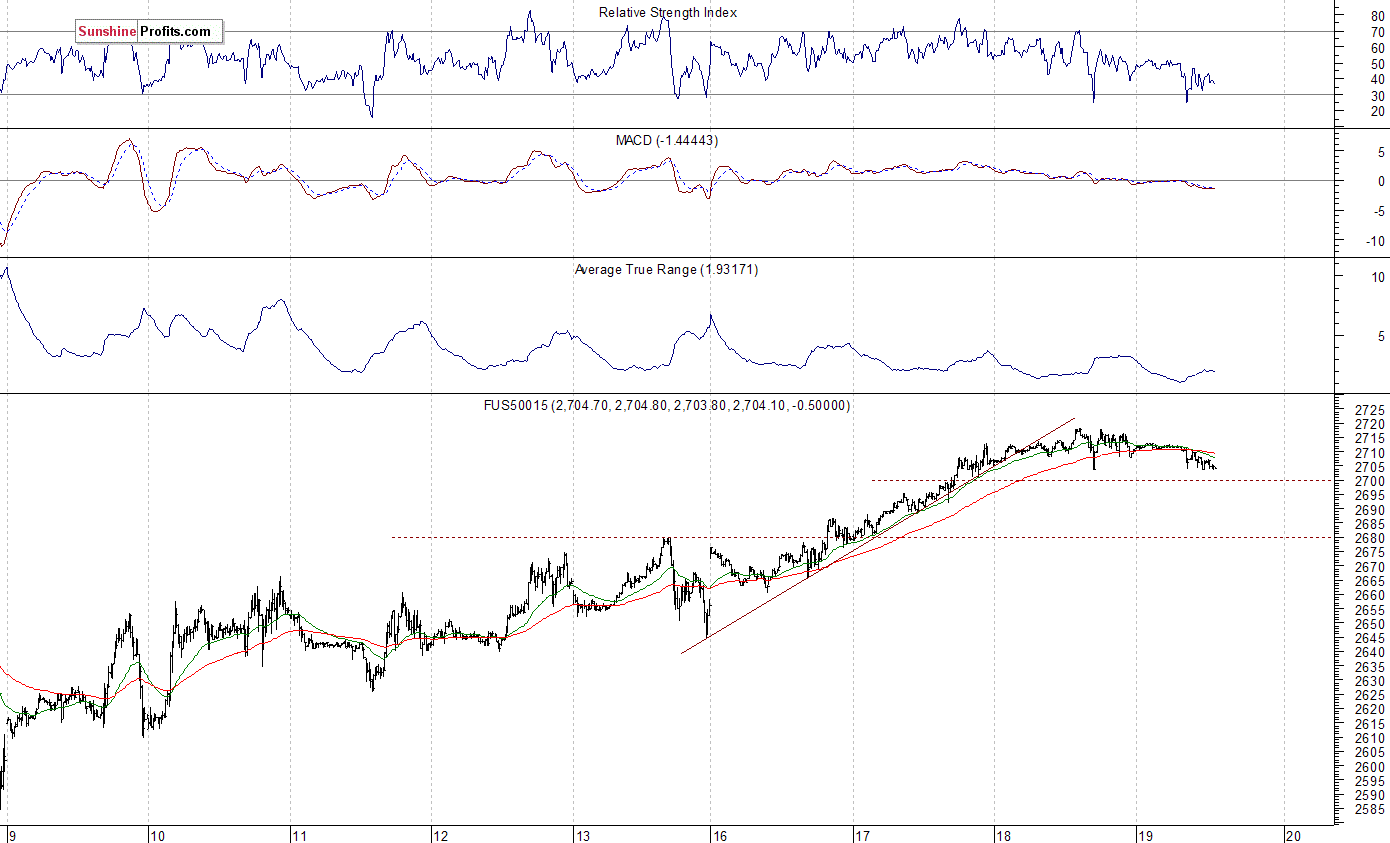
The S&P 500 futures contract trades within an intraday consolidation following overnight move down. For now, it looks like a correction after a short-term uptrend. Potential resistance level remains at around 2,720-2,725, marked by previous local high, among others. On the other hand, support level is at 2,700-2,705, marked by recent level of resistance. The next level of support is at 2,690. The futures contract trades within a two-day-long consolidation, as we can see on the 15-minute chart:
Nasdaq Remains Above 6,800 Mark
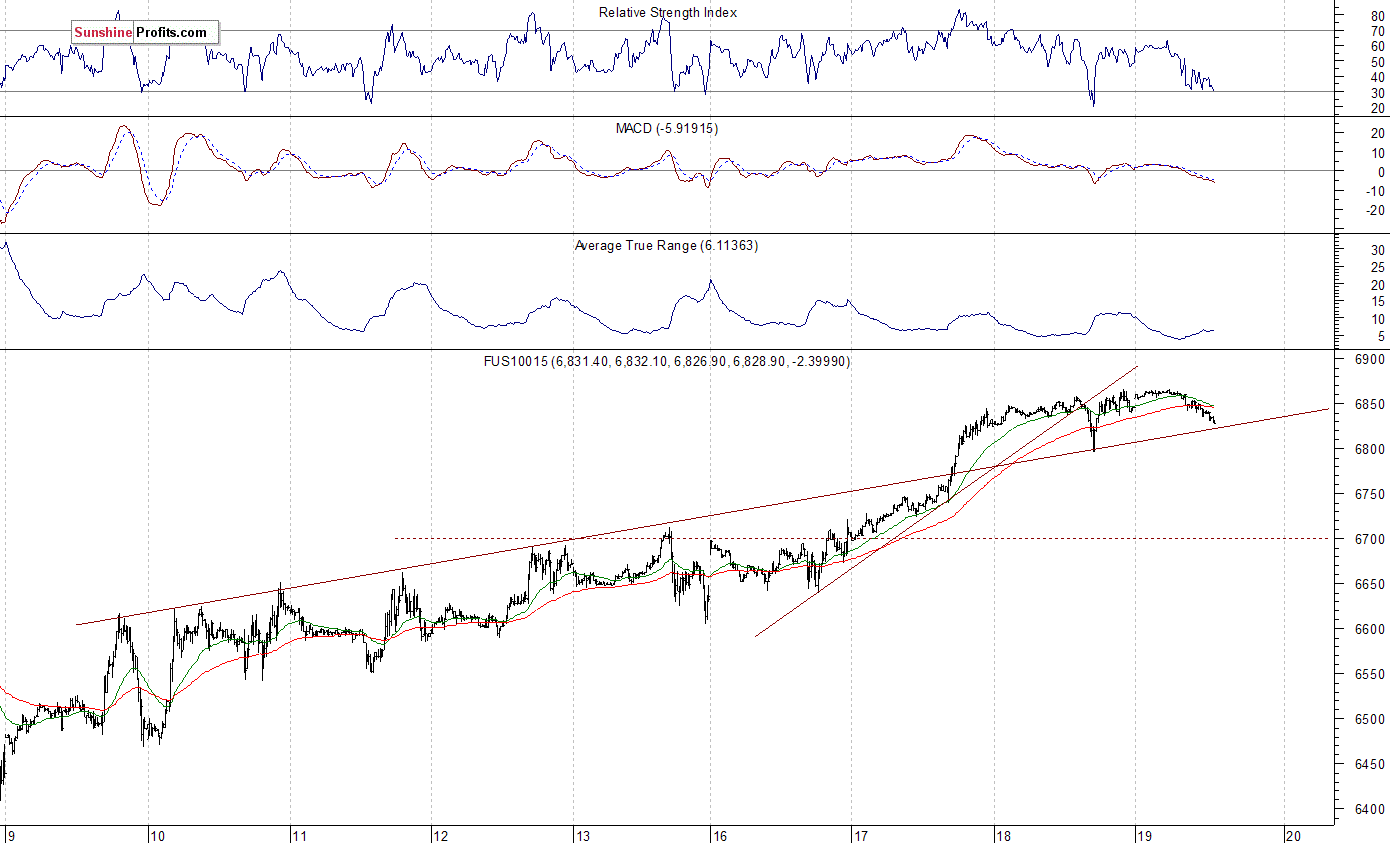
The technology Nasdaq 100 futures contract follows a similar path, as it retraces some of its recent move up. The market rallied after Monday's earnings release from Netflix and continued slightly higher yesterday after a quick downward correction to support level of 6,800. The nearest important level of support remains at 6,800-6,820, and the next support level is at 6,750, among others. On the other hand, resistance level is now at 6,850-6,870, marked by local highs. The Nasdaq futures contract is trading along its short-term upward trend line, as the 15-minute chart shows:
Apple, Amazon Rallied Ahead Of Earnings
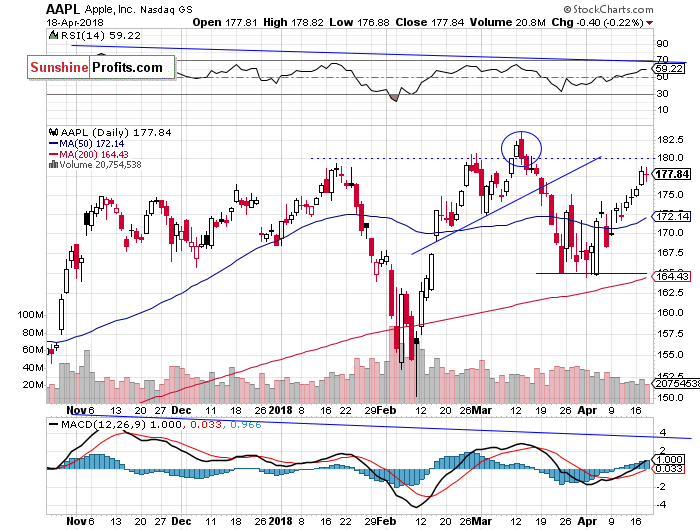
Let's take a look at Apple, Inc. stock (AAPL) daily chart (chart courtesy of http://stockcharts.com). It broke above the resistance level of $175 on Monday, and it accelerated higher on Tuesday. Just like we wrote in our previous alerts; "If the market breaks higher, it could retrace more of March sell-off and get close to record high again", the stock got closer to its record high. There is a potential level of resistance at $180-$183.5. Apple will release its earnings report on May 1 and we may see some kind of "buy the rumor, sell the news" action. However, there are still medium-term negative technical divergences:
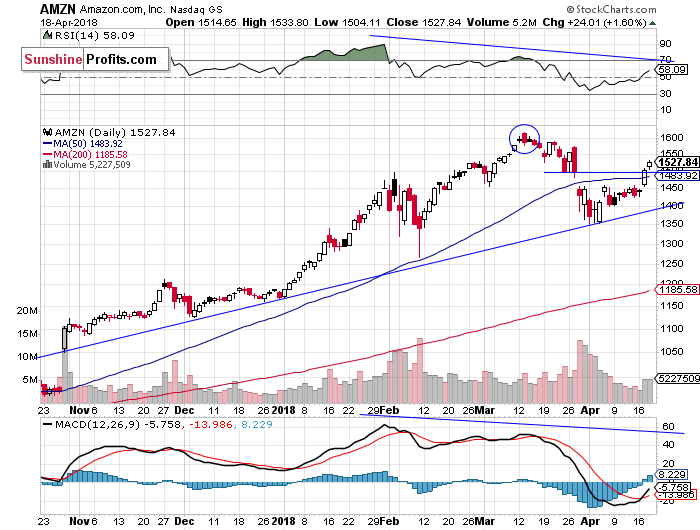
Now let's take a look at Amazon.com, Inc. stock (AMZN) daily chart. It was relatively strong recently, following breakout above its short-term consolidation. The stock continued above the price of $1,500. Will it reach its March record high again? Amazon will release its earnings report on April 26, and just like in case of Apple, we may see "buy the rumor, sell the news" action. Potential level of resistance is now at around $1,550:
Dow Jones Above Downward Trend Line
The Dow Jones Industrial Average broke above its medium-term downward trend line, and it got closer to 25,000 mark again. On Tuesday we wrote that it was a possible short-term scenario. And it came true. What's next? We may see some uncertainty closer to the above-mentioned 25,000 resistance level. On the other hand, support level is now at around 24,500, marked by the trend line:
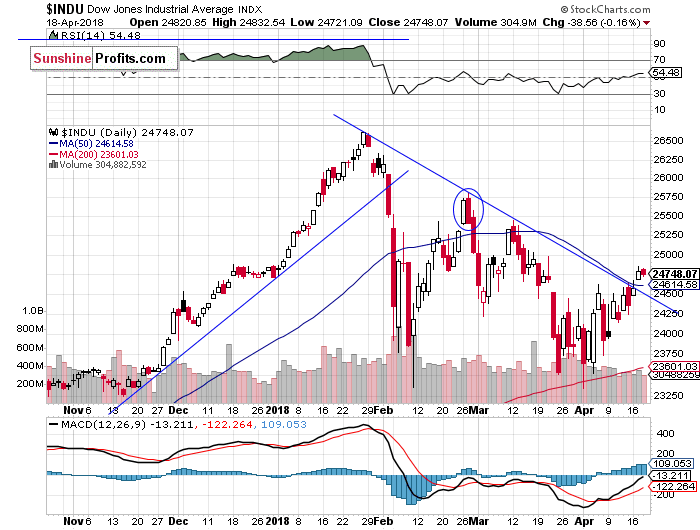
The early March rally failed to continue following monetary policy tightening, trade war fears, among others. What was just profit-taking action, quickly became a meaningful downtrend. Breakdown below over-month-long rising wedge pattern made medium-term bearish case more likely, and after some quick consolidation, the index accelerated towards its early February low. Just like we wrote in our several Stocks Trading Alerts, the early February sell-off set the negative tone for weeks or months to come. However, recent fluctuations were a bottoming pattern before upward reversal. It looks like Monday's breakout confirmed change of trend. At least from a short-term perspective.
Concluding, the S&P 500 index will likely extend its short-term fluctuations today. Investors may continue taking profits following recent rally. The market will probably fluctuate along the level of 2,700. Quarterly corporate earnings releases outweigh trade war fears, Syrian conflict escalation worries at this moment.
Currently, we prefer to be out of the market, avoiding low risk/reward ratio medium-term trades. We will let you know when we think it is safe to get back in the market.
To summarize: no medium-term positions are justified from the risk/reward perspective at this moment.
Intraday trade:
No intraday position is justified from the risk/reward perspective today.
No medium-term position is justified from the risk/reward perspective at this moment.
Thank you.
Paul Rejczak
Stock Trading Strategist
Stock Trading Alerts

