

Trading position (short-term; our opinion): Short positions (with a stop-loss order at $48.56 and initial downside target at $35.24) are justified from the risk/reward perspective.
On Monday, crude oil lost 1.74% after news that the Shaybah Oil field in the Al-Khali desert will increase production by 250,000 barrels per day to 1 million in May. Thanks to these circumstances, light crude extended losses and slipped to the mid-March high. Will oil bears push the commodity lower in the coming days?
Let’s examine charts and try to answer this question (charts courtesy of http://stockcharts.com).
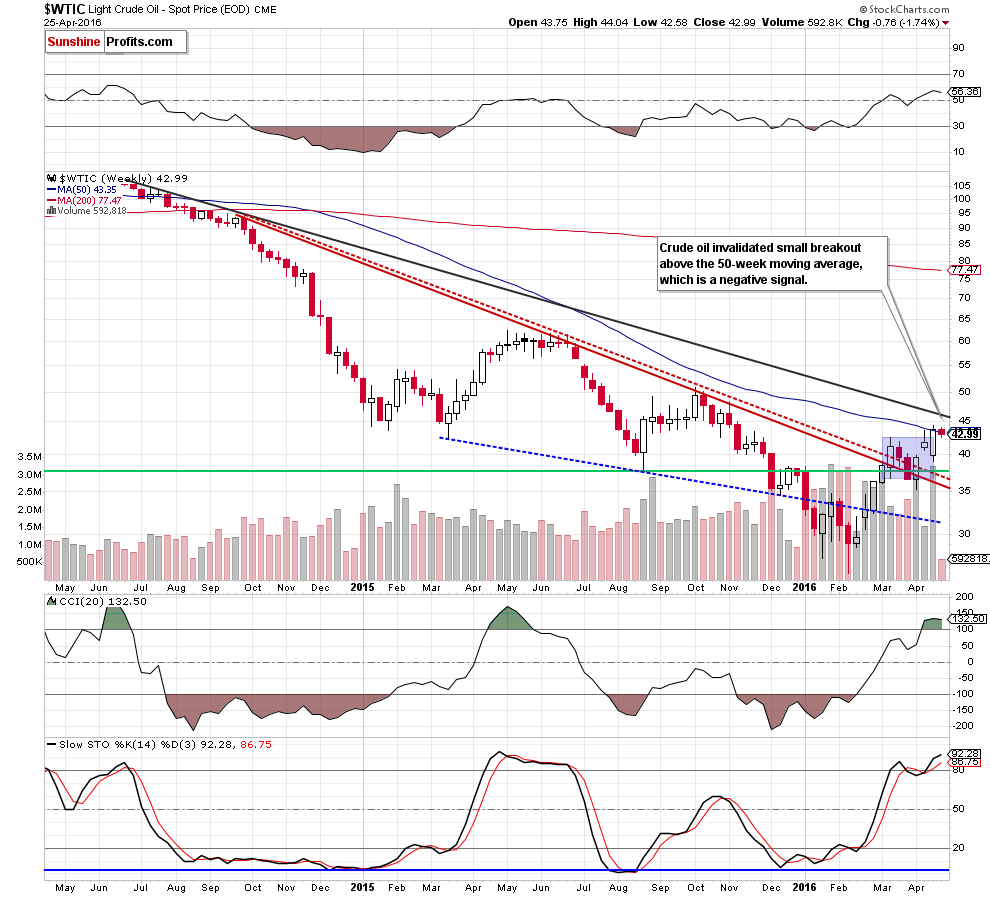
Looking at the weekly chart, we see that crude oil moved lower yesterday and slipped under the 50-week moving average, invalidating earlier small breakout, which is a negative signal that suggests further deterioration – especially when we factor in high readings of the CCI and Stochastic Oscillator.
How did this drop affect the very short-term picture? Let’s check.
Yesterday, we wrote the following:
(…) although crude oil moved little higher after the market’s open, oil bulls didn’t manage to push the commodity above the Thursday’s high, which resulted in a pullback. With this move, light crude slipped under the black resistance line based on the previous highs and closed another day below it, which increases the importance of this line.
Will it be strong enough to stop further rally? From today’s point of view, we see that this black line is slightly below the solid resistance zone, which suggests that reversal and lower values of light crude are just around the corner.
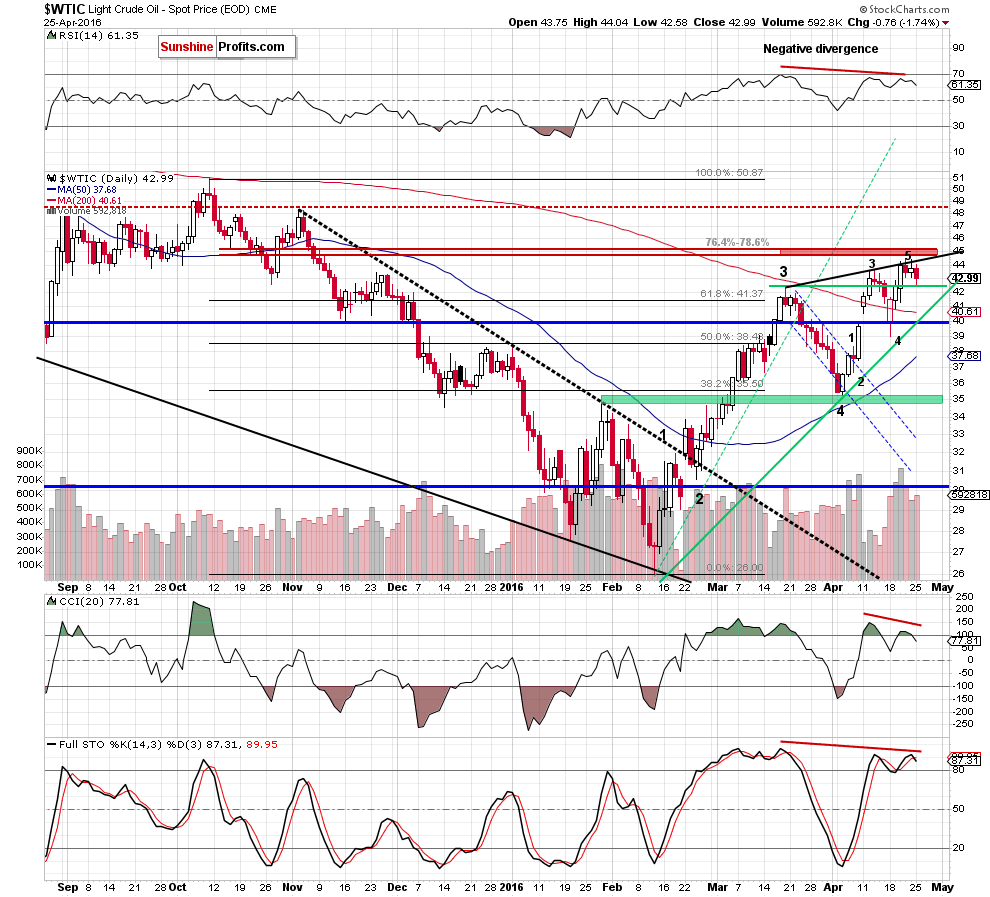
From today’s point of view, we see that crude oil moved lower as we had expected. As you see, light crude increased slightly after the market’s open, but the proximity to the black resistance line (based on the previous highs) was enough to encourage oil bears to act. As a result, the commodity extended losses and dropped to the support line based on the mid-March high. Although crude oil rebounded slightly in the following hours, the CCI and Stochastic Oscillator generated sell signals, which suggests that lower values of the commodity in the coming days are very likely.
Additionally, we should also keep in mind what we wrote on Thursday:
(…) the recent rally pushed crude oil to a new peak, suggesting that the fifth wave may be about 161.8% greater than the first wave. If this is the case, we may see another upswing even to around $44.83 in the coming days (additionally, if we consider the last upward move (since Apr 5) we can also discern five waves). At this point it is worth noting that in this area (around $45-$45.60) is also the red resistance zone created by the 76.4% and 78.6% Fibonacci retracement levels based on the Oct-Feb downward move, which could encourage oil bears to act.
(…) we would like to draw your attention to Fibonacci extensions based on earlier pullbacks. Firstly, when we consider the downward move from mid-March high of $42.49 to Apr low of $35.24, we see that the first important extension (127.2%) is around $44.46. Secondly, when we analyze extensions based on the recent decline (from $43.69 to $39), we notice that the 127.2% extension is around $44.96. Connecting the dots, both extensions are very close to current levels and the red resistance zone, which increases the likelihood of reversal in the coming day(s).
Finishing today’s alert, we would also like to comment the current situation in the oil-to-gold and oil-to-silver ratios.
On Thursday, we wrote:
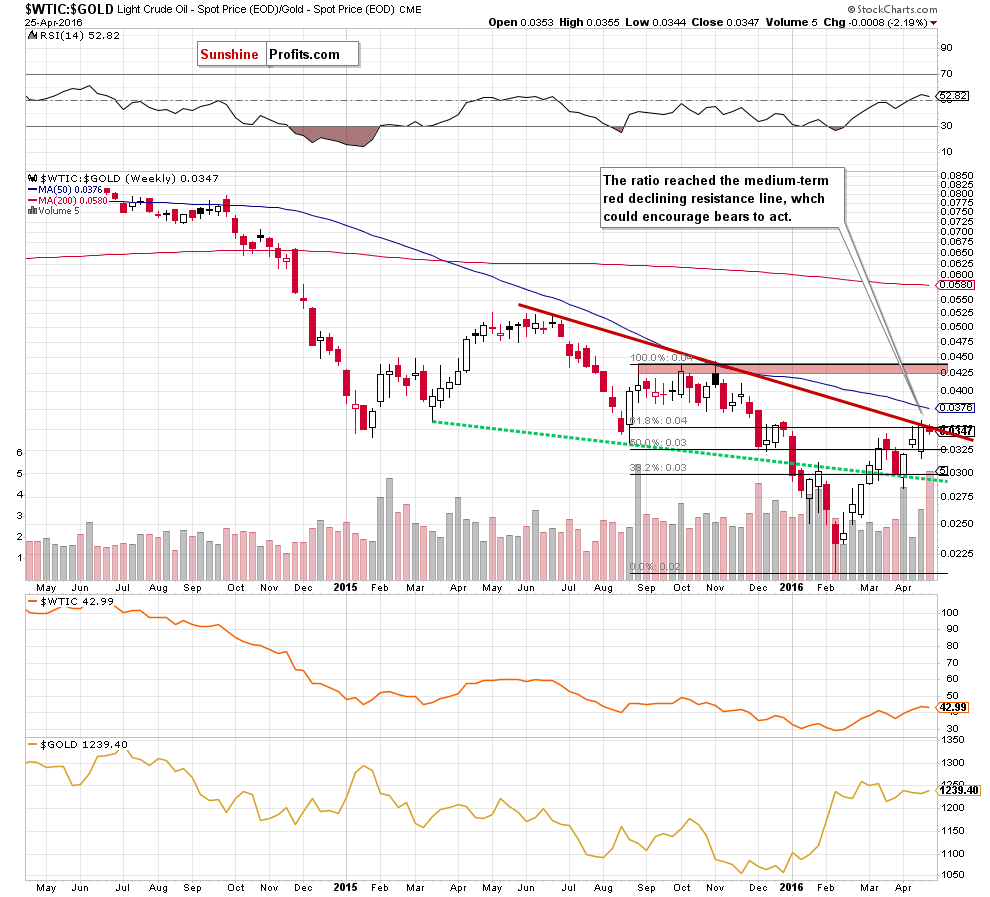
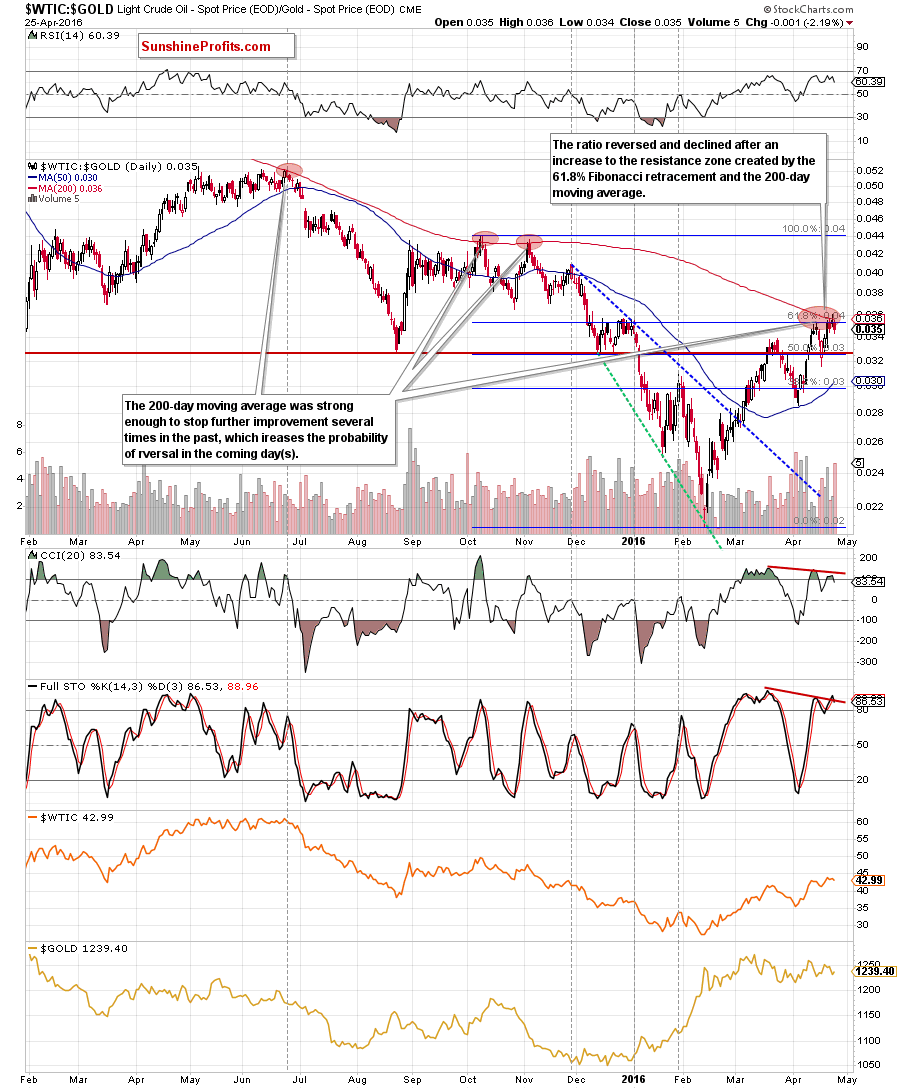
(…) the ratio reached the red resistance zone created by the 61.8% Fibonacci retracement (based on the Oct-Feb downward move) and the 200-day moving average. As you see several times in the past, this important moving average was strong enough to stop further improvement (even if we saw small and very short-lived breakouts above it), which increases the probability of reversal in the coming day(s). Additionally, there are bearish divergences between the CCI, Stochastic Oscillator and the ratio, which may be another factor that will encourage oil bears to action in near future. On top of that when we zoom out our picture, we notice one more interesting fact. (…) the ratio reached the medium-term red declining resistance line, which is another pro-bearish factor, which could trigger a reversal in near future.
As you see on the charts, the situation developed in line with the above scenario and the ratio declined yesterday. With this move, oil bears pushed the ratio under the medium-term red declining resistance line and the 61.8% Fibonacci retracement, invalidating earlier small breakouts, which is a negative signal that suggests further deterioration in the ratio and also in the case of crude oil.
Having said the above, let’s check whether yesterday’s downswing in crude oil changed anything in the oil-to-silver ratio or not.
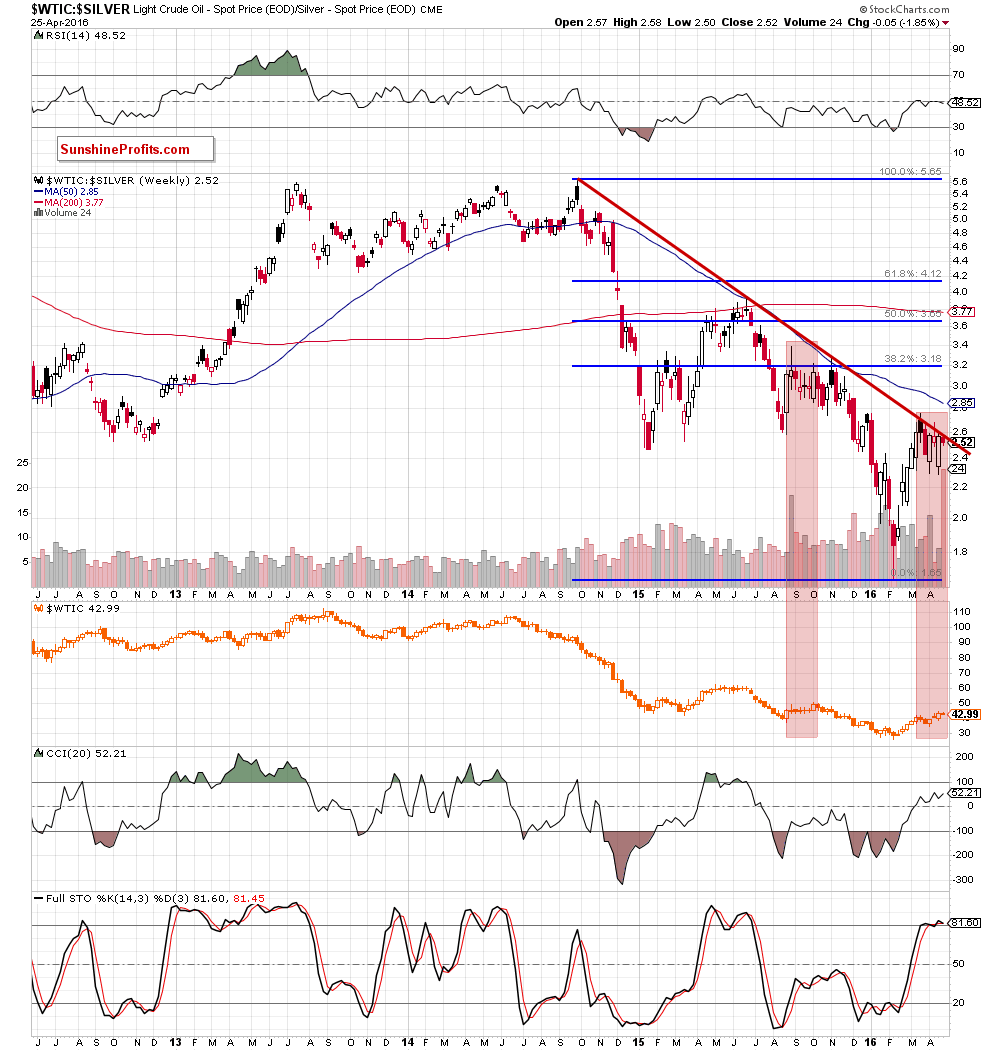
Quoting our Thursday’s alert:
The first thing that catches the eye on the above chart is negative divergence between the ratio and the price of crude oil. When we took a closer look at the chart we noticed similar situation in the previous year. Back then, such price action preceded declines in the commodity, which suggests that history may repeat itself once again – especially when we factor in the proximity to the long-term red declining resistance line and high reading of the Stochastic Oscillator.
Looking at the weekly chart, we see that the situation developed in line with the above scenario and the ratio declined under the long-term red declining resistance line once again. Taking this fact into account, and the current position of the Stochastic Oscillator, we think that further deterioration is just around the corner.
Summing up, the proximity to the black resistance line encouraged oil bears to act, which resulted in a drop to the mid-March high. Although light crude rebounded slightly from this support, sell signals generated by the daily indicators, the current situation in the oil-to-gold and oil-to-silver rations, negative divergences between indicators and the value of both ratios suggest that lower values of the commodity are just a matter of time (short time).
Very short-term outlook: berish
Short-term outlook: bearish
MT outlook: bearish
LT outlook: mixed with bearish bias
Trading position (short-term; our opinion): Short positions (with a stop-loss order at $48.56 and initial downside target at $35.24) are justified from the risk/reward perspective. We will keep you informed should anything change, or should we see a confirmation/invalidation of the above.
As a reminder – “initial target price” means exactly that – an “initial” one, it’s not a price level at which we suggest closing positions. If this becomes the case (like it did in the previous trade) we will refer to these levels as levels of exit orders (exactly as we’ve done previously). Stop-loss levels, however, are naturally not “initial”, but something that, in our opinion, might be entered as an order.
Since it is impossible to synchronize target prices and stop-loss levels for all the ETFs and ETNs with the main market that we provide this level for (crude oil), the stop-loss level and target price for popular ETN and ETF (among other: USO, DWTI, UWTI) are provided as supplementary, and not as “final”. This means that if a stop-loss or a target level is reached for any of the “additional instruments” (DWTI for instance), but not for the “main instrument” (crude oil in this case), we will view positions in both crude oil and DWTI as still open and the stop-loss for DWTI would have to be moved lower. On the other hand, if crude oil moves to a stop-loss level but DWTI doesn’t, then we will view both positions (in crude oil and DWTI) as closed. In other words, since it’s not possible to be 100% certain that each related instrument moves to a given level when the underlying instrument does, we can’t provide levels that would be binding. The levels that we do provide are our best estimate of the levels that will correspond to the levels in the underlying assets, but it will be the underlying assets that one will need to focus on regarding the sings pointing to closing a given position or keeping it open. We might adjust the levels in the “additional instruments” without adjusting the levels in the “main instruments”, which will simply mean that we have improved our estimation of these levels, not that we changed our outlook on the markets.
Thank you.
Nadia Simmons
Forex & Oil Trading Strategist
Przemyslaw Radomski, CFA
Founder, Editor-in-chief
Gold & Silver Trading Alerts
Forex Trading Alerts
Oil Investment Updates
Oil Trading Alerts

