

Trading position (short-term; our opinion): Short positions (with a stop-loss order at $33.23 and the price target at $25.63) are justified from the risk/reward perspective.
On Wednesday, crude oil lost 3.74% and hit a fresh multi-year low of $27.56 as worries over supply glut continued to weigh on the price of the commodity. Thanks to these circumstances, light crude closed the day slightly above $28.Where will crude oil head next?
Let’s examine charts and find out what can we infer about future moves (charts courtesy of http://stockcharts.com).
Quoting our previous Oil Trading Alert:
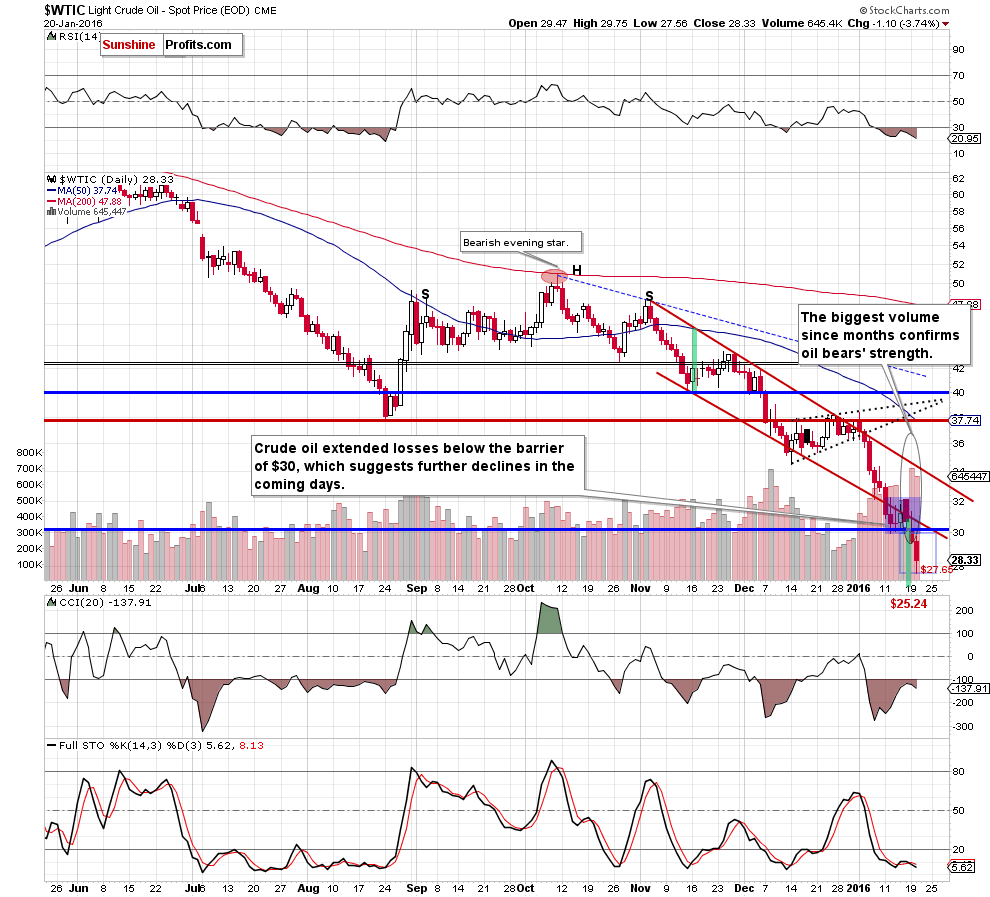
(…) the commodity not only declined below the lower border of the red declining trend channel, but also dropped below the lower border of the blue consolidation. As a result, light crude slipped under the barrier of $30 and closed the day below it, which is a strong bearish signal that suggests further deterioration. At this point, it is also worth noting that the size of the volume that accompanied yesterday’s decline was huge (the biggest increase since months!), which confirms oil bears’ strength and the direction of the trend.
How low could the commodity go in the coming days? Taking into account the breakdown under the lower border of the consolidation, the initial downside target would be around $27.65.
Looking at the daily chart, we see that crude oil extended losses below the lower border of the red declining trend channel and the barrier of $30 as we had expected. As you see on the chart, yesterday’s downswing took the commodity to our first downside target and crude oil hit a fresh multi-year low of $27.56. What’s next? Taking into account the fact that yesterday’s move materialized on sizable volume and there are no buy signals, we believe that lower values of the commodity are still ahead us. Therefore, what we wrote yesterday remains up-to-date:
(…) However, when we consider a breakdown under the lower border of the red declining trend channel, we may see a decline even to $25.24, where the size of the downward move will correspond to the height of the formation. In this area is also our downside target forecasted in Oil Trading Alert posted on Sept 4:
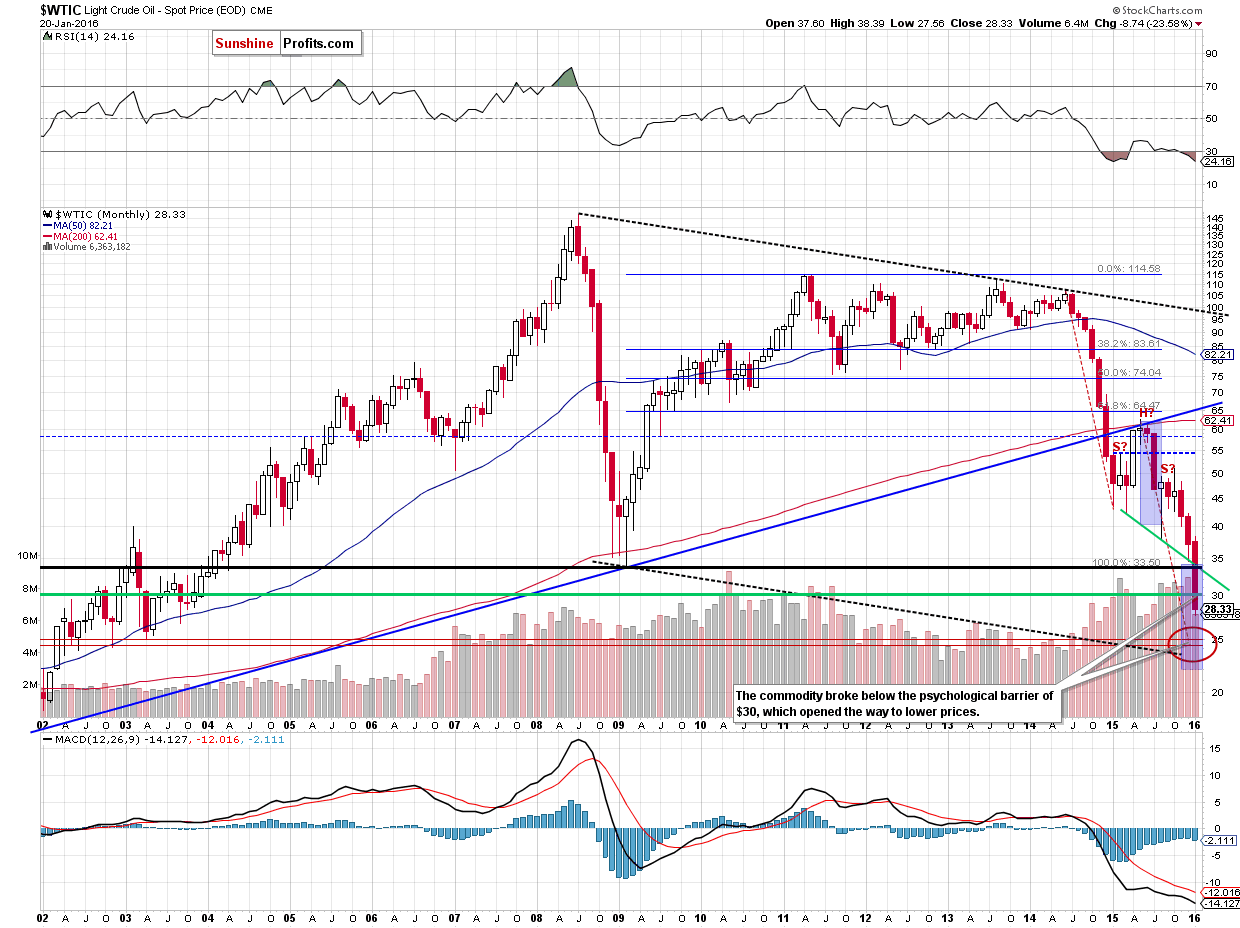
(…) it seems quite likely that crude oil will slide all the way down to more or less $25 dollars and there are multiple reasons for it:
- The breakdown below the key long-term rising support line (marked with blue) was confirmed and verified – this year’s rally didn’t take crude oil back above it – the line proved to be strong resistance. This by itself doesn’t imply a target level at a certain point, but it strongly suggests that crude oil has to fall much lower, before the decline is over.
- The symmetry of major declines: the 2008 slide is the only decline that is really similar to the current one, and in order for this similarity to be upheld (history repeats itself to a considerable extent), crude oil would have to move even a bit below $25. On the above chart you can see that in the form of the declining dashed black lines.
- The symmetry between the 2014 slide and the (likely) current decline. This year we have definitely seen some kind of consolidation (which might still turn out to be a bottom, but that is unlikely in our view) and the move that follows a consolidation is very often similar to the one that preceded it. If you look at the red dashed declining lines on the above chart you’ll notice that for the previous decline to repeat, crude oil would have to move to about $25.
- Speaking of the consolidation, it’s taking the form of a head-and-shoulders pattern and once / if the pattern is completed, we will have a pattern-based target at around $25. The reason is that once price breaks below the “neck level”, it’s likely to decline as much as the size of the “head” in the pattern.
- The late-2002 and 2003 bottoms create strong support at those levels.
The amount of signals that points to $25 as the most likely target is uncanny, which makes it quite reliable.
Yes, there also are the 2008 and 2009 lows, but generally not much (if anything) confirms them as a major target, so they might not be able to generate anything more than a short-lived bounce (if anything at all).
Summing up, crude oil extended losses and reached our first downside target. However, taking into account the size of volume that accompanied yesterday’s decline and the fact that there are no buy signals, we believe that further deterioration is just around the corner. Therefore, in our opinion, short positions with a stop-loss order at $33.23 and the price target at $25.63 are justified from the risk/reward perspective.
Very short-term outlook: bearish
Short-term outlook: bearish
MT outlook: bearish
LT outlook: mixed with bearish bias
Trading position (short-term; our opinion): Short positions (with a stop-loss order at $33.23 and the initial price target at $25.63) are justified from the risk/reward perspective. The analogous levels for USO ETF and DWTI ETN are:
- USO initial target price: $6.67; USO stop-loss: $9.91.
- DWTI initial target price: $513.31; DWTI stop-loss: $302.46.
We will keep you – our subscribers – informed should anything change.
As a reminder – “initial target price” means exactly that – an “initial” one, it’s not a price level at which we suggest closing positions. If this becomes the case (like it did in the previous trade) we will refer to these levels as levels of exit orders (exactly as we’ve done previously). Stop-loss levels, however, are naturally not “initial”, but something that, in our opinion, might be entered as an order.
Since it is impossible to synchronize target prices and stop-loss levels for all the ETFs and ETNs with the main market that we provide this level for (crude oil), the stop-loss level and target price for popular ETN and ETF (among other: USO, DWTI, UWTI) are provided as supplementary, and not as “final”. This means that if a stop-loss or a target level is reached for any of the “additional instruments” (DWTI for instance), but not for the “main instrument” (crude oil in this case), we will view positions in both crude oil and DWTI as still open and the stop-loss for DWTI would have to be moved lower. On the other hand, if crude oil moves to a stop-loss level but DWTI doesn’t, then we will view both positions (in crude oil and DWTI) as closed. In other words, since it’s not possible to be 100% certain that each related instrument moves to a given level when the underlying instrument does, we can’t provide levels that would be binding. The levels that we do provide are our best estimate of the levels that will correspond to the levels in the underlying assets, but it will be the underlying assets that one will need to focus on regarding the sings pointing to closing a given position or keeping it open. We might adjust the levels in the “additional instruments” without adjusting the levels in the “main instruments”, which will simply mean that we have improved our estimation of these levels, not that we changed our outlook on the markets.
Thank you.
Nadia Simmons
Forex & Oil Trading Strategist
Przemyslaw Radomski, CFA
Founder, Editor-in-chief
Gold & Silver Trading Alerts
Forex Trading Alerts
Oil Investment Updates
Oil Trading Alerts

