

Trading position (short-term; our opinion): Short positions with a stop-loss order at $65.23 are justified from the risk/reward perspective.
On Monday, crude oil lost 1.05% as Friday’s OPEC's decision to keep its production above 30 million barrels per day continued to weigh. Additionally, disappointing from China pushed the price lower as well. Thanks to these circumstances, light crude reversed and came back to its support line. Will we see another rebound?
Yesterday’s data showed that Chinese exports fell by 2.5% from a year earlier, while imports declined by 17,6%, missing forecasts for a decline of 10.7% and rising worries over the health of China's economy. On top of that, Chinese crude oil’s imports dropped to 5.47 million bpd, which is a 26% decline on a year-over-year basis. At this point, it is worth noting that China became the world's largest importer of crude in April, therefore, the above-mentioned disappointing numbers pushed the commodity lower. With yesterday’s downswing light crude came back to its support line. Where will it head next? North or south? (charts courtesy of http://stockcharts.com).
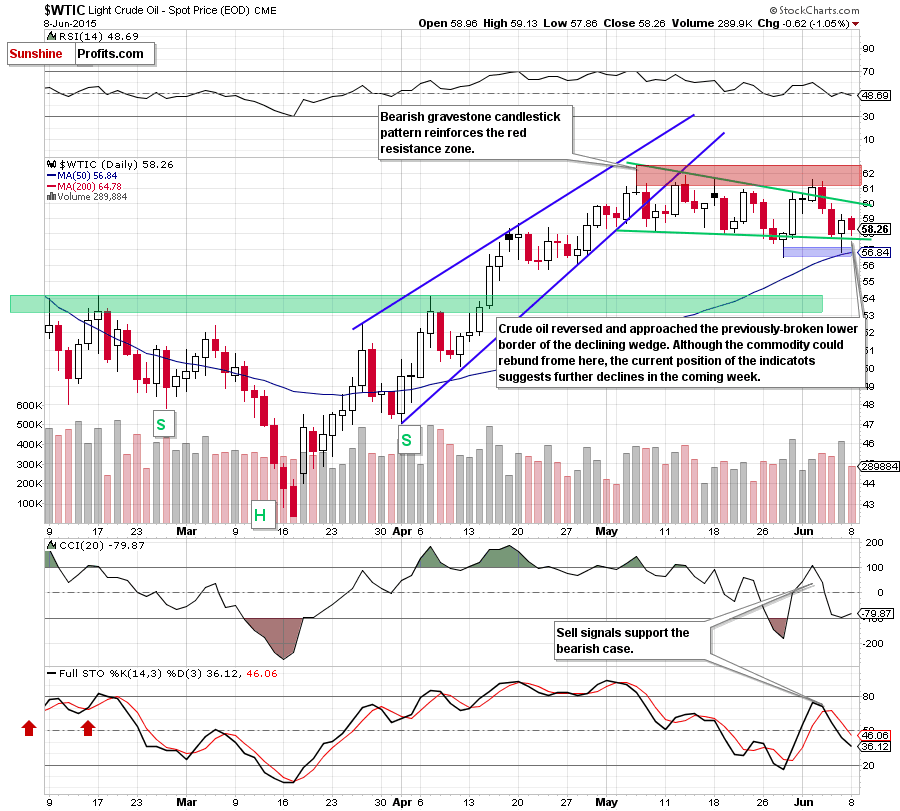
As you see on the daily chart, the situation in the very short term hasn’t changed much as crude oil is still trading in a declining wedge. Yesterday, light crude reversed and approached the previously-broken lower border of the formation, which could trigger a rebound from here later in the day – similarly to what we saw in recent weeks.
Nevertheless, we should keep in mind that even if we see such price action and crude oil moves higher from here, the red resistance area in combination with the key resistance zone marked on the monthly chart below will be strong enough to stop further improvement – similarly to what we saw in the previous weeks (please note that the bearish scenario is also supported by sell signals generated by the daily indicators).
Are there any other factors that could encourage oil bears to act in the coming week? Let’s examine the charts below and find out.
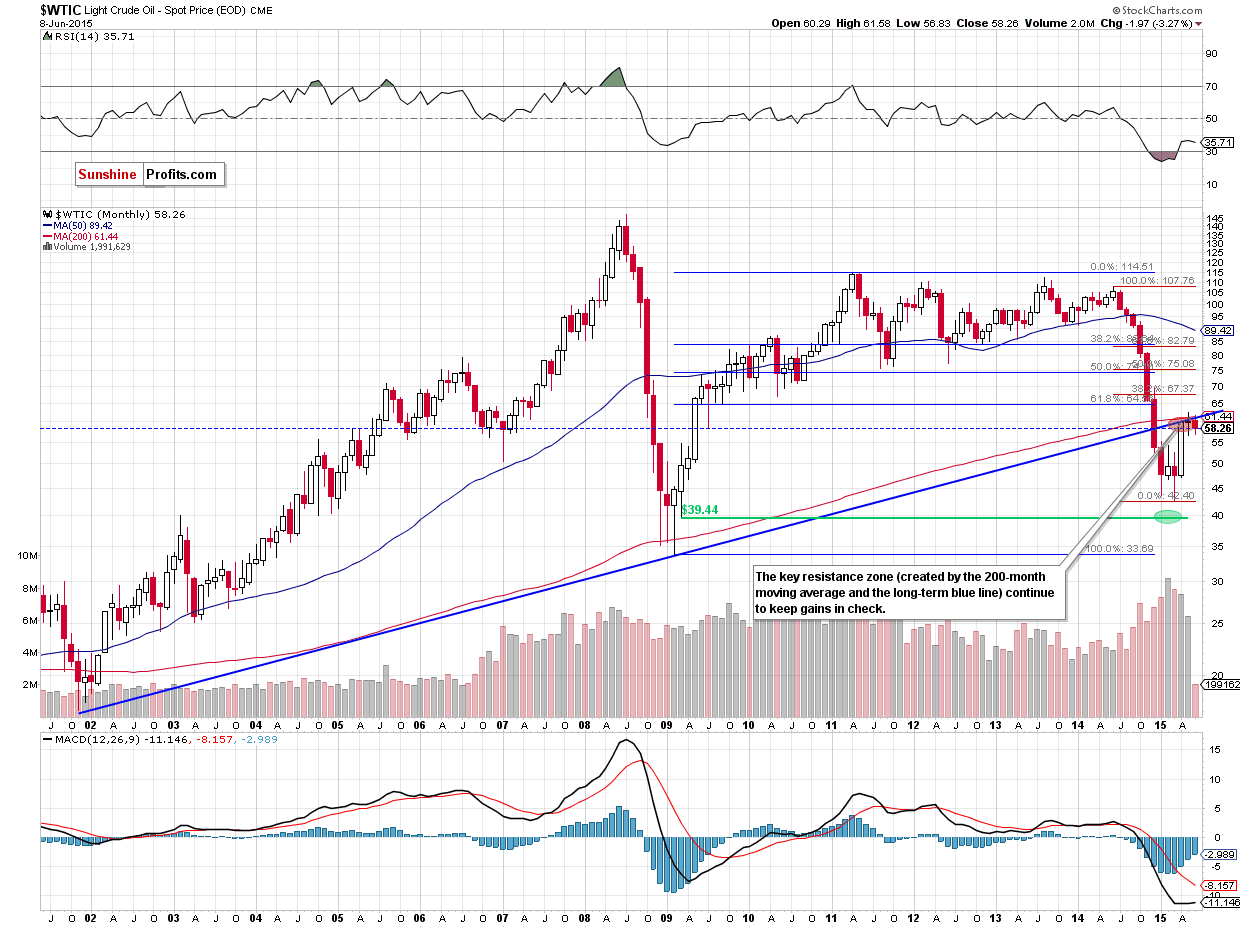
Looking at the monthly chart, we see that although crude oil moved higher earlier this month, the key resistance zone (created by the long-term blue resistance line and the 200-month moving average) continues to keep gains in check, which means that as long as there is no successful breakout above this area further rally is not likely to be seen and further deterioration is more likely than not.
Can we infer something more from the weekly chart? Let’s check.
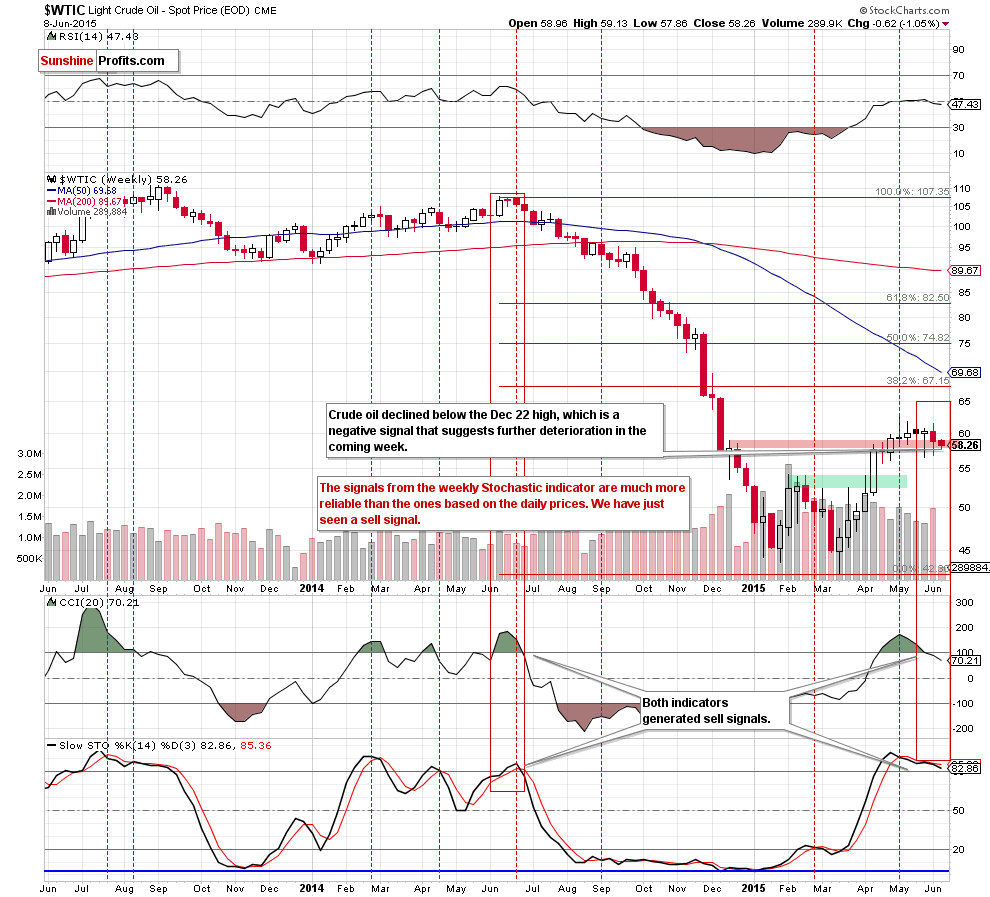
From this perspective, we see that crude oil declined below the Dec 15 high and closed the previous week below it, invalidating earlier breakout, which is a negative signal (additionally, yesterday’s downswing took light crude also under the Dec 22 high) that suggests further deterioration in the coming week.
Additionally, when we take a closer look at the chart, we notice that last week’s decline materialized on sizable volume (compared to what we saw during the recent weeks), which means that oil bears are getting stronger. On top of that, the CCI and Stochastic Oscillator generated sell signals, supporting the bearish case. At this point, it is worth noting that last time we saw similar values of the indicators a year ago. Back then, sell signals preceded huge declines, which took the commodity to the multi-month low of $42.41. Taking this fact into account and combining with the long-term picture, we believe that lower values of crude oil are just around the corner.
If this is the case, and the commodity extends declines, the initial downside target would be the blue support zone (marked on the daily chart) around $56.51-$56.69, where the recent lows and the 50-day moving average are. If it is broken, we’ll see a drop to the green support zone created by the Feb highs.
Summing up, crude oil declined and approached the green support line once again. Although we could see a rebound from here (to the upper line of the declining wedge around $60), we believe that the red resistance area in combination with the key resistance zone (created by the 200-month moving average and the long-term blue line) and sell signals generated by the weekly and daily indicators will encourage oil bears to ac in the coming day(s).
Very short-term outlook: bearish
Short-term outlook: bearish
MT outlook: mixed with bearish bias
LT outlook: mixed with bearish bias
Trading position (short-term; our opinion): Short positions with a stop-loss order at $65.23 are justified from the risk/reward perspective. We will keep you – our subscribers – informed should anything change.
Thank you.
Nadia Simmons
Forex & Oil Trading Strategist
Przemyslaw Radomski, CFA
Founder, Editor-in-chief
Gold & Silver Trading Alerts
Forex Trading Alerts
Oil Investment Updates
Oil Trading Alerts

