

This month’s Oil Investment Update we begin with the words that we used to summarize the situation in the previous update (on Aug 9, 2016). We summarized the situation in the following way:
Although crude oil slipped slightly below the barrier of $40 at the beginning of the month, the commodity invalidated this breakdown on the following day, which in combination with buy signals generated by the daily indicators and invalidation of the breakdown under the 200-day moving average and a weekly closure above the long-term black declining line suggests further improvement in the coming week(s). This scenario is also reinforced by invalidation of the breakdown below the 50-week moving average in the oil-to-oil stocks ratio, invalidation of the breakdown under the long-term red declining line in oil-to-gold ratio (seen on the weekly chart), invalidation of the breakdown under the green support zone in oil-to-stocks ratio (on the daily chart) and invalidation of the breakdown under the 50-week moving average in the case of the WTIC:UDN ratio.
We also attached the bullish scenario:
If crude oil extends gains, the initial upside target would be the upper border of the black declining trend channel marked on the daily chart (currently around $46.90). If it is broken, light crude will likely test the strength of the barrier of $50.
From today’s point, we can say that oil bulls almost realized their pro growth scenario in the previous month, hitting the Aug high of $49.36. Despite this improvement, the barrier of $50 remained intact. Although the commodity rebounded at the beginning of the month once again, the first resistance area was strong enough to stop further improvement. Does it mean that another bigger decline is ahead us? Or maybe it’s just a pause before another attack on the level of $ 50? Let’s jump right into charts (charts courtesy of http://stockcharts.com) and try to find answers to these questions.
Crude Oil
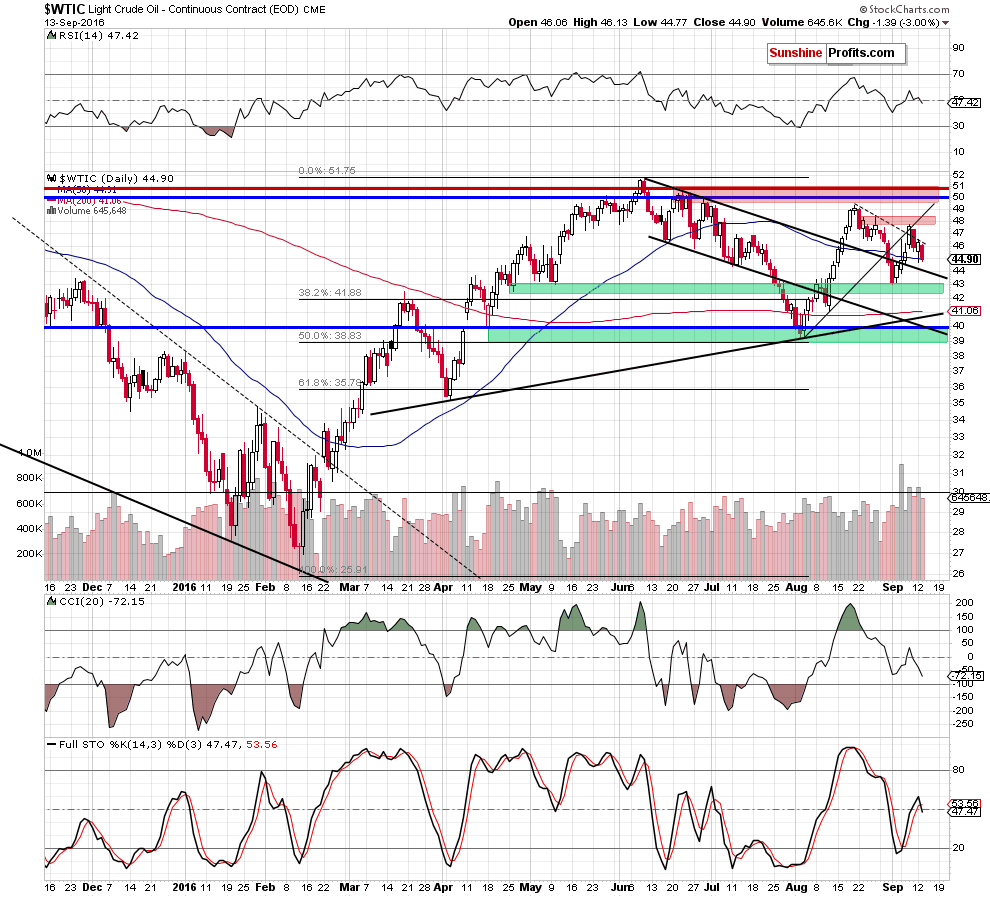
On the daily chart, we see that the green support zone created by the early Aug highs and the 61.8% Fibonacci retracement triggered a rebound at the beginning of Sep. As a result, light crude broke above three important lines: the upper border of the black declining trend channel, the black dashed line based on the recent highs and the resistance line based on the Aug lows. Nevertheless, with this move the commodity also approached the first resistance zone based on the Aug 23 and Aug 26 highs (in terms of intraday highs and daily closings), which encouraged oil bears to act and resulted in an invalidation of two earlier breakouts.
Although crude oil bounced off the 50-day moving average and climbed to an intraday high of $46.51on Monday, the black dashed resistance line based on the previous highs stopped oil bulls. This show of weakness triggered a decline on the following day, which erased almost all Monday’s gains.
With yesterday’s drop light crude slipped under the previously-broken 50-day moving average and closed the day below it, invalidating earlier breakout. Such price action doesn’t bode well for the commodity and suggests further deterioration.
On top of that, the Stochastic Oscillator generated a sell signal, giving oil bears another reason to act. Taking all the above into account, we think that crude oil will extend declines and (at least) test the upper border of the black declining trend channel (currently around $44.05) in the coming day. However, if this support is broken (which is quite likely when we consider the late Aug downward move), we’ll see a test of the Sep low of $43 and a re-test of the green support zone.
Having said the above, let’s examine the situation in the medium-term.
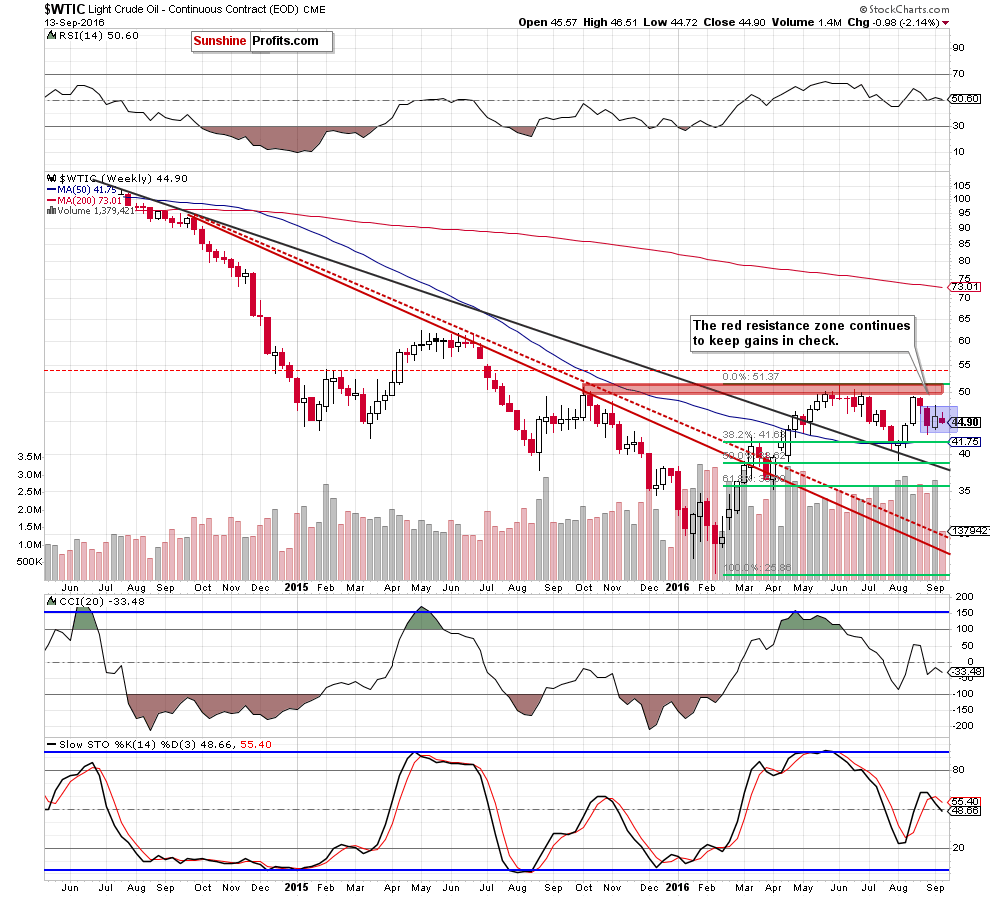
Looking at the weekly chart, we see that crude oil is consolidating between the late Aug high of $47.49 and late Aug low of $43, which suggests that as long as there won’t be a breakout or a breakdown another sizable move is not likely to be seen. Nevertheless, the Stochastic Oscillator generated a sell signal, supporting oil bears and another attempt to move lower.
Additionally, we should keep in mind that the commodity remains under the key resistance zone marked on the long-term chart below.
Therefore, in our opinion, another sizable move will be likely only if we see a breakout above this key resistance. Until this time short-lived moves in both directions (between the support and resistance zones) are very likely, which means that waiting at the sidelines for another profitable opportunity is justified from the risk/reward perspective.
Summing up, yesterday, crude oil declined, erasing almost all of Monday’s gains and invalidating earlier breakout above the 50-day moving average. Taking these negative events into account and combining them with sell signals generated by the daily and weekly Stochastic Oscillator, we think that the commodity will extend losses and test the upper border of the black declining trend channel or even the Sep low of $43 and the green support zone in the coming days.
Having discussed the situation in crude oil, let’s examine the NYSE Arca Oil Index (XOI) to find out what the current outlook for oil stocks is.
Oil Stocks
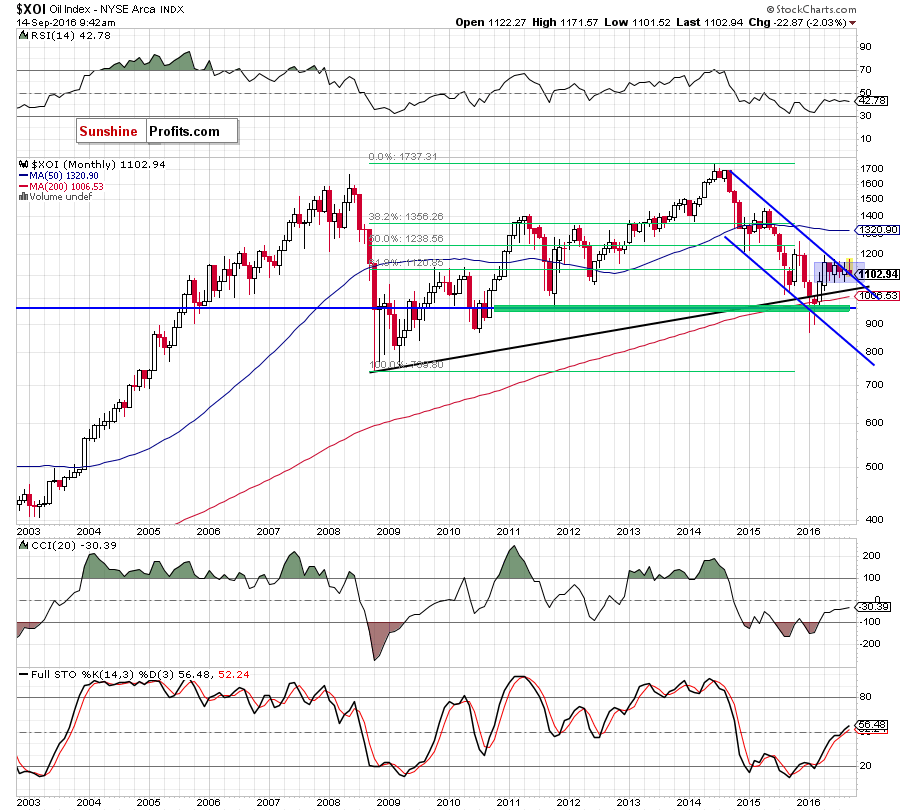
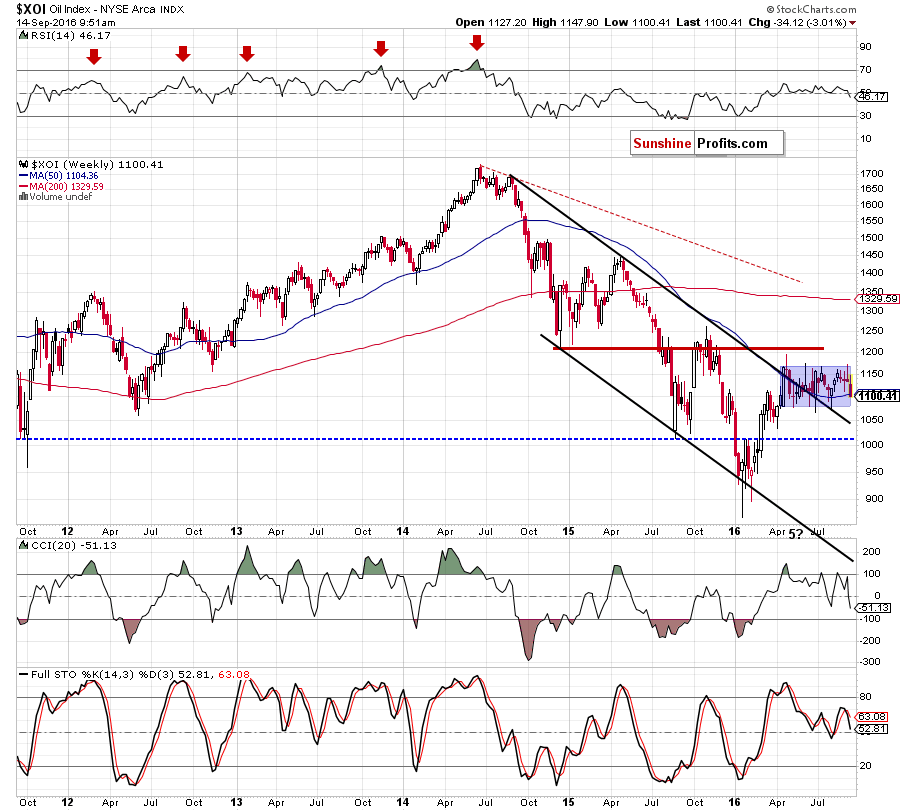
Looking at the XOI from the long- and medium-term perspective, we see that the overall situation hasn’t changed much as oil stocks are trading in a blue consolidation between the upper border of the black declining trend channel (seen on the weekly chart) and the Jun and Jul highs. This means that as long there won’t be breakout above the upper line of the formation (or a breakdown under the black support line) another bigger move is not likely to be seen. Nevertheless, this week’s decline under the 50-week moving average doesn’t bode well for oil stocks, suggesting further declines and a re-test of the strength not only the lower border of the consolidation, but also the upper border of the black declining trend channel.
Having said the above, let’s check the daily chart.
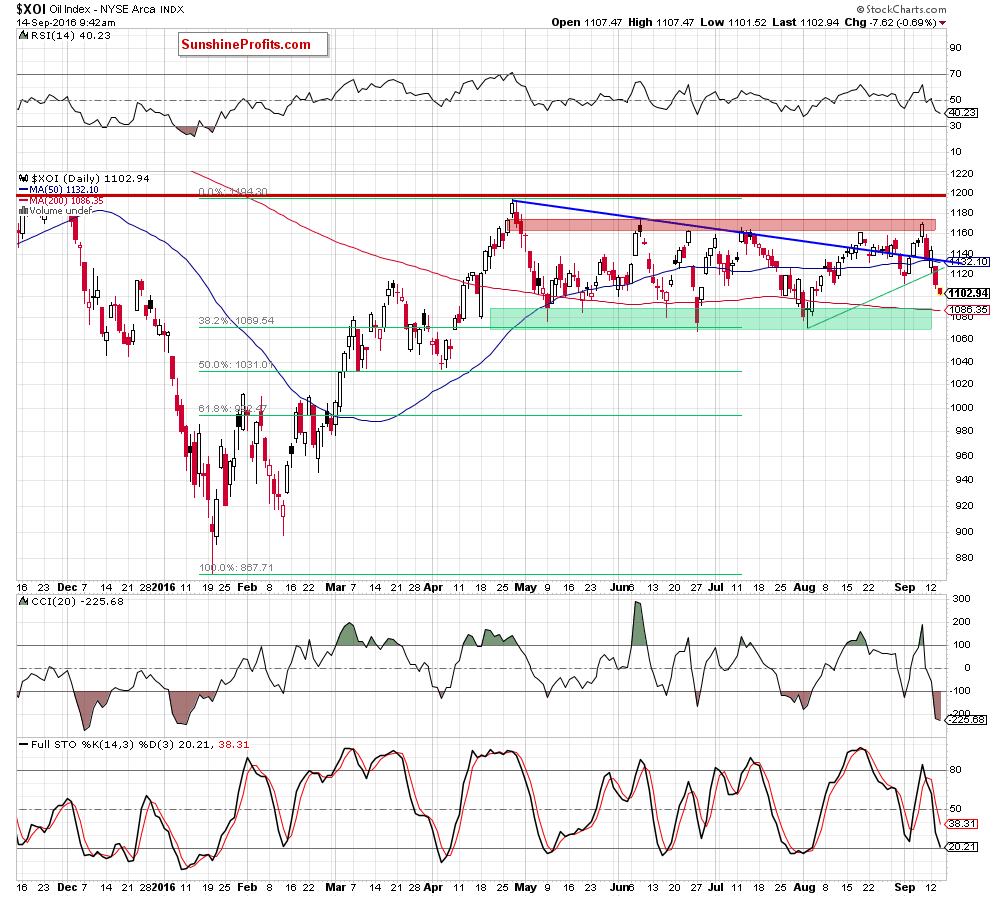
On the daily chart, we see that although oil stocks broke above the blue resistance line in the previous week, the red resistance zone was strong enough to stop further improvement. When we take a closer look at the chart, we notice that there was a similar situation in mid-Aug. Back then, the proximity to the red zone encouraged bears to act, which triggered a correction of previous move and took oil stocks to the Aug 10 low. As you see on the chart, history repeated itself once again and oil bears pushed the index lower in recent days. As a result, the XOI declined under the medium-term blue line, the 50-day moving average and the green support line based on previous lows. Additionally, sell signals generated by the CCI and the Stochastic Oscillator remain in place, suggesting further deterioration. If we see such price action, the initial downside target for bears will be the green support zone, which s currently reinforced by the 200-day moving average and the 38.2% Fibonacci retracement. If this area is broken, oil bears may push oil stocks even to around 1.032-1.040, where the Apr lows and the 50% Fibonacci retracement are.
Summing up, although oil stocks rebounded in recent weeks, they are still trading in the blue consolidation marked on the weekly chart. Therefore, in our opinion, as long there won’t be breakout above the upper line of the formation (or a breakdown under the black support line) another bigger move is not likely to be seen. Nevertheless, invalidation of the breakout above the blue line seen on the daily chart and a drop below green support line based on recent lows suggest further deterioration in the coming days.
Ratio Analysis
Today, we start this section by focusing on the oil-to-oil stocks ratio. What can we infer from the charts below?
On the weekly chart, we see that the ratio moved sharply lower at the end of Aug and slipped under the 38.2% Fibonacci retracement, approaching the 50-week moving average. Despite this drop, the ratio rebounded in the previous week, which resulted in invalidation of the breakdown below both red declining support/resistance lines. Although this was a positive signal, the ratio reversed and invalidated the breakout above the upper red line, closing the previous week below it. Earlier this week, we saw similar price action, however, taking into account a sell signal generated by the Stochastic Oscillator we think that another move to the downside is very likely.
Additionally, the ratio invalidated Friday’s breakout above the red dashed resistance line based on the previous highs seen on the chart below.
On top of that, yesterday we saw another show of weakness when the ratio invalidated earlier breakout above the red dashed line once again. Taking all the above into account, we think that further improvement will be more likely only if the ratio closes at least one of the following weeks above both red resistance lines. Until this time, further deterioration and a re-test of the Sep (or even Aug) lows is very likely.
Finishing today’s commentary on this ratio, please note that as long as there won’t be breakout above the red resistance zone (marked on the weekly chart) another sizable move to the upside won’t be seen.
Will the oil-to-gold ratio confirm this scenario? Let’s check the chart below and find out.
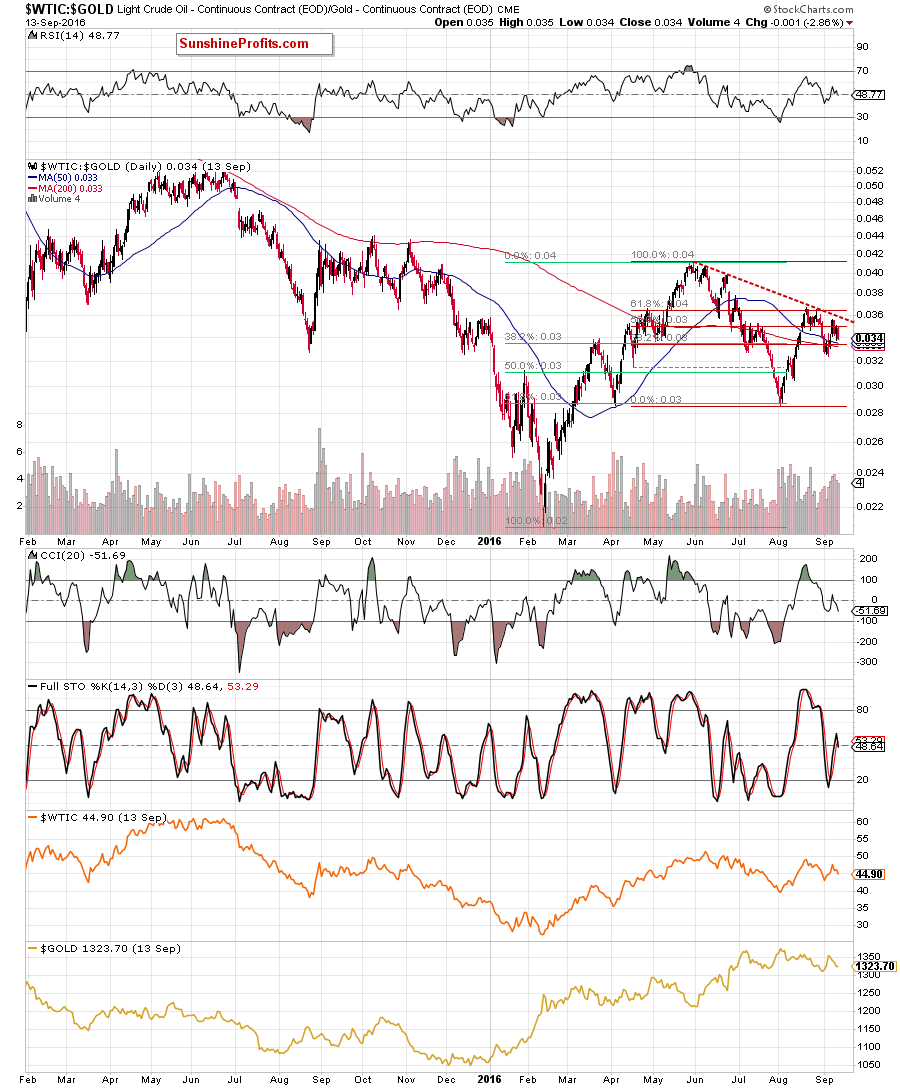
Looking at the daily chart, we see that the red dashed resistance line triggered a correction, which took the ratio below the 200- and 50-day moving averages at the end of Aug. Although the ratio reversed and rebounded, invalidating earlier breakdown, the proximity to this strong resistance was enough to trigger another move to the downside on Friday.
How did this move affect the medium-term picture? Let’s check.
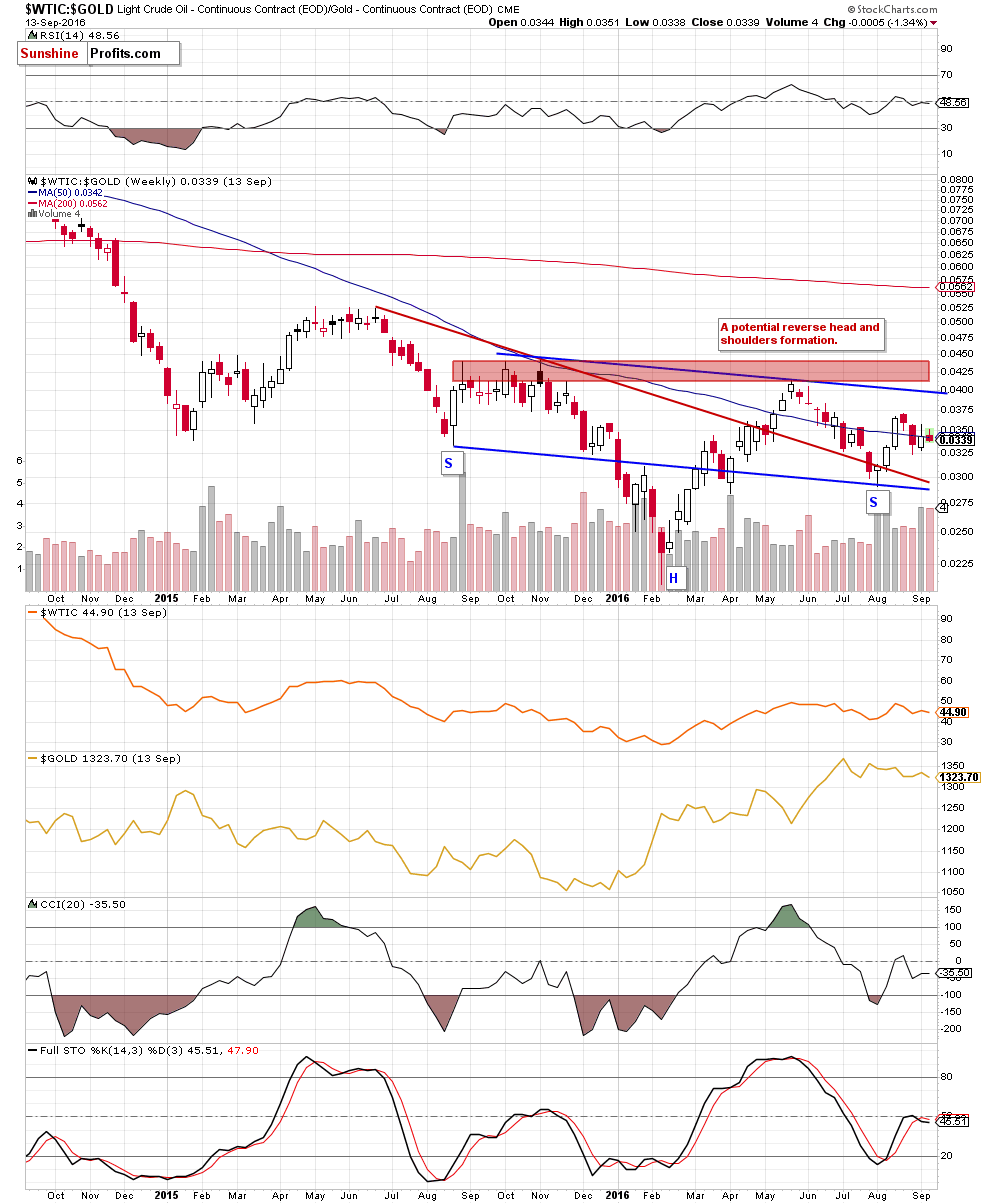
The first thing that catches the eye on the weekly chart is an invalidation of a breakout above the 50-week moving average, which in combination with a sell signal generated by the Stochastic Oscillator suggests another attempt to move lower. At this point, it is worth keeping in mind that the ratio remains not only under the Aug high, but also below the upper blue resistance line (a neck line of a potential reverse head and shoulders formation) and the red resistance zone. Additionally, when we zoom out our picture and look at the monthly chart, we notice one more disturbing factor.
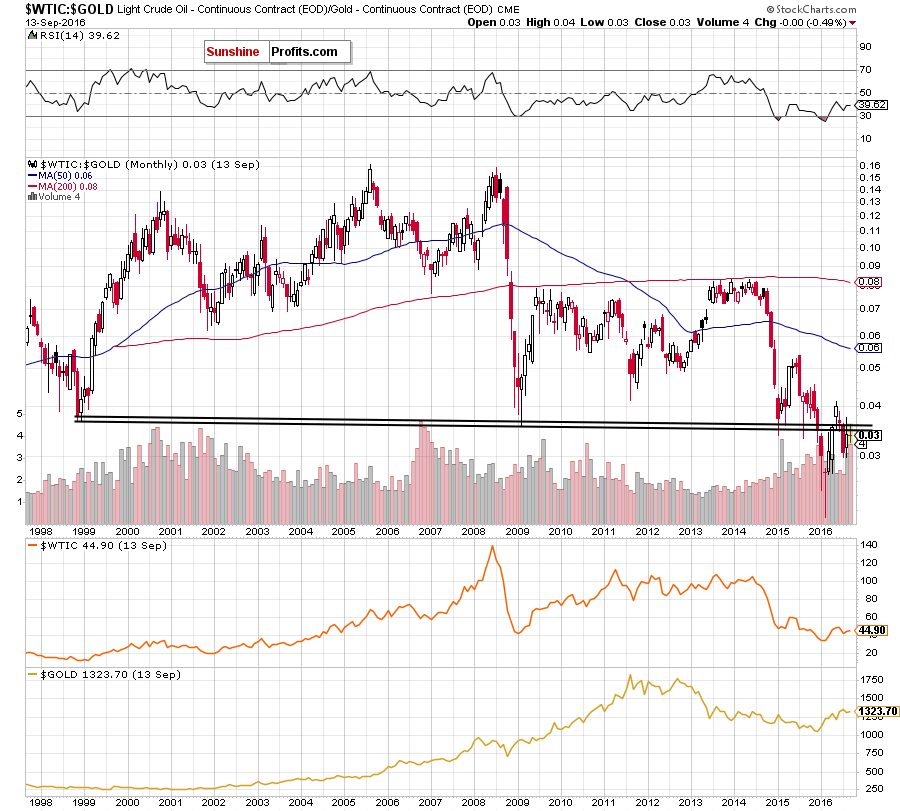
The ratio climbed to the strong resistance area. In the previous month, we saw an increase above it, but the ratio gave up the gains and invalidated earlier small breakout, which resulted in a decline earlier this month. What does it mean for crude oil? Taking into account strong positive correlation between the ratio and the commodity, we think that as long as there won’t be invalidation of the breakdown below both black lines another sizable move is not likely to be seen and another downswing from current levels (in the ratio and also in crude oil) should no surprise us. If this is the case, and we’ll see such bearish scenario, the ratio may test the late-Aug and Sep lows in the coming weeks.
What can we infer from the oil-to-silver ratio? Let’s start with the long-term chart.
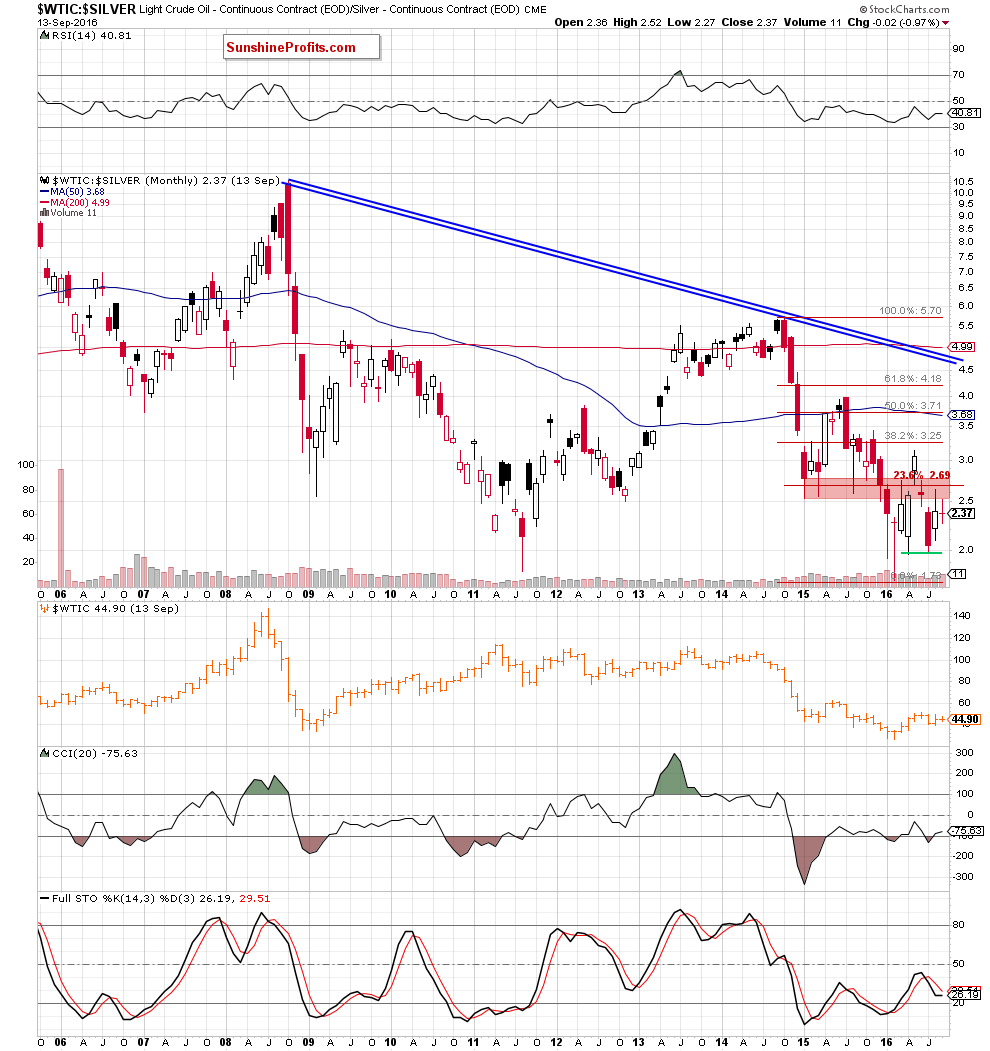
From this perspective, we see that although the ratio moved higher in the previous month, the red resistance zone was strong enough to stop further rally. As a result, we saw a correction, which took the ratio to the Sep low. This suggests that another sizable move to the upside will be more likely only if we see an invalidation of the breakdown below the red zone and a climb above the 23.6% Fibonacci retracement.
Are there any other factors that could encourage bears to act? Let’s check the very short-term chart and find out.
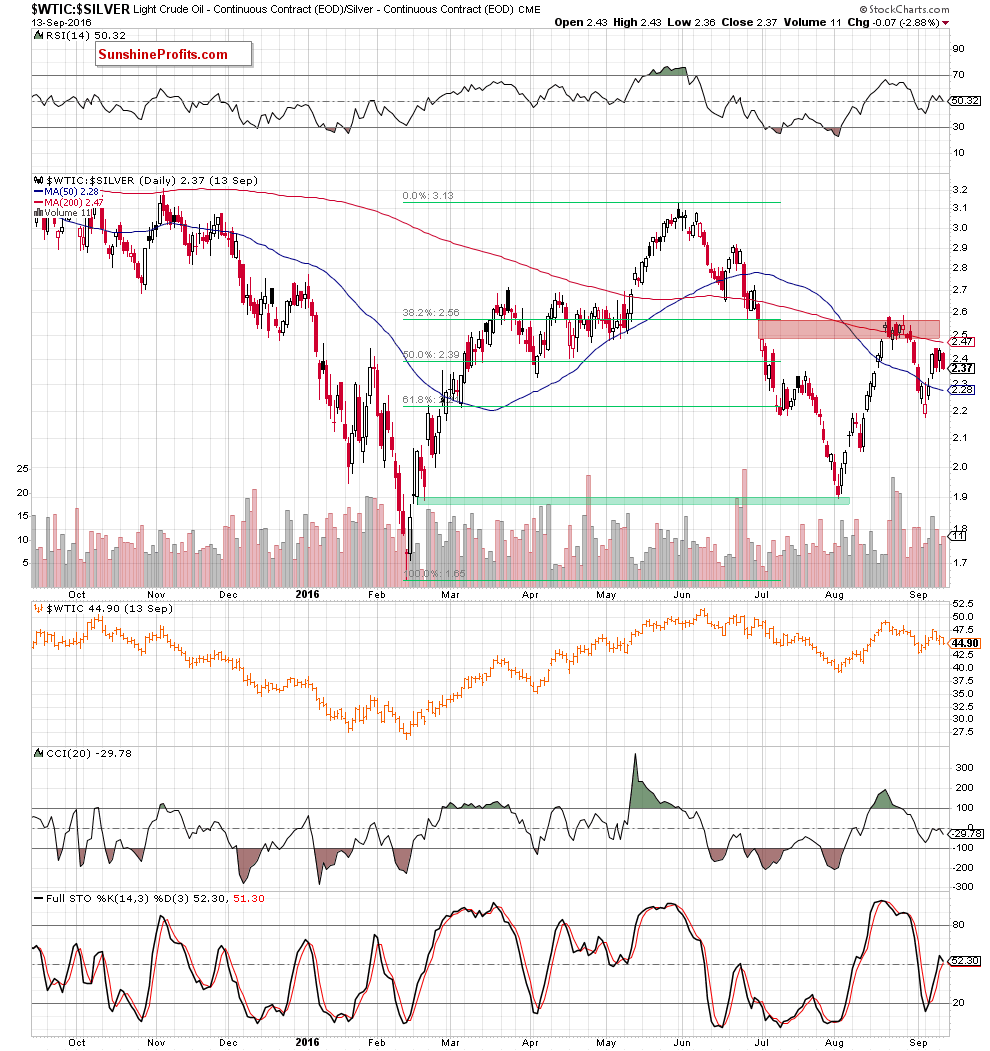
On the daily chart, we see that the red resistance zone created by the Jun/Jul gap stopped the rally in the previous month, triggering a decline in the following days. Although the ratio rebounded earlier this month and came back above the 50-day moving average, the red gap remains in play. As you see this area is currently reinforced by the 200-day moving average, which means that as long as we don’t see a daily closure above 2.575 another downswing in the ratio (and also in crude oil as strong positive correlation remains in cards) is very likely.
Once we know the relationship between crude oil and precious metals, let’s take a closer look at the oil-to-stocks ratio.
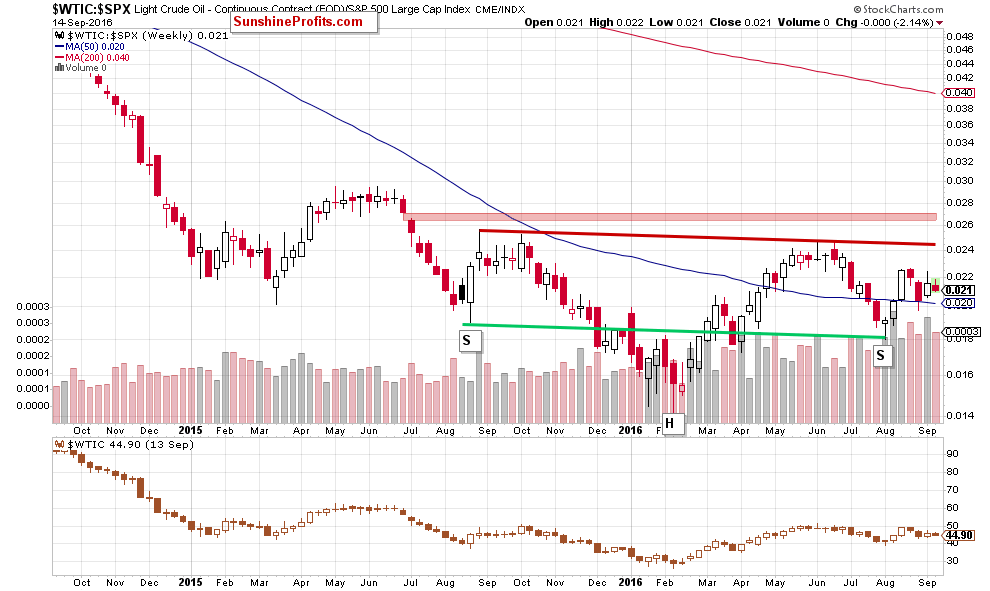
On the weekly chart, we see that the overall situation hasn’t changed much as the ratio remains in a narrow range between the Aug highs and the 50-week moving average.
Will the daily chart give us more clues about future moves? Let’s check.
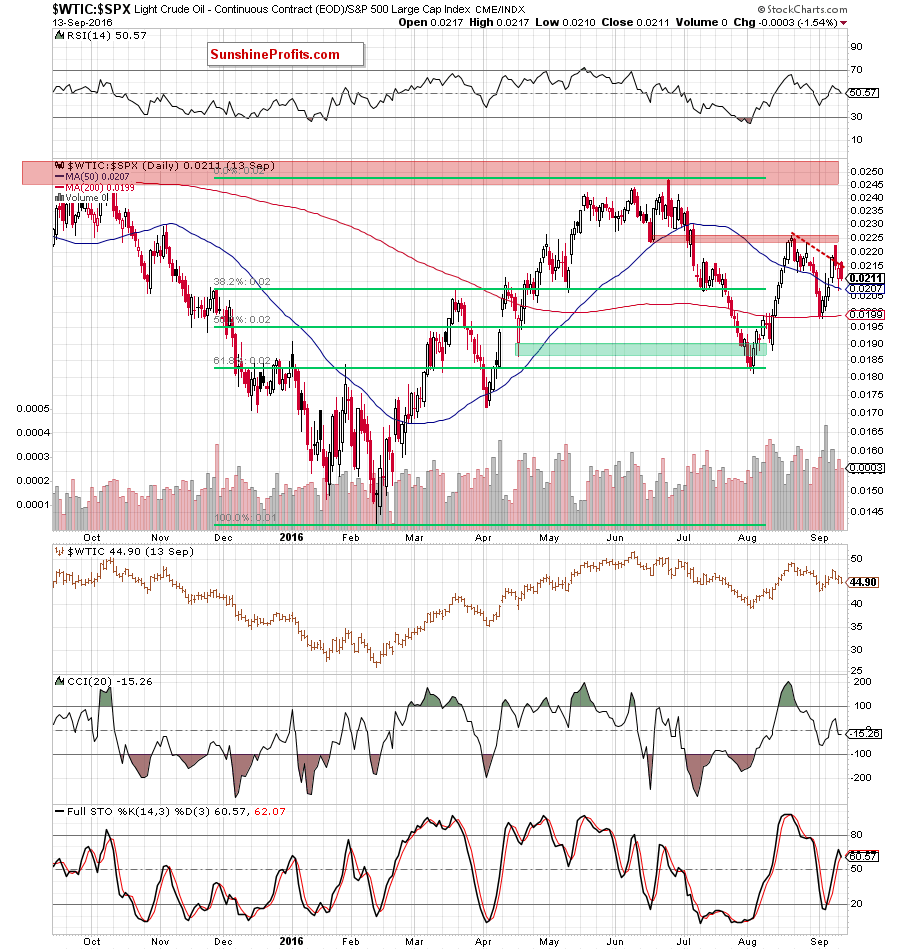
From the very short-term perspective, we see that the ratio bounced off the 200-day moving average and climbed above the red dashed declining resistance line based on the previous highs. However, as it turned out, this improvement was only temporary and the ratio declined sharply on Friday, invalidating earlier breakout. Although the ratio rebounded in recent days, we saw a decline and anther invalidation of the breakout above the red dashed line yesterday.
Such price action doesn’t bode well for the ratio, suggesting further deterioration in the coming days. In this case, we may see a drop even to the 200-day moving average and the Sep lows. At this point some of you may wonder when we can expect short-term improvement. In our opinion, higher values of the ratio will be more likely and reliable only if we see a breakout above the Aug high and the red resistance zone.
Non-USD Crude Oil Price
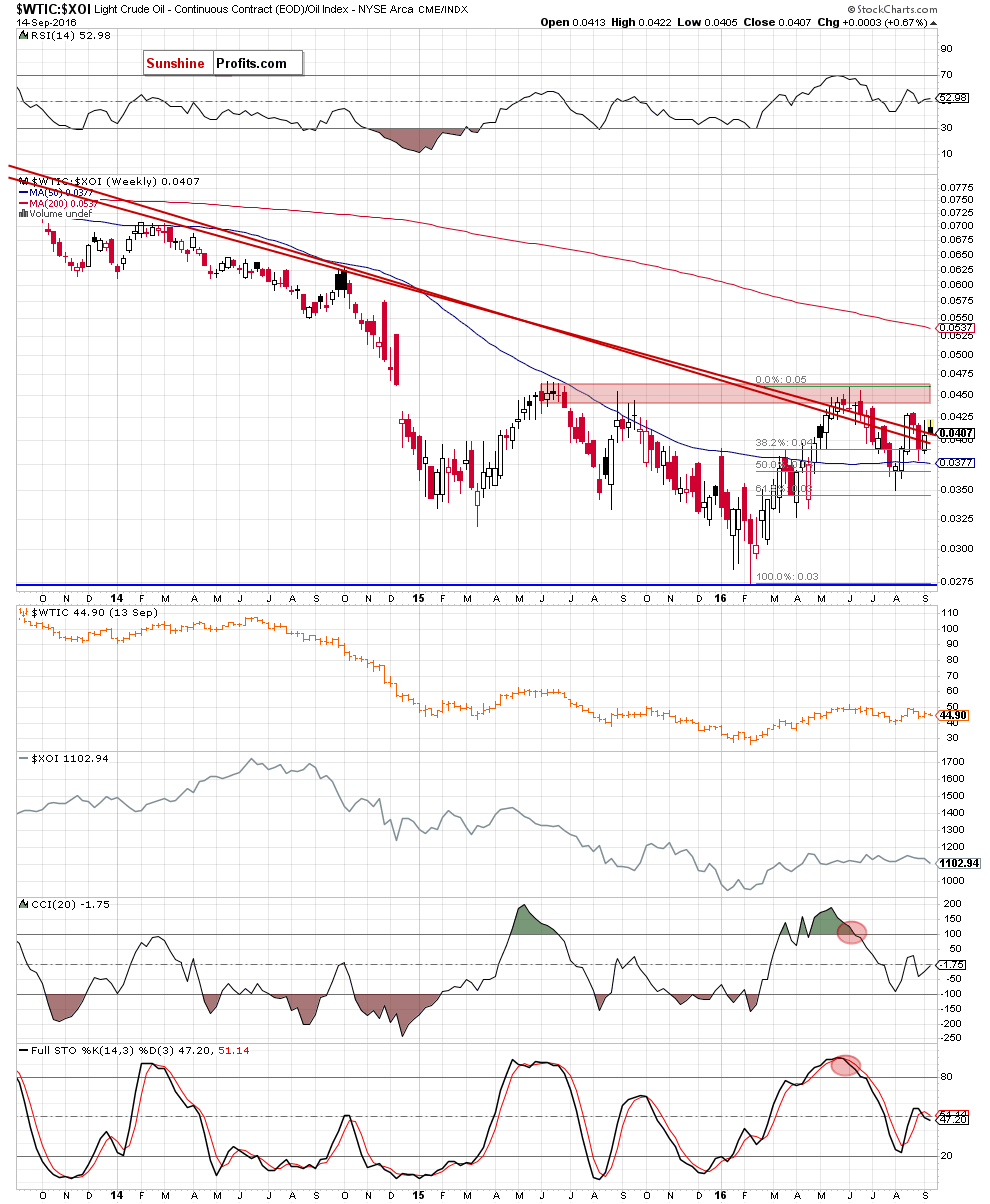
Know the situation for the above ratios, let’s move on to the non-USD (WTIC:UDN ratio) chart of crude oil. As a reminder, UDN is the symbol for the PowerShares DB US Dollar Index Bearish Fund, which moves in the exact opposite direction to the USD Index. Since the USD Index is a weighted average of the dollar's exchange rates with world's most important currencies, the WTIC:UDN ratio displays the value of crude oil priced in "other currencies".
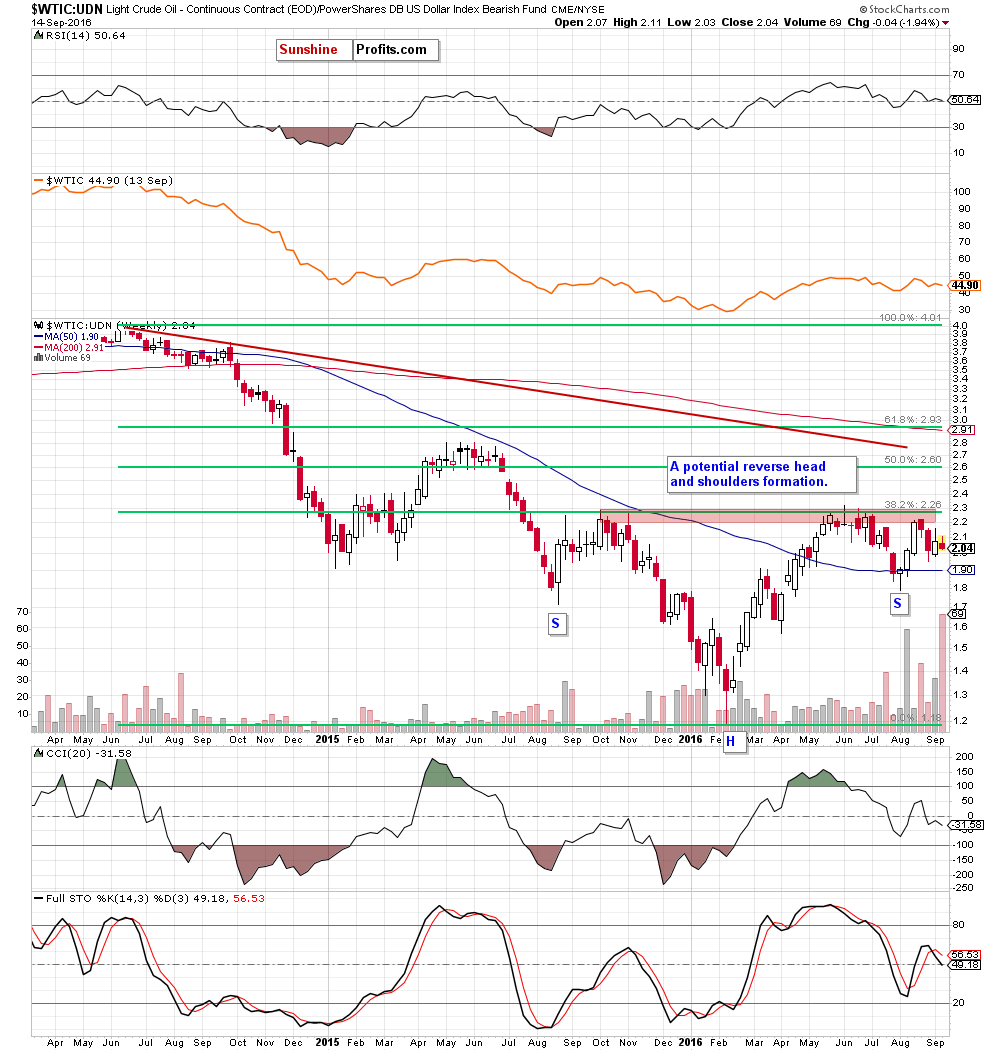
As you see on the weekly chart invalidation of the breakdown under the 50-week moving average in combination with a buy signal generated by the Stochastic Oscillator triggered an upward move, which took the ratio to the red resistance zone once again. From today’s point of view, we see that this area stopped rallies in Jun and Jul, which translated into another decline at the end of Aug. This means that even if the ratio extends gains from current levels, another sizable upward move will appear only if we see a breakout (confirmed by a weekly closure) above the key resistance – the red zone. However, taking into account a sell signal generated by the Stochastic Oscillator, we think that another downswing and a test of the 50-week moving average is qute likely in the coming week(s).
Scenarios
Just like a month ago, today’s Oil Investment Update includes scenarios of what could happen in the coming weeks. Naturally, we will continue to monitor the market in the coming days and if anything invalidates our long-term outlook we will send you an additional message.
- Bullish scenario
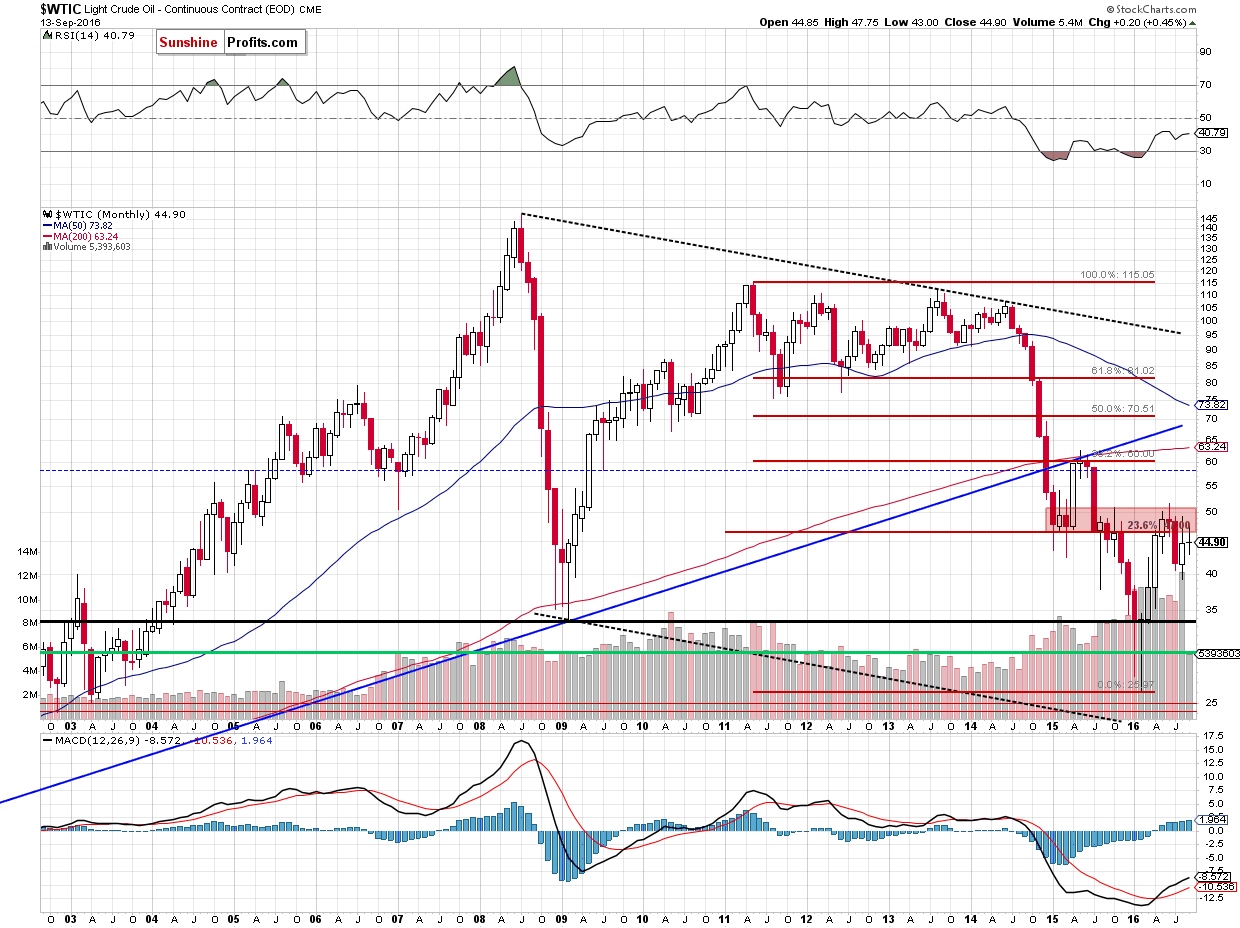
If crude oil extends gains and comes back above short-term resistance lines and the first resistance zone created by the late Aug highs, we’ll see a test of the strength of the barrier of $50. If oil bulls manage to push the commodity above the Jun high of $51.67, the next upside target would be even around $60-$62.58, where the 38.2% Fibonacci retracement (based on the entire 2011-2016 downward move), May and Jun 2015 highs are. - Bearish scenario
If the commodity drops under the green support zone created by the early Aug highs and the 61.8% Fibonacci retracement, we’ll see a drop to the lower border of the black declining trend channel or even to the green support zone created by the 50% Fibonacci retracement and the barrier of $40. If this area is broken, light crude may drop to the 61.8% Fibonacci retracement (around $36) or even to around $34.82-$35.24, where the next green support zone (created by the Jan high and Apr low) is.
Summary
Although crude oil increased to the Aug high of $49.36, the proximity to the barrier of $50 tempted oil bears to return to the market. In this environment, light crude gave up almost 62% of earlier upward move and slipped to the first short-term support zone. As you saw on the charts, another attempt to move higher (in the first half of Sep) resulted in another failure, which suggests that oil bulls may lose their strength. At the moment of writing these words, crude oil is after a breakout (above the upper line of the declining trend channel) and after a breakdown (below the rising support line based on Aug lows and the resistance line based on Aug and Sep highs) and the implications cancel each other out. The final effect is neutral and neither a long or short position seems to be justified – the risk associated with any of them doesn’t seem worth it. However, taking into account invalidation of breakouts above the resistance lines (based on the previous highs) in the case of the oil-to-oil stock and oil-to-stock ratios and the proximity to the key resistance zones seen on the monthly chart of the oil-to-gold ratio and the oil-to-silver ratio, it seems that crude oil will extend losses from current levels. How low can crude oil go? The next support level is provided by the 61.8% Fibonacci retracement level, but given the breakdown and invalidation of breakout above several above-mentioned levels, it seems that crude oil could slide all the way back to the rising black support line around $41.
Very short-term outlook: bearish
Short-term outlook: mixed
MT outlook: mixed
LT outlook: mixed
Trading position (our opinion): No positions justified from the risk/reward perspective.
This completes this month’s Oil Investment Update. Our next Oil Investment Update is scheduled for Friday, Oct 7, 2016. Oil Trading Alerts subscribers will additionally receive similar but shorter alerts on a daily basis (or more than once a day when the situation requires it). You – Oil Investment Updates subscribers – will receive short Investment Alert messages should the outlook for the medium or long term change before the next Update is posted.
Thank you.
Nadia Simmons
Forex & Oil Trading Strategist
Oil Investment Updates
Oil Trading Alerts

