

Briefly: in our opinion, full (150% of the regular position size) speculative short positions in mining stocks are justified from the risk/reward point of view at the moment of publishing this Alert. If the HUI Index is trading below 271 five minutes before the end of today's session, we will automatically view bigger positions (250% of the regular positions size) as justified (without an additional confirmation from us).
The key technical development in the precious metals sector this week continues to be HUI's invalidation of the breakout above the 2016 highs. It will be particularly interesting to see where it closes the week, as an invalidation in weekly closing terms will be a crystal-clear bearish confirmation.
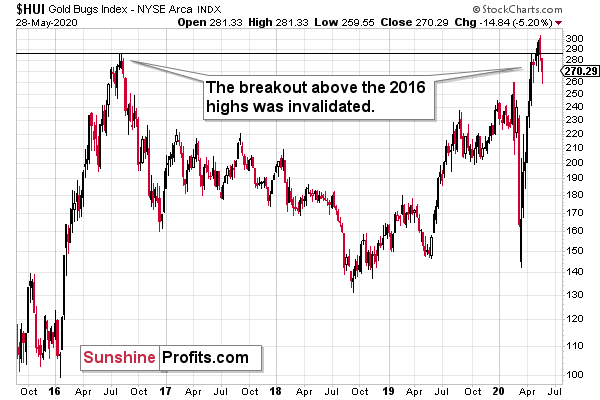
The HUI Index closed at about 270 yesterday, which is visibly below the highest weekly close of 2016 - the 278.61 level. However, since it was a weekly closing price, it should be broken in weekly closing terms. This makes today's closing price particularly important.
Today is not only the end of the week, but also the end of the month, which makes things even more interesting. The highest monthly closing price of 2016 was 274.32, which means that unless the HUI Index rallies today, the odds are that will see also an invalidation of the breakout in monthly closing prices.
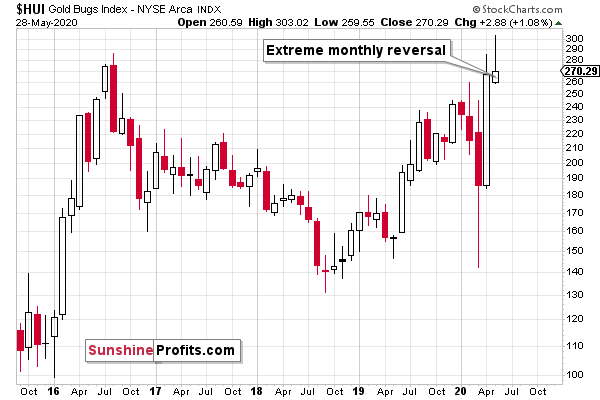
This would be a perfectly bearish sign, especially since the HUI Index has been forming an extremely clear monthly shooting star candlestick. If HUI declines today, it might change the name of the candlestick (to gravestone doji if the HUI declines to its monthly opening price), but not its implications. The only way for the HUI Index's chart not to have bearish implications, would be for it to rally strongly today.
Gold is up in today's pre-market trading, but given the way miners ignored yesterday's move higher in gold, the above doesn't have to translate into a rally in the miners, and even if it does, not necessarily into a substantial one.
To clarify, the HUI Index was down a bit, GDX was up a bit, while the GDXJ was practically flat.
Normally, one would expect miners to be up given GLD's close higher. Consequently, the lack of rally, and even a small decline in the HUI Index is a bearish sign.
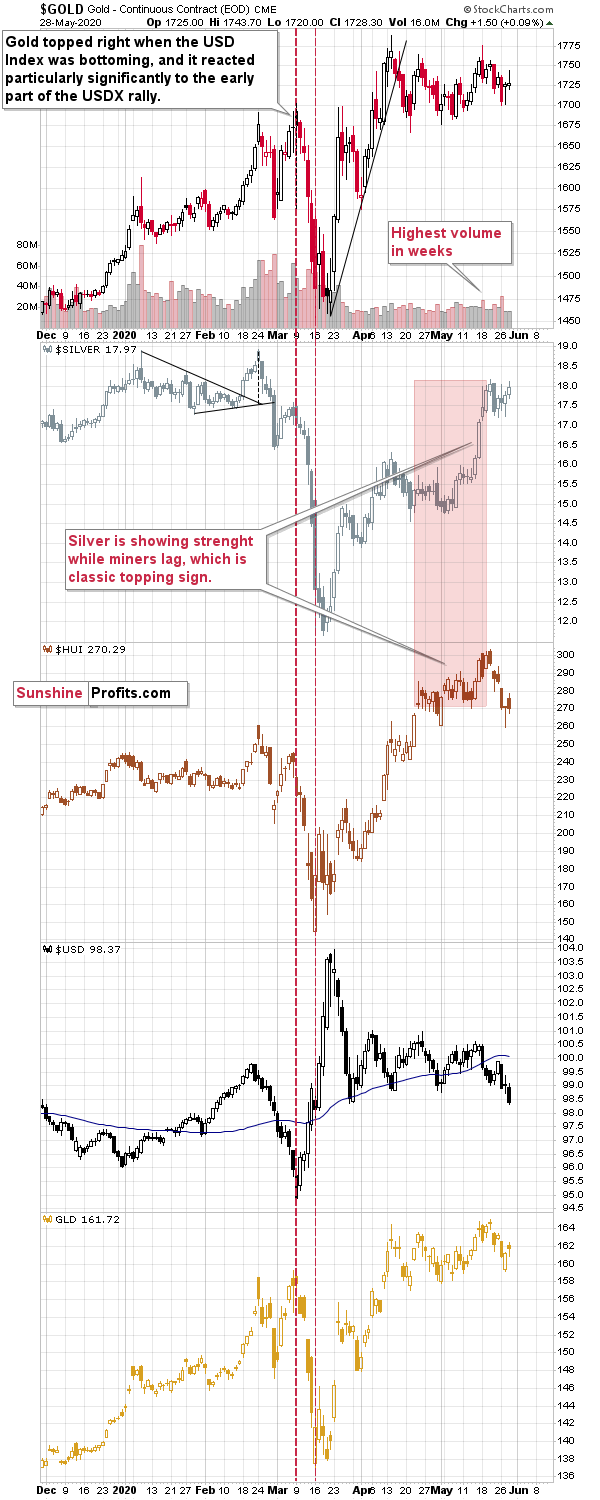
There are two more signs from the relative strength analysis, and they are both bearish for the PMs.
One thing is that gold didn't rally more given USD's breakdown below the late-March low, and the second thing is silver's very short-term outperformance.
Please take a look at the area marked with red. We had previously commented on it by saying that silver showed strength while miners lagged and that it was bearish. And what happened next? Silver is moving back and forth - outperforming gold, while both: gold, and gold miners are visibly lower.
While we're at it - we were asked how high would silver have to go for us to view such a move as bullish. There is no such price level as the context is too important in case of silver. If silver shoots up by $3 in a day without any change on the fundamental front, but at the same time gold does nothing and miners decline, it will not be a bullish factor, but a very strong bearish one. But if silver moves up by $2, while gold moves up as well and so do - strongly - miners, and the gold to silver ratio clearly breaks and moves significantly below the 100 level, it would be very bullish, and it might change the outlook.
In other words, our yesterday's comments on silver remain up-to-date:
The white metal is still showing strength on a very short-term basis, which further confirms the toppy nature of the most recent price moves. Silver tends to outperform at the very end of a given upswing, so we could even see more of that phenomenon - especially if the stock market moves even higher from here.
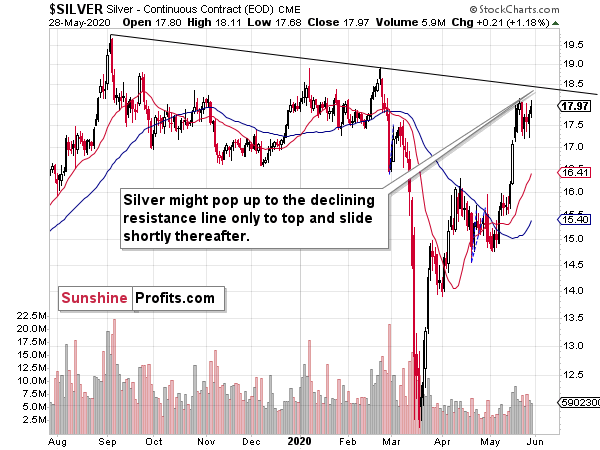
Silver is known (at least it should be known) for its fakeouts. Silver often breaks above certain resistance levels, only to invalidate these breakouts shortly thereafter. If silver's "breakout" is not accompanied by an analogous move in gold or miners, the odds are that it's a fakeout. The odds increase further if this action was preceded by a rally.
Therefore, if silver moves higher from here, and even breaks to new May highs, it might not be a bullish development at all. It could be a fakeout that only takes the white metal to about $18.50 or so - the declining resistance line based on the previous highs - and then starts the next huge downleg. Please keep in mind that silver already launched one huge slide from almost $19 this year, so another big move lower from these levels could definitely take place.
And what about gold's link with the USD Index? Please check how did the March slide start. It started with a decline in the USD Index to which gold reacted to a very limited extent. The USDX kept on sliding, while gold just moved to its previous highs and then invalidated this breakout. Gold miners were underperforming during this time and they didn't even move close to their previous highs.
That's similar to what we see right now, with the difference being that the moves are not as volatile. Well, it's no wonder that they aren't as volatile as back in March, the coronavirus scare was just starting, and now it's all known. While the economic damage is much greater than the market seems to appreciate, and in my opinion stocks are going to slide again, the emotional reaction is not as significant this time. This doesn't mean that the USD Index won't soar - I think that it will, but the intraday moves might not be as big as they were previously, at least initially.
Consequently, it might be useful to look at similarities while keeping the above difference in mind. Earlier this year, the USD Index broke below its 50-day moving average, then paused and then declined again for a few days. Then the decline ended, and the powerful rally started. That was the rally that triggered the biggest slides in PMs and miners.
Now, the USD Index is also after a breakdown below the 50-day moving average, and after a pause. It's now declining and today is the fourth day of the decline after the pause. That's when - in analogy to what happened in March - we can more or less expect the bottom to form.
Interestingly, back in March, the USDX moved below the previous strong support level (previous low) for just one day - and gold plunged when the USDX invalidated this breakdown. What level might the USDX break below this time? And then invalidate such breakdown?
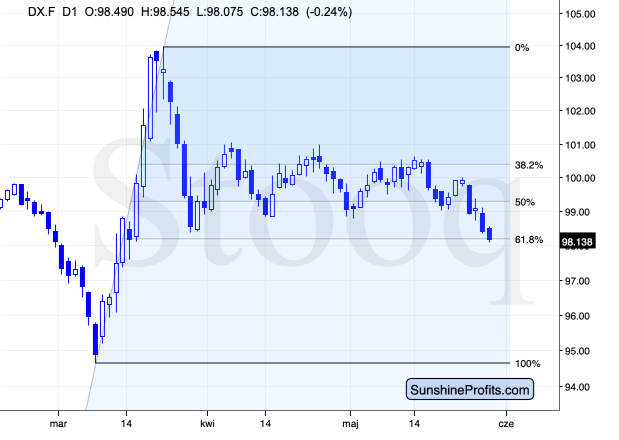
The 61.8% Fibonacci retracement level serves as an excellent support level. It's slightly above the 98 level for the USDX futures, and it was already reached today.
So, will we see a temporary move lower today in the USDX that would then be invalidated as gold plunges? That's what the weak performance of mining stocks might be telling us...
Summary
Summing up, despite the very recent moves higher, especially in silver, the outlook for the precious metals market is bearish for the next few weeks, and it's very bullish for the following months. Even if gold, silver, and mining stocks are not going to move to new 2020 lows, they are still likely to decline visibly when the USD Index soars. Based on silver's outperformance and the verification of the breakout in the gold to silver ratio by the move back to the 100 level, and invalidation of gold stocks' breakout above their 2016 high in intraday and closing price terms, it seems that the short-term upswing has already ended.
After the sell-off (that takes gold below $1,400), we expect the precious metals to rally significantly. The final decline might take as little as 1-3 weeks, so it's important to stay alert to any changes.
Most importantly - stay healthy and safe. We made a lot of money on the March decline and the subsequent rebound (its initial part) price moves (and we'll likely make much more in the following weeks and months), but you have to be healthy to really enjoy the results.
As always, we'll keep you - our subscribers - informed.
To summarize:
Trading capital (supplementary part of the portfolio; our opinion): Full speculative short positions (150% of the full position) in mining stocks is justified from the risk to reward point of view with the following binding exit profit-take price levels. If the HUI Index is trading below 271 five minutes before the end of today's session, we will automatically view bigger positions (250% of the regular positions size) as justified (without an additional confirmation from us).
Senior mining stocks (price levels for the GDX ETF): binding profit-take exit price: $10.32; stop-loss: none (the volatility is too big to justify a SL order in case of this particular trade); binding profit-take level for the DUST ETF: $231.75; stop-loss for the DUST ETF: none (the volatility is too big to justify a SL order in case of this particular trade)
Junior mining stocks (price levels for the GDXJ ETF): binding profit-take exit price: $9.57; stop-loss: none (the volatility is too big to justify a SL order in case of this particular trade); binding profit-take level for the JDST ETF: $284.25; stop-loss for the JDST ETF: none (the volatility is too big to justify a SL order in case of this particular trade)
For-your-information targets (our opinion; we continue to think that mining stocks are the preferred way of taking advantage of the upcoming price move, but if for whatever reason one wants / has to use silver or gold for this trade, we are providing the details anyway. In our view, silver has greater potential than gold does):
Silver futures downside profit-take exit price: $8.58 (the downside potential for silver is significant, but likely not as big as the one in the mining stocks)
Gold futures downside profit-take exit price: $1,382 (the target for gold is least clear; it might drop to even $1,170 or so; the downside potential for gold is significant, but likely not as big as the one in the mining stocks or silver)
Long-term capital (core part of the portfolio; our opinion): No positions (in other words: cash
Insurance capital (core part of the portfolio; our opinion): Full position
Whether you already subscribed or not, we encourage you to find out how to make the most of our alerts and read our replies to the most common alert-and-gold-trading-related-questions.
Please note that the in the trading section we describe the situation for the day that the alert is posted. In other words, it we are writing about a speculative position, it means that it is up-to-date on the day it was posted. We are also featuring the initial target prices, so that you can decide whether keeping a position on a given day is something that is in tune with your approach (some moves are too small for medium-term traders and some might appear too big for day-traders).
Plus, you might want to read why our stop-loss orders are usually relatively far from the current price.
Please note that a full position doesn't mean using all of the capital for a given trade. You will find details on our thoughts on gold portfolio structuring in the Key Insights section on our website.
As a reminder - "initial target price" means exactly that - an "initial" one, it's not a price level at which we suggest closing positions. If this becomes the case (like it did in the previous trade) we will refer to these levels as levels of exit orders (exactly as we've done previously). Stop-loss levels, however, are naturally not "initial", but something that, in our opinion, might be entered as an order.
Since it is impossible to synchronize target prices and stop-loss levels for all the ETFs and ETNs with the main markets that we provide these levels for (gold, silver and mining stocks - the GDX ETF), the stop-loss levels and target prices for other ETNs and ETF (among other: UGLD, DGLD, USLV, DSLV, NUGT, DUST, JNUG, JDST) are provided as supplementary, and not as "final". This means that if a stop-loss or a target level is reached for any of the "additional instruments" (DGLD for instance), but not for the "main instrument" (gold in this case), we will view positions in both gold and DGLD as still open and the stop-loss for DGLD would have to be moved lower. On the other hand, if gold moves to a stop-loss level but DGLD doesn't, then we will view both positions (in gold and DGLD) as closed. In other words, since it's not possible to be 100% certain that each related instrument moves to a given level when the underlying instrument does, we can't provide levels that would be binding. The levels that we do provide are our best estimate of the levels that will correspond to the levels in the underlying assets, but it will be the underlying assets that one will need to focus on regarding the signs pointing to closing a given position or keeping it open. We might adjust the levels in the "additional instruments" without adjusting the levels in the "main instruments", which will simply mean that we have improved our estimation of these levels, not that we changed our outlook on the markets. We are already working on a tool that would update these levels on a daily basis for the most popular ETFs, ETNs and individual mining stocks.
Our preferred ways to invest in and to trade gold along with the reasoning can be found in the how to buy gold section. Additionally, our preferred ETFs and ETNs can be found in our Gold & Silver ETF Ranking.
As a reminder, Gold & Silver Trading Alerts are posted before or on each trading day (we usually post them before the opening bell, but we don't promise doing that each day). If there's anything urgent, we will send you an additional small alert before posting the main one.
Thank you.
Sincerely,
Przemyslaw Radomski, CFA
Editor-in-chief, Gold & Silver Fund Manager

