

Briefly: In our opinion, full (200% of the regular size of the position) speculative short positions in gold, silver and mining stocks is justified from the risk/reward perspective at the moment of publishing this alert.
There were myriads of signals pointing to lower precious metals prices and… Nothing happened. If a decline was supposed to happen but it didn’t, can this be viewed as a bullish sign – a kind of invalidation?
Not really. As you will see on the below charts, yesterday’s pause didn’t really change anything – the decline was most likely simply delayed by a day. It could be delayed even further – until Wednesday’s Fed meeting. The uncertainty could be too high beforehand for any sizable decline to be seen. However, in this case, and in light of all the bearish factors that we discussed yesterday, we could see a big “catch up” in which metals would decline strongly in a volatile manner.
It may seem unbelievable in light of all the recent boring sessions, but this already happened. Please take a look below for the details (chart courtesy of http://stockcharts.com).
Gold Verifies the Breakdown
In yesterday’s alert we discussed the analogy to the “triple top and the one extra pop-up” by writing the following:
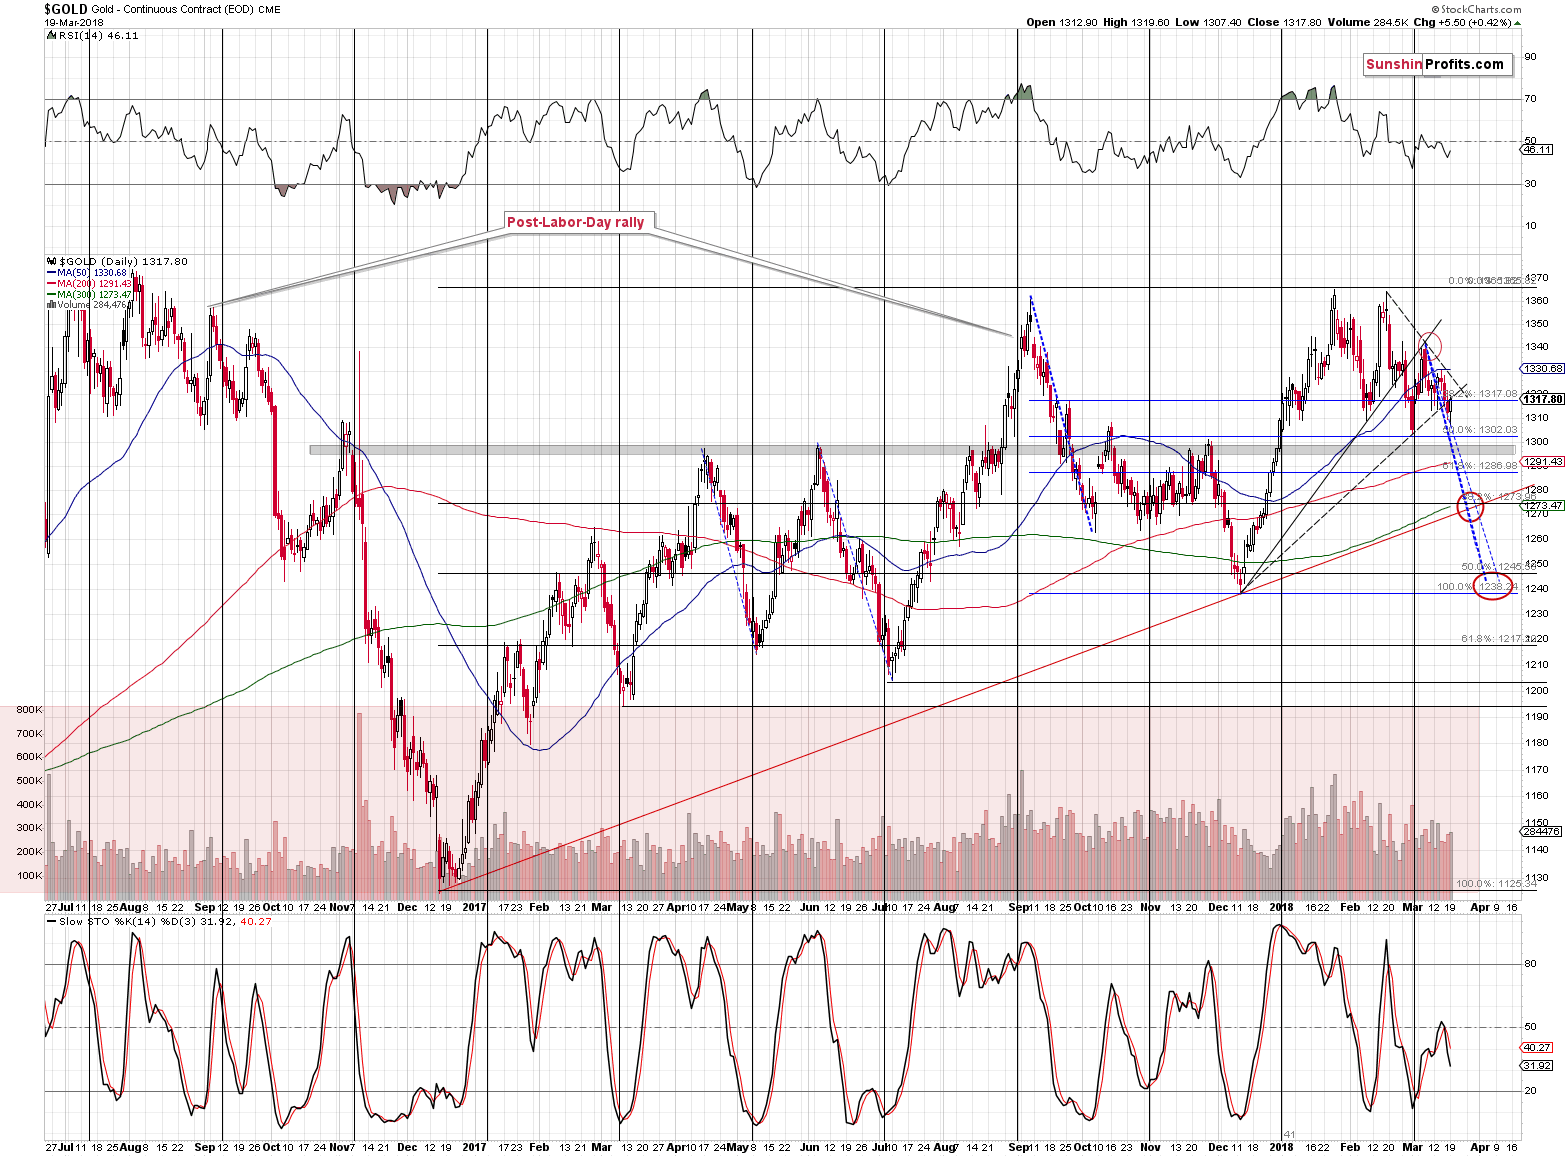
First of all, the 2012-2013 decline and the 2016 decline have both started in the similar way. Similarly to what we recently described in case of the euro, gold formed a triple top (each top being below the previous one) that was followed by an extra move up.
In both cases, after the breakdown below the previous low (the low that preceded the extra move up) gold continued to decline until it doubled the size of the decline between the first top and the final low. It’s easier to understand the relationship by looking at it on the above chart. The 50% retracement in early 2013 and in mid-2016 is the middle of the pattern. The 0% on the retracement tool is the bottom that one can predict and the 100% on the retracement tool is the first top.
Why is this interesting at this time? Because that’s exactly what gold formed recently.
The particularly interesting thing is how gold declined. In early October, 2016, after months of back and forth movement above $1,300, gold broke below the previous local lows and declined over $40 in just one day. Can we see something similar also this time? Of course, after all, history tends to repeat itself to a considerable extent.
As far as yesterday’s price performance is concerned, please note that gold simply moved back to the previously broken rising support line and didn’t close back above it. The breakdown is being verified, which doesn’t have bullish implications.
Silver Pauses within Self-similar Pattern
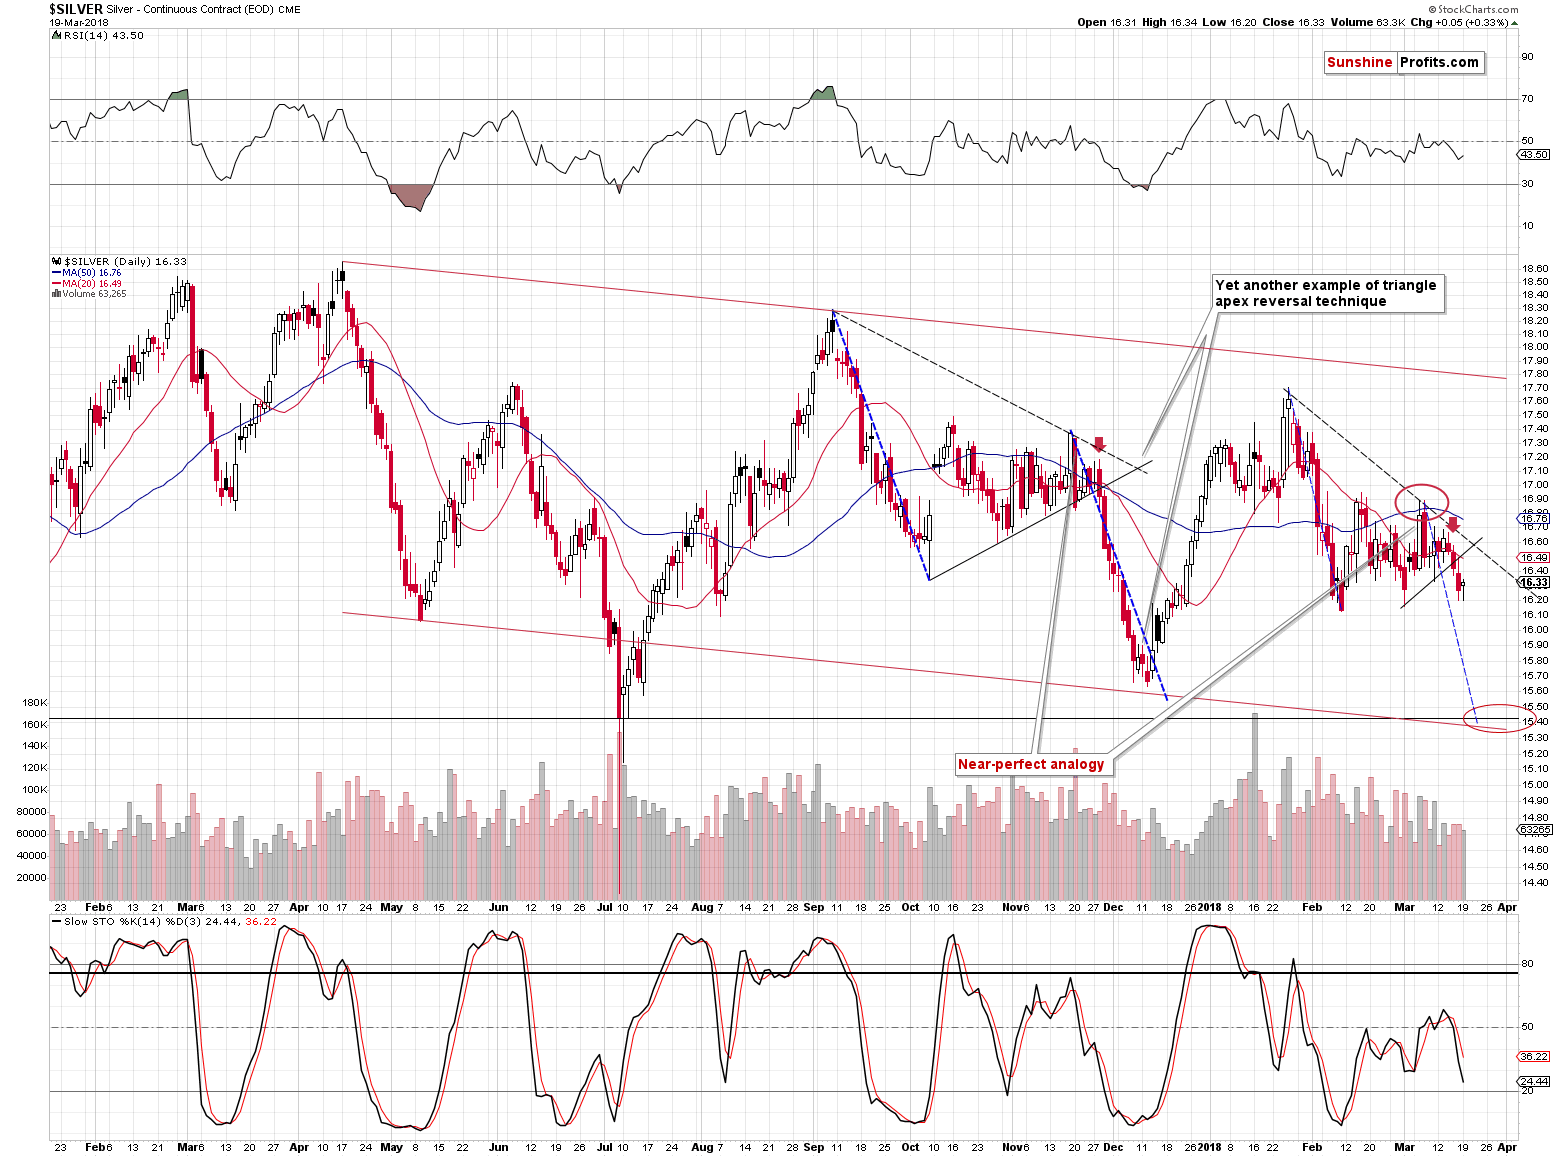
In the case of silver, we wrote that silver was about to move to $15.30 - $15.50, likely before the end of March. Perhaps even this week. That was based on the self-similar pattern in the white metal and the breakdown below the rising support line.
Did yesterday’s pause invalidate any of the above? Not at all. Silver simply paused and it didn’t invalidate anything regarding the analogy. Back in late November 2017, silver also moved higher after the initial slide. It hadn’t moved high enough to end the session above the previous day’s close, but still, the pause was visible. Consequently, just because this time we saw a pause that took silver higher, the situation didn’t really improve.
It still seems that a sizable decline will be seen later this month.
Gold Stocks’ Confirm Breakdown to New 2018 Low
In yesterday’s alert, we wrote the following:
What a boring session, nothing happened… Right?
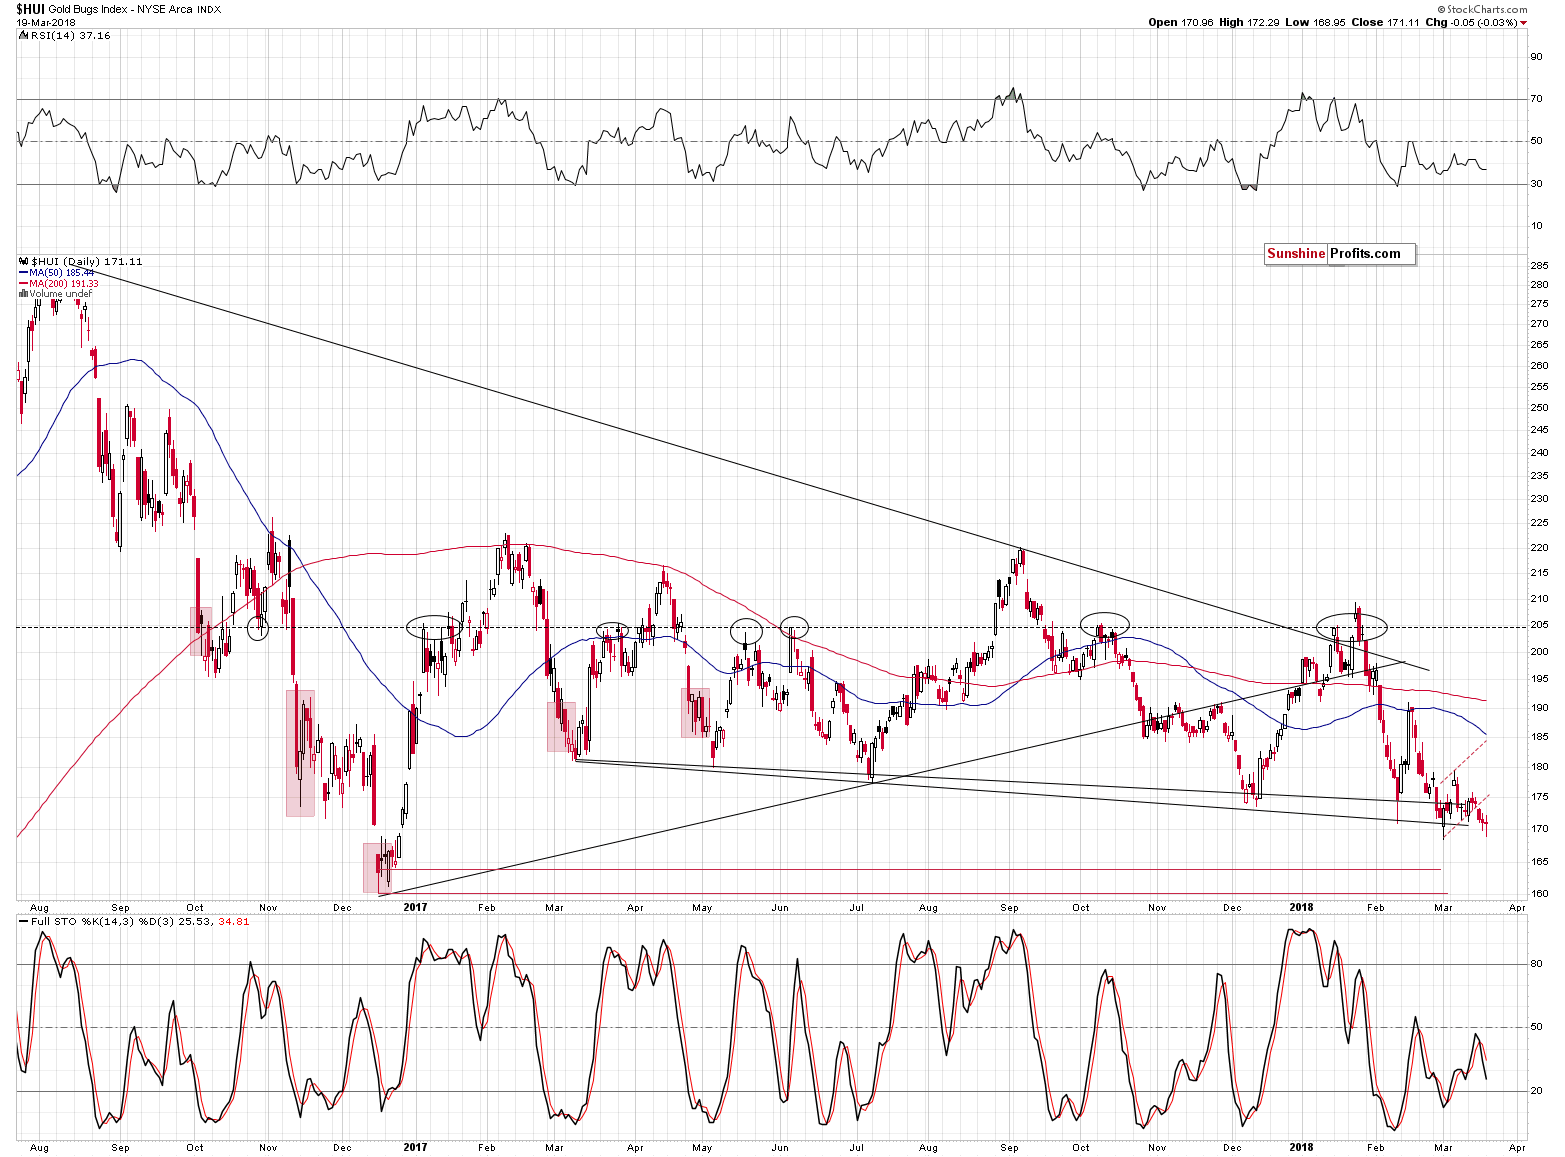
Wrong. That was the session that confirmed the breakdown below the previous 2018 low. That was the second close below it and we usually want three sessions below a certain level to confirm the breakdown, but weekly closes “count more”, so the breakdown is almost confirmed now. The implications are clearly bearish. The same goes for the clear sell sign from the Stochastic indicator.
So much for the “gold miners are going to soar in the first quarter of the year as they always do” prediction that we all read at the end of the previous year and earlier this year.
In the previous alerts, we wrote that gold miners could move somewhat higher, but that they were likely to underperform during the upswing, so the move was likely to be rather insignificant. Indeed, the HUI Index only managed to move a bit above 175 and then declined once again. Moreover, during the upswing, it didn’t close back above the 2017 low (in terms of closing prices). This makes the current breakdown below the previous lows even more important.
Yesterday was the third subsequent day on which the HUI Index closed below the February 2018 low. This means that the breakdown is now fully confirmed and the bearish implications are fully present.
Moreover, please note that while gold moved a few dollars higher, gold stocks moved insignificantly – but still – lower. That’s yet another sign of the underperformance of the latter and a bearish sign for the short term.
Summary
Summing up, it seems that the first part of the big 2018 decline in the precious metals is already underway and we might see the next local bottom sometime this week, even though so far gold and silver are not doing much. The self-similarity in silver and the breakdown to new 2018 lows in gold stocks both suggest that the wait for start of the decline is almost or completely over. Based on the way gold and silver declined in the past, it seems that the next 2-5 trading days will be quite volatile and that we’ll see new 2018 lows shortly.
The volatility, however, may be affected by tomorrow’s rate decision and the FOMC press conference – we could see it beforehand or shortly thereafter. Either way, the outlook – regarding the big moves – remains bearish. There were quite a few cases when gold and silver rallied right before the rate announcement and/or during the conference only to disappoint later. This could be seen again, but it doesn’t seem likely enough for us to adjust our positions based on this possibility.
As always, we will keep you – our subscribers – informed.
To summarize:
Trading capital (supplementary part of the portfolio; our opinion): Full short positions (200% of the full position) in gold, silver and mining stocks are justified from the risk/reward perspective with the following stop-loss orders and initial target price levels:
- Gold: initial target price: $1,218; stop-loss: $1,382; initial target price for the DGLD ETN: $53.98; stop-loss for the DGLD ETN $37.68
- Silver: initial target price: $14.63; stop-loss: $17.33; initial target price for the DSLV ETN: $33.88; stop-loss for the DSLV ETN $21.48
- Mining stocks (price levels for the GDX ETF): initial target price: $19.22; stop-loss: $23.54; initial target price for the DUST ETF: $39.88; stop-loss for the DUST ETF $21.46
In case one wants to bet on junior mining stocks' prices (we do not suggest doing so – we think senior mining stocks are more predictable in the case of short-term trades – if one wants to do it anyway, we provide the details), here are the stop-loss details and initial target prices:
- GDXJ ETF: initial target price: $27.82; stop-loss: $36.14
- JDST ETF: initial target price: $94.88 stop-loss: $41.86
Long-term capital (core part of the portfolio; our opinion): No positions (in other words: cash)
Insurance capital (core part of the portfolio; our opinion): Full position
Important Details for New Subscribers
Whether you already subscribed or not, we encourage you to find out how to make the most of our alerts and read our replies to the most common alert-and-gold-trading-related-questions.
Please note that the in the trading section we describe the situation for the day that the alert is posted. In other words, it we are writing about a speculative position, it means that it is up-to-date on the day it was posted. We are also featuring the initial target prices, so that you can decide whether keeping a position on a given day is something that is in tune with your approach (some moves are too small for medium-term traders and some might appear too big for day-traders).
Plus, you might want to read why our stop-loss orders are usually relatively far from the current price.
Please note that a full position doesn’t mean using all of the capital for a given trade. You will find details on our thoughts on gold portfolio structuring in the Key Insights section on our website.
As a reminder – “initial target price” means exactly that – an “initial” one, it’s not a price level at which we suggest closing positions. If this becomes the case (like it did in the previous trade) we will refer to these levels as levels of exit orders (exactly as we’ve done previously). Stop-loss levels, however, are naturally not “initial”, but something that, in our opinion, might be entered as an order.
Since it is impossible to synchronize target prices and stop-loss levels for all the ETFs and ETNs with the main markets that we provide these levels for (gold, silver and mining stocks – the GDX ETF), the stop-loss levels and target prices for other ETNs and ETF (among other: UGLD, DGLD, USLV, DSLV, NUGT, DUST, JNUG, JDST) are provided as supplementary, and not as “final”. This means that if a stop-loss or a target level is reached for any of the “additional instruments” (DGLD for instance), but not for the “main instrument” (gold in this case), we will view positions in both gold and DGLD as still open and the stop-loss for DGLD would have to be moved lower. On the other hand, if gold moves to a stop-loss level but DGLD doesn’t, then we will view both positions (in gold and DGLD) as closed. In other words, since it’s not possible to be 100% certain that each related instrument moves to a given level when the underlying instrument does, we can’t provide levels that would be binding. The levels that we do provide are our best estimate of the levels that will correspond to the levels in the underlying assets, but it will be the underlying assets that one will need to focus on regarding the signs pointing to closing a given position or keeping it open. We might adjust the levels in the “additional instruments” without adjusting the levels in the “main instruments”, which will simply mean that we have improved our estimation of these levels, not that we changed our outlook on the markets. We are already working on a tool that would update these levels on a daily basis for the most popular ETFs, ETNs and individual mining stocks.
Our preferred ways to invest in and to trade gold along with the reasoning can be found in the how to buy gold section. Additionally, our preferred ETFs and ETNs can be found in our Gold & Silver ETF Ranking.
As a reminder, Gold & Silver Trading Alerts are posted before or on each trading day (we usually post them before the opening bell, but we don't promise doing that each day). If there's anything urgent, we will send you an additional small alert before posting the main one.
=====
Latest Free Trading Alerts:
The FOMC members will gather today for a two-day meeting. It will be the most important event this week, since Powell will chair the meeting for the first time. Gold investors want to get to know him better as the uncertainty makes them a bit nervous. What should we expect from the new Fed Chair?
Please Introduce Yourself, Mr. Powell. Gold Awaits You
=====
Hand-picked precious-metals-related links:
PRECIOUS-Gold edges lower ahead of Fed rate decision
=====
In other news:
Stocks Struggle After Tech Selloff; Dollar Rises: Markets Wrap
The Fed Is Signaling More Than 3 Rate Hikes This Year
UK inflation slows in February as Brexit hit to pound fades
How economies could insure themselves against the bad times
President Trump Bans U.S. Citizens From Buying Venezuelan Cryptocurrency Petro
Oil rises to March high on Middle East tensions, Venezuela concerns
=====
Thank you.
Sincerely,
Przemyslaw Radomski, CFA
Founder, Editor-in-chief, Gold & Silver Fund Manager
Gold & Silver Trading Alerts
Forex Trading Alerts
Oil Investment Updates
Oil Trading Alerts

