

Briefly: in our opinion, full (300% of the regular position size) speculative short positions in junior mining stocks are justified from the risk/reward point of view at the moment of publishing this Alert.
In yesterday’s analysis, I emphasized that a small correction here is possible and that it won’t change anything with regard to the outlook. Indeed, we saw a small correction, and it didn’t change the outlook.
Since the prices are practically where they were 24 hours ago, I won’t write about technicals today, simply because yesterday’s analysis remains fully up-to-date – if you haven’t read it yet, I invite you to do so today.
Instead, I will focus on replying to questions that I received recently and on the fundamental part. Let’s start with the latter.
Real Problems
With gold and mining stocks enjoying oversold bounces on Sep. 27, the pace of the PMs’ recent drawdowns was poised to normalize at some point. Also, since asset prices don’t move in a straight line, daily declines of 1% or more often result in countertrend rallies along the way.
However, with the PMs’ medium-term technical and fundamental outlooks supremely ominous, a hawkish Fed, higher real yields, and a stronger USD Index are poised to inflict more pain. To explain, I wrote on Apr. 11:
With real interest rates poised to turn positive in the coming months, gold should suffer profoundly once its war premiums unravel.
The historical fundamental playbook shows:
- When a crisis erupts, the Fed cuts interest rates and commences QE;
- Real yields turn deeply negative;
- Gold rallies sharply;
- The Fed normalizes monetary policy, real yields surge, and gold plunges.
Please see below:
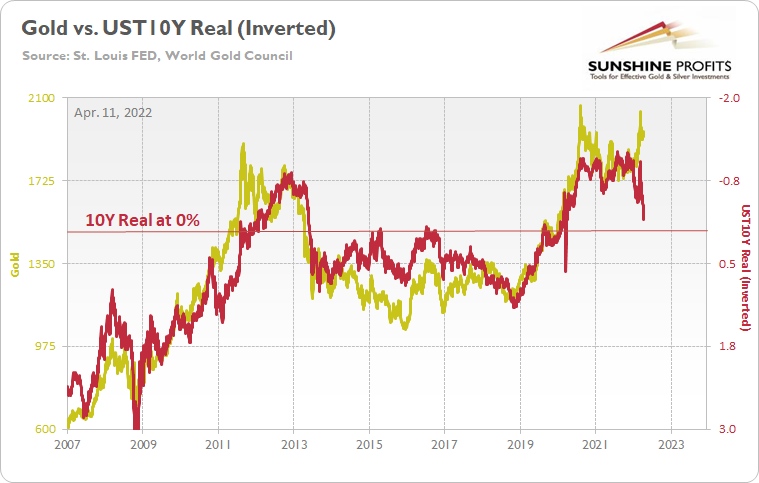
To explain, the gold line above tracks the price tallied by the World Gold Council, while the red line above tracks the inverted U.S. 10-Year real yield. For context, inverted means that the latter's scale is flipped upside down and that a rising red line represents a falling U.S. 10-Year real yield, while a falling red line represents a rising U.S. 10-Year real yield.
Moreover, while I've shown variations of this chart before, the long-term implications are profound. For example, if you analyze the left side of the chart, you can see that the U.S. 10-Year real yield soared and gold plunged during the global financial crisis (GFC). However, when the Fed launched QE and the U.S. 10-Year real yield sank to an all-time low, gold hit a new all-time high along the way.
Furthermore, the current situation is a spitting image. When Fed Chairman Jerome Powell performed a dovish pivot in late 2018, the U.S. 10-Year real yield suffered. Then, when the Fed fired its liquidity bazooka in March 2020, it pushed the metric to another all-time low. And surprise, surprise, gold hit another all-time high.
However, we're now in stage four of the historical fundamental playbook. With the Fed normalizing policy, the U.S. 10-Year real yield has surged in recent weeks. Moreover, the Fed needs to push the metric above 0% to curb inflation.
To that point, with long-term Treasuries continuing their sell-offs on Sep. 27, the U.S. 10-Year Treasury yield closed at another 2022 high of 3.97%.
Please see below:
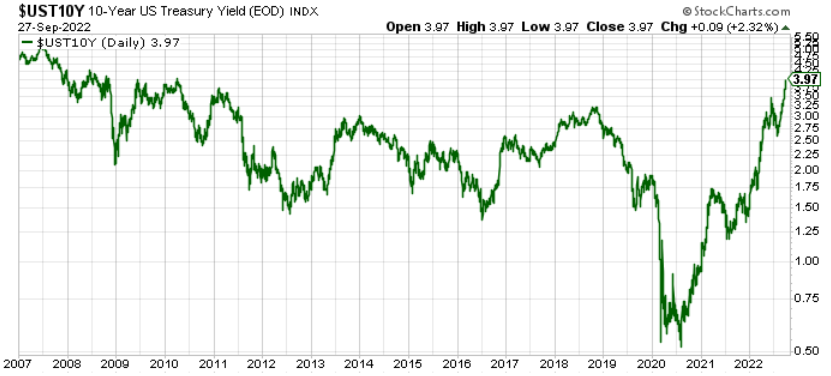
More importantly, the U.S. 10-Year real yield ended the Sep. 27 session at 1.64%, its highest level since 2010. Therefore, my prediction has proved prescient, even though gold has been a relative outperformer amid the chaos.
Please see below:
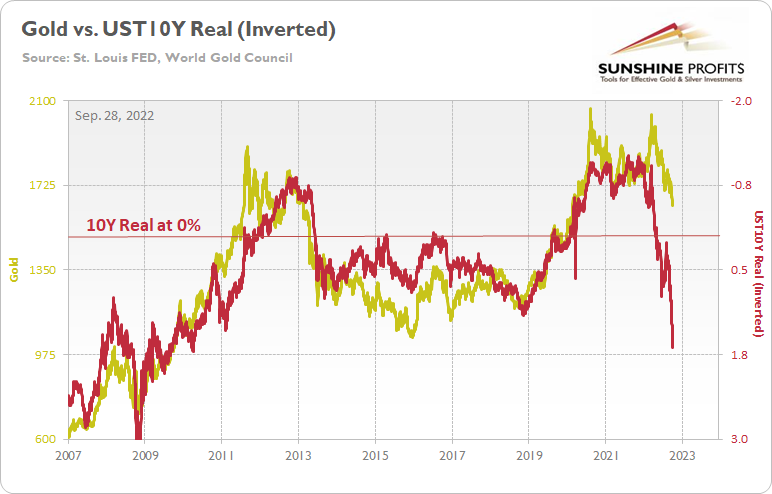
To explain, the U.S. 10-Year real yield is at its highest level in a decade-plus, while gold is relatively uplifted. Furthermore, a U.S. 10-Year real yield of 0% implies a gold price of $1,500, while the current reading of 1.64% should have gold south of $1,300.
So, what gives?
Well, for one, it’s not uncommon for assets to operate with a lag, meaning that gold will reconnect with the U.S. 10-Year real yield at some point, only the timing remains uncertain. As evidence, remember when I presented this chart throughout 2021 and 2022?
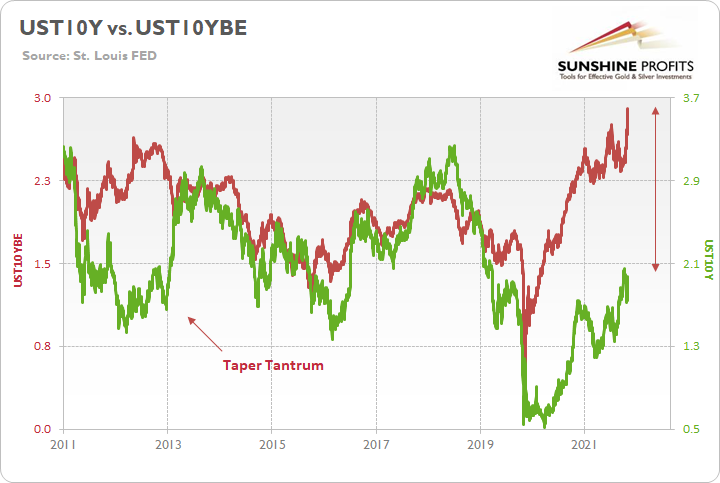
To explain, the green line above tracks the U.S. 10-Year Treasury yield, while the red line above tracks the U.S. 10-Year breakeven inflation rate. The unprecedented gap on the right side of the chart shows how a low nominal rate (the green line) and a high breakeven rate (the red line) created a major imbalance and pushed the U.S. 10-Year real yield into deeply negative territory. For context, the latter sank to an all-time low of -1.17% in August 2021 and hit -1.04% on Mar. 8 during the Russia/Ukraine conflict.
However, significant imbalances don’t last forever. In fact, if you analyze the middle of the chart, you can see that the two lines reconnected after the 2013 taper tantrum and remained in contact for years after that. Therefore, when the U.S. 10-Year real yield hit 0% in April 2022, the reconnection was complete, and the 2020-2022 imbalance was erased.
As such, we find ourselves in an identical situation now. While gold has outperformed the U.S. 10-Year real yield, the pair should reconnect once again; and with the Fed forced to play catch-up due to 40+-year high inflation, gold is much more likely to collapse than the U.S. 10-Year real yield. Remember, I wrote the Fed needs to push the metric above 0% to curb inflation.
However, there is no magic real yield that sinks inflation. In reality, the Fed needs to keep pushing the metric higher until progress materializes. Moreover, I noted that Powell understands this and made the point for me during his June FOMC press conference.
Please see below:
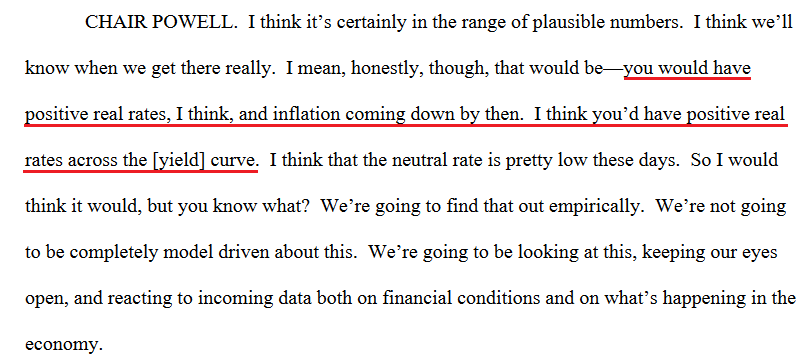 Source: U.S. Fed
Thus, while Powell has achieved his objective of “positive real rates across the [yield] curve,” it only matters if real rates are high enough to reduce demand and alleviate inflation. If not, they need to go higher.
To that point, with the Cleveland Fed projecting the headline and core Consumer Price Indexes (CPI) to rise by 8.20% and 6.64% year-over-year (YoY) in September, the metrics are nowhere near normalized. As a result, the U.S. 10-Year real yield has the wind at its back, and gold should fall to restore the imbalance.
Please see below:
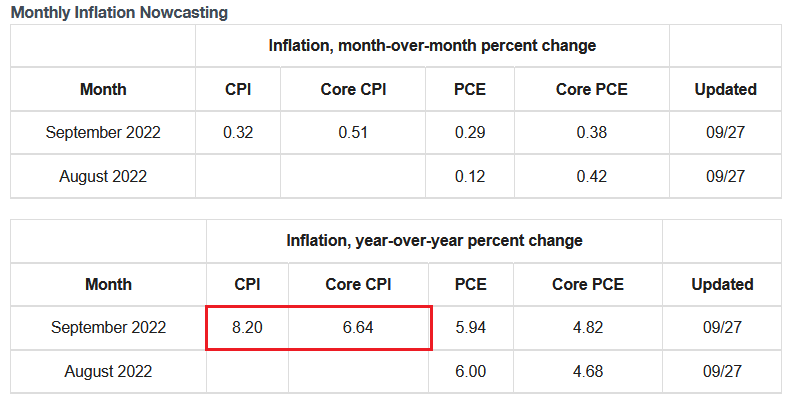 Source: Cleveland Fed
Also, please note that while gold has showcased immense resiliency in the face of elevated real yields and a soaring USD index, the GDXJ ETF hasn’t been so lucky.
Please see below:
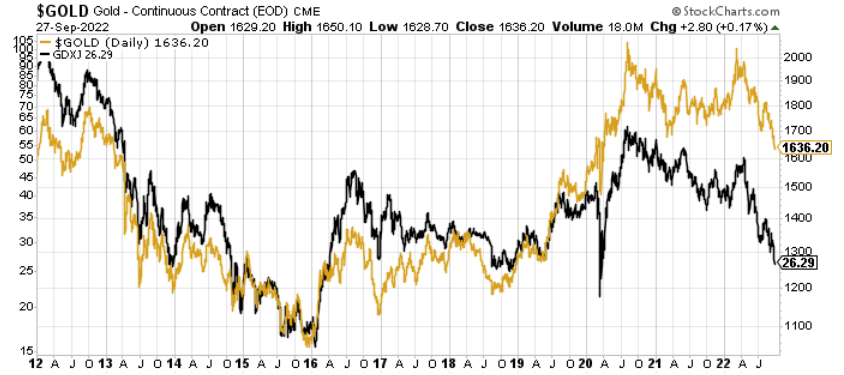
To explain, the gold line above tracks the gold futures price, while the black line above tracks the GDXJ ETF. If you analyze the relationship, you can see that the pair remained close pre-pandemic. Conversely, with the junior miners materially underperforming gold post-pandemic, shorting the GDXJ ETF has proven profoundly wise and lucrative, as the junior miners have followed the real-yield roadmap to a greater extent.
In addition, the USD Index paints a similar portrait.
Please see below:
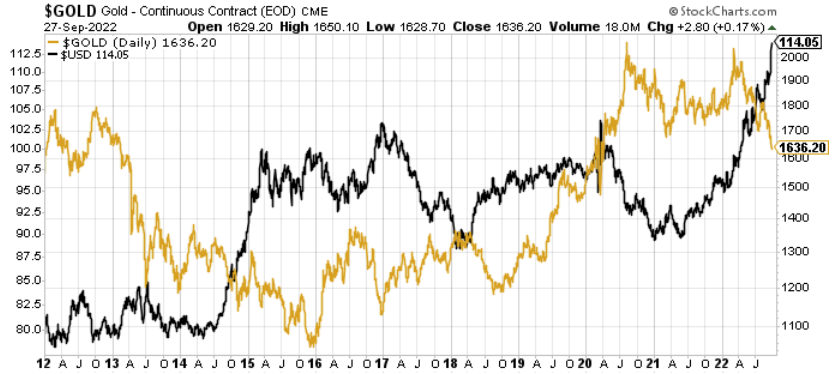
To explain, the gold line above tracks the gold futures price, while the black line above tracks the USD Index. If you analyze the middle of the chart, you can see that when the USD Index hit its ~2017 high, gold sank below $1,200.
However, while the USD Index closed well above its ~2017 high on Sep. 27, the yellow metal is much higher.
In contrast, the GDXJ ETF’s price action has been more formulaic.
Please see below:
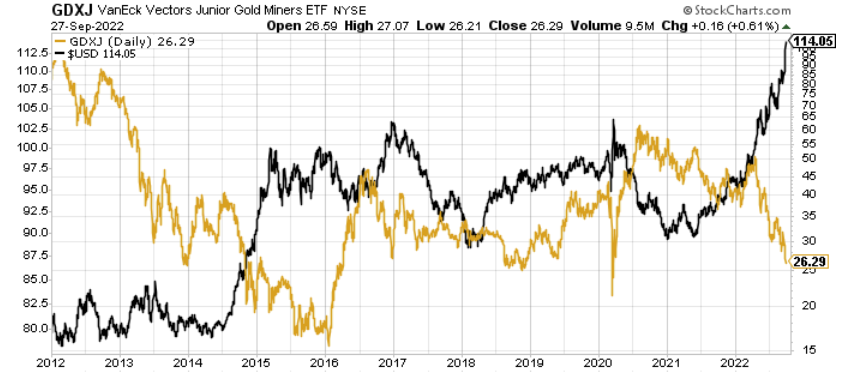
To explain, the gold line above tracks the GDXJ ETF, while the black line above tracks the USD Index. If you analyze the right side of the chart, you can see that the junior miners’ Sep. 27 closing price is much nearer the low set when the USD Index hit its ~2017 high. Thus, it’s another example of why choosing the right asset to short is just as important as being correct in your investment thesis.
Hawk Talk
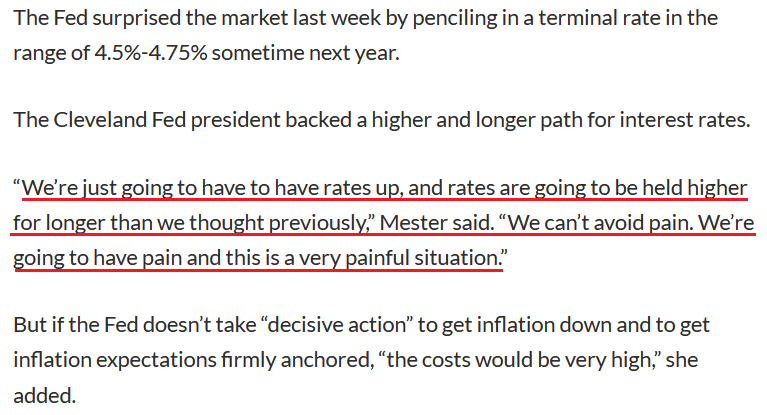
With Fed officials back to parroting Chairman Jerome Powell's future plans, his deputies reiterated his hawkish message. For example, Cleveland Fed President Loretta Mester said on Sep. 26:
“We have to understand that inflation is going to be continuing to be hard to predict (…). We can’t have wishful thinking replace really compelling evidence. So before I conclude that inflation has peaked, I will need to see several months of declines in the month-over-month (MoM) readings.”
As a result, Mester was ominously honest about the economic challenges that lie ahead.
Please see below:
 Source: MarketWatch
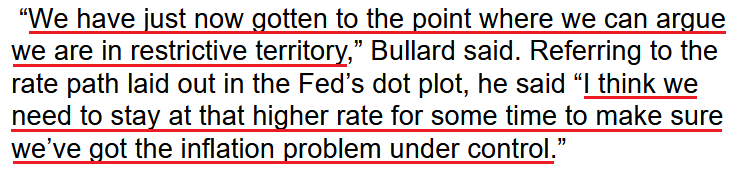
Likewise, St. Louis Fed President James Bullard said on Sep. 27:
“[Inflation] is a serious problem and we need to be sure we respond to it appropriately. We have increased the policy rate substantially this year and more increases are indicated.”
He added that the U.S. federal funds rate (FFR) may need to reach “the 4.5% range,” as inflation is more resilient than Fed officials expected. As such, with the U.S. labor market on solid footing, officials remain focused on the other half of their dual mandate.
Please see below:
 Source: Bloomberg
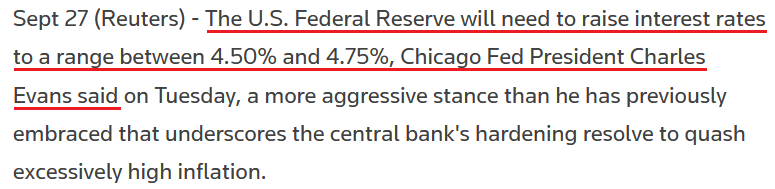
Finally, Chicago Fed President Charles Evans said on Sep. 27 that “My own viewpoint is roughly in line with the median assessment” from the Summary of Economic Projections (SEP).
“I had a sobering assessment that we've got more work ahead,” Evans said. “I'm optimistic that the peak that we’ve set out is going to be sufficiently restrictive that it could be enough.”
Thus, while I warned for months that reality would re-emerge, suddenly, a 4.5% FFR is the low-end of the consensus range.
 Source: Reuters
The Bottom Line
While gold has relatively outperformed the U.S. 10-Year real yield and the USD Index, the GDXJ ETF has not. Moreover, the prior imbalance between the U.S. 10-Year Treasury and breakeven inflation rates is a cautionary tale of how history is undefeated. Therefore, the yellow metal should reconnect with the U.S. 10-Year real yield at some point, and we expect the normalization to occur through lower gold prices.
Furthermore, with Fed officials hawked up and pressing ahead with further rate hikes, the medium-term outlooks are bullish for the USD Index and the U.S. 10-Year real yield. Absent short-term sentiment rallies, gold, silver, and mining stocks should struggle in the following weeks and months.
In conclusion, the PMs were mixed on Sep. 27, as silver ended the day in the red. However, while oversold conditions may provide some short-term relief, the medium-term implications are unchanged: the precious metals remain in downtrends, and the technicals and the fundamentals signal lower lows in the months ahead. While I’m not making any promises with regard to price moves or profitability, in my opinion, the above also indicates that profits on our short positions in junior mining stocks are going to increase even further.
Overview of the Upcoming Part of the Decline
- It seems to me that the corrective upswing is over, and that the next big move lower is already underway.
- If we see a situation where miners slide in a meaningful and volatile way while silver doesn’t (it just declines moderately), I plan to – once again – switch from short positions in miners to short positions in silver. At this time, it’s too early to say at what price levels this could take place and if we get this kind of opportunity at all – perhaps with gold prices close to $1,600.
- I plan to switch from the short positions in junior mining stocks or silver (whichever I’ll have at that moment) to long positions in junior mining stocks when gold / mining stocks move to their 2020 lows (approximately). While I’m probably not going to write about it at this stage yet, this is when some investors might consider getting back in with their long-term investing capital (or perhaps 1/3 or 1/2 thereof).
- I plan to return to short positions in junior mining stocks after a rebound – and the rebound could take gold from about $1,450 to about $1,550, and it could take the GDXJ from about $20 to about $24.
- I plan to exit all remaining short positions once gold shows substantial strength relative to the USD Index while the latter is still rallying. This may be the case with gold prices close to $1,400 and GDXJ close to $15 . This moment (when gold performs very strongly against the rallying USD and miners are strong relative to gold after its substantial decline) is likely to be the best entry point for long-term investments, in my view. This can also happen with gold close to $1,400, but at the moment it’s too early to say with certainty.
- The above is based on the information available today, and it might change in the following days/weeks.
You will find my general overview of the outlook for gold on the chart below:
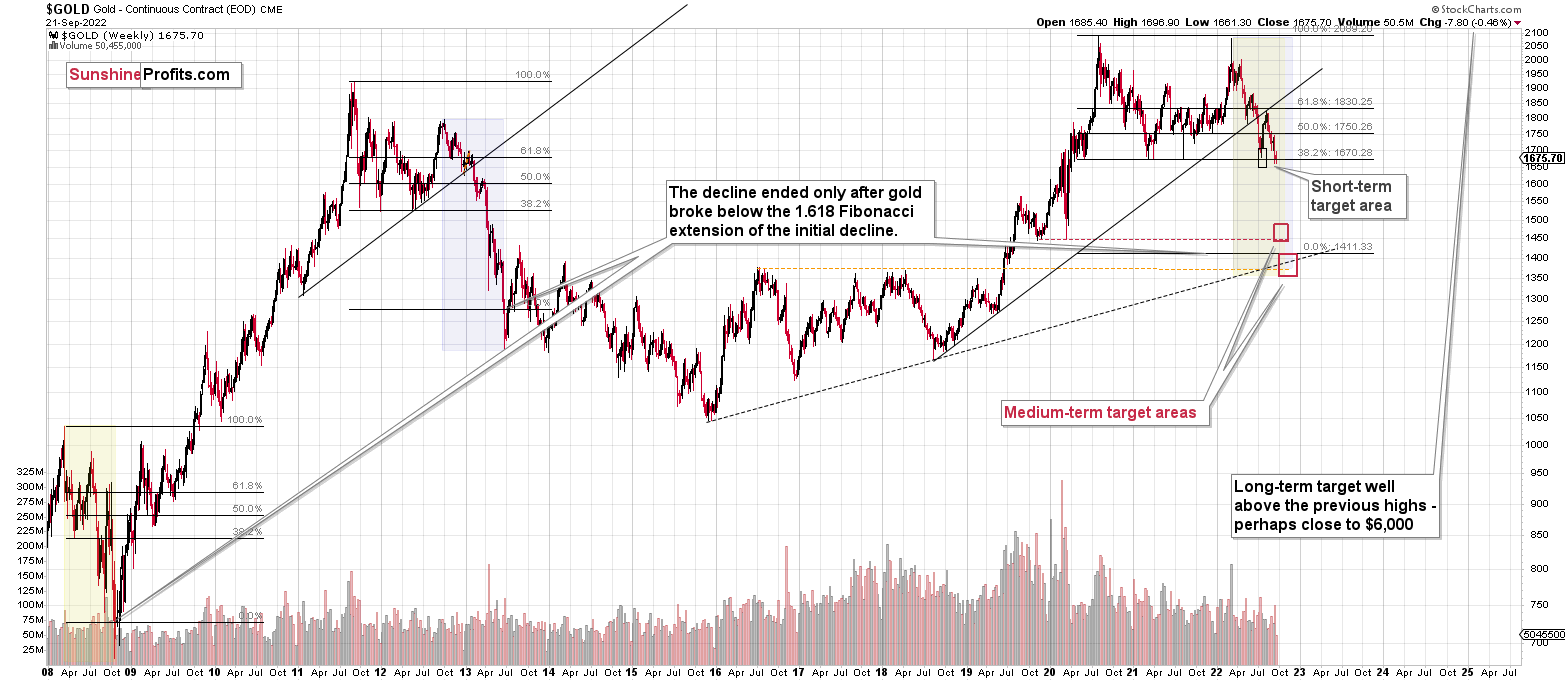
Please note that the above timing details are relatively broad and “for general overview only” – so that you know more or less what I think and how volatile I think the moves are likely to be – on an approximate basis. These time targets are not binding nor clear enough for me to think that they should be used for purchasing options, warrants, or similar instruments.
Letters to the Editor
Q: I hope you are doing fantastic. I know we are all at least on the financial side thanks to you and the recent gains we all had. I appreciate your work and analyses.
I had some questions about one of the recent subscriber comments last week ~ (or 2 weeks ago). The narrative was about the stock market always bouncing due to seasonality in October and getting closer to mid-elections in the U.S. I wanted to revisit the comment due to the recent developments in the gold market. What are your thoughts now? Do you think this is going to impact gold’s mid-term decline? At least space it for the October-November period.
A: Thank you for your kind words – much appreciated! I’m doing quite well, thank you. Right now, I’m in the middle of my quarterly 3-day water-only fast, so my energy levels are not as high as they usually are, but it’s OK. Not only is healthy to do so, but it’s actually a good discipline exercise that has significant benefits in trading/investing, and in other areas of life – Stoics would call it “voluntary discomfort”. Counter-intuitive to what most preach – going on a spending/consumption spree given huge profits, but… It works :) Of course, be sure to consult fasting with your physician before you do it.
This is actually connected with your question – markets too move in cycles. Seasonal cycles are one of the ways in which we can approach this phenomenon.
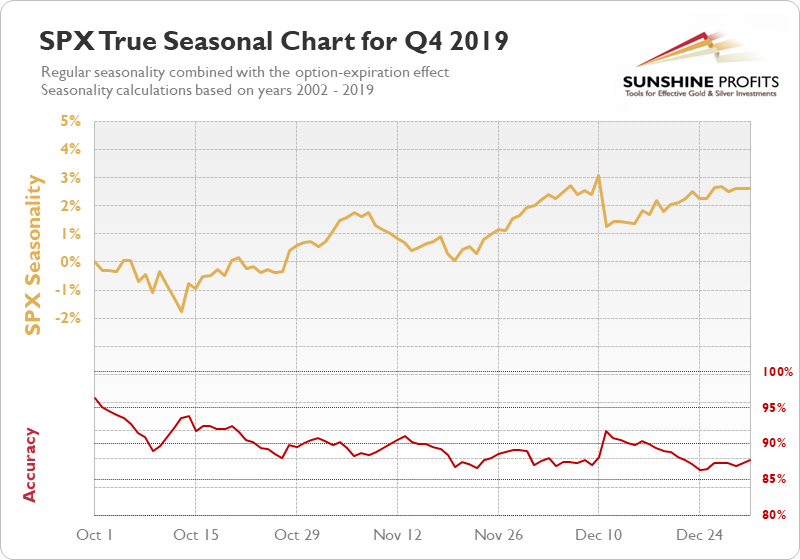
Stocks tend to bottom close to the middle of October and then move higher.
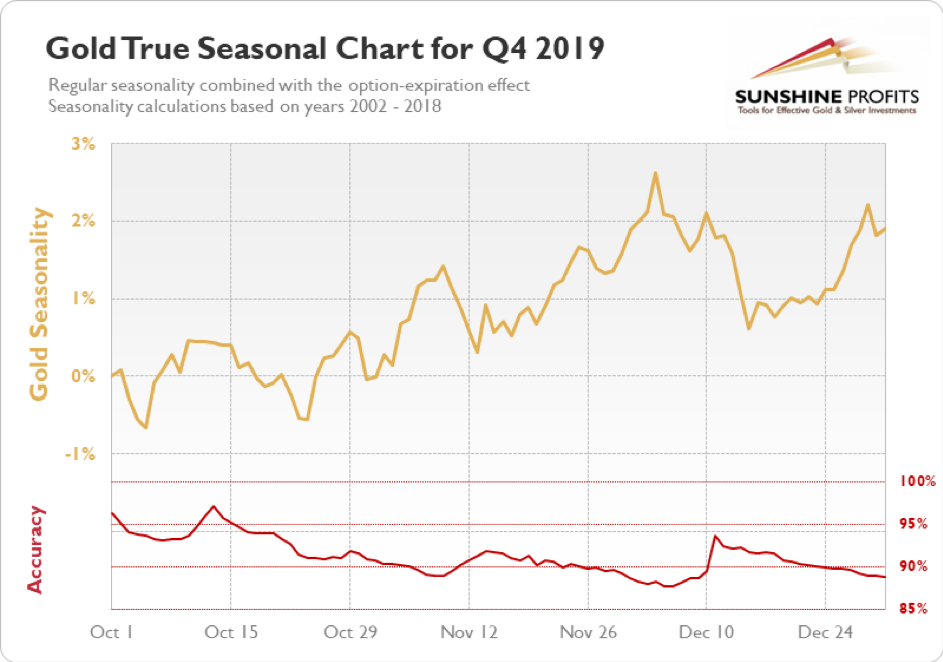
Gold doesn’t have a clear tendency to move in any specific direction until the end of October, when it often rallies.
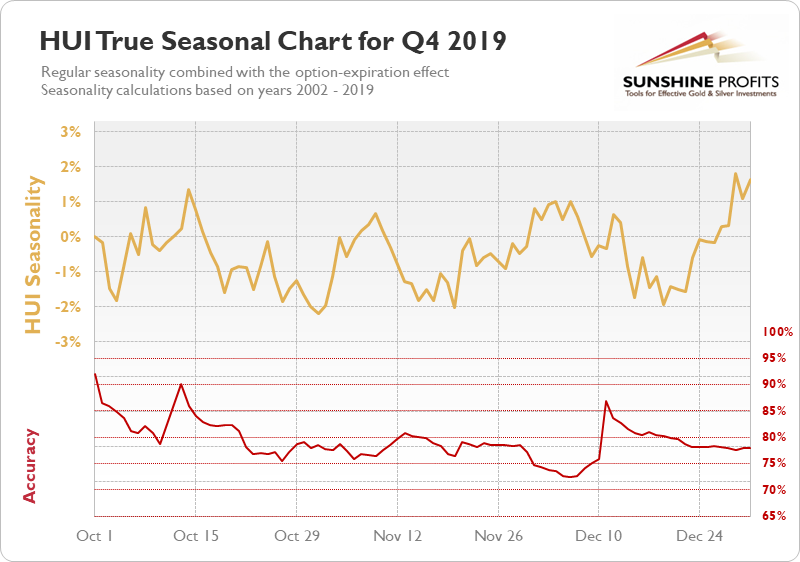
Gold stocks, however, don’t have any specific tendency. There’s a short-term bottom close to the end of October, but it doesn’t have to translate into a big rally.
Given what’s happening with inflation and interest rates, the period before the U.S. mid-term elections is rather unclear. On one hand, the powers that be would want stocks to rally before the elections, but on the other hand, since people are so concerned with inflation, they would want to appear as if they are doing everything they reasonably can to fight it. And this means rate hikes, which are in turn bearish for stocks.
In this uncertain environment, I plan to focus on what has proven to be much more reliable – the analogy to 2013 and 2008,and to the technical analysis in general.
Seasonals are particularly useful if there are no strong trends present – the markets can then drift “as they usually do”. This time, however, the 2013-style trend is clearly present, and it has a profound impact on what the prices are doing.
In other words, I don’t think it’s worth guessing what’s going to happen based on seasonality next month, and instead focus on what’s been working.
Q: Another comment I had was on the quantitative tightening process. I think you haven’t made a comment about it recently, I saw that the Fed is accelerating the balance sheet reduction and I wanted to see if you think this is going to add more pressure in addition to the FFR increase. Any information about a future analysis would be fantastic.
A: In short, yes. This is important, and it’s in line with the analysis of the link between the price of gold and real yields that I discussed earlier today. Gold is likely to fall hard – much harder than gold permabulls expect it to.
Then, when gold is universally hated (and if gold is not hated, then miners will most likely be universally hated), we’ll likely have a perfect buying opportunity.
Q1: Last but not least, (sorry I’m full of questions), also due to the recent developments with Russia and Ukraine, some analysts thought they were at a pivotal point due to the fake referendums currently taking place. Now, if things were to escalate, we would understand, thanks to you, that gold peaks temporarily due to geopolitical issues. I understand you can’t counsel your subscribers, but what would you do if the conflict re-escalates? Would you be doing something to minimize the losses and lock in some gains? It would be fantastic if you could share it with us.
Thanks again for your help and insights, and cheers for the fantastic gains!
Q2: Could you please provide us with your insight on the current escalation between Ukraine (the West) and Russia? It is expected that Putin will declare the annexation of a few regions in Ukraine on Friday. In addition, Russia constantly threatens to use tactical nuclear weapons. Are you concerned that we might see a repetition of what we saw in Q1 in terms of the PM move? Or whether all of these talks are already priced in?
A: I would probably do nothing special if the conflict re-escalated to a regular extent, because I see how the market reacts to what’s been happening recently. It just doesn’t react.
Here’s (chart courtesy of Google Trends) how much people search online for WW3 and the Ukraine war.
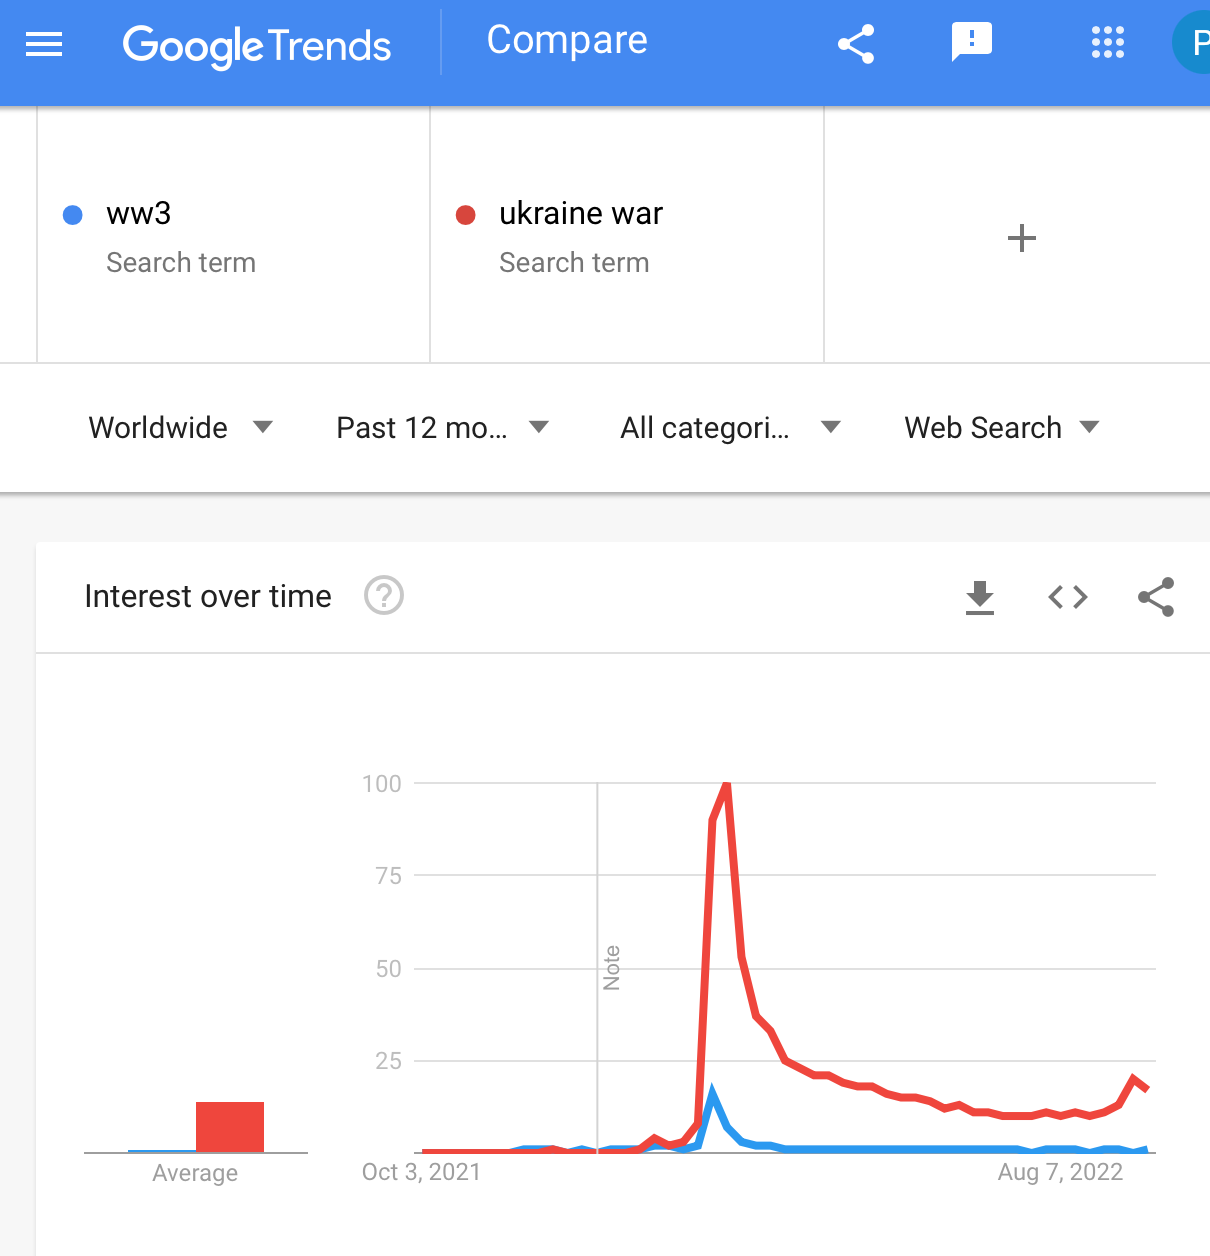
There was a big surge in concern earlier this year, but what we see now is almost nothing.
The recent upswing in interest in the “Ukraine war” could be based on the Ukrainian counter-offensive and the publicity that it got.
Back then, it was unknown what was going to happen. Now it’s rather clear what the situation looks like and how it can unfold.
The threat of the use of “tactical nuclear weapons” is nothing new, which is why it doesn’t change anything right now. If they were really used and the markets reacted to it, I might take profits from the current positions. I don’t think it’s likely right now.
Also, please remember – the markets move on unexpected news. What is publicly known is already discounted in the prices.
Q: Dear Przemysław Radomski,
First, I would like to thank you very much for the wonderful job you are doing. You managed to keep me on the correct side of the market for quite a long time, which means that I'm in the green. I would appreciate it very much if you could give me your opinion on the following question. It doesn't mean that I’m going to follow it anyway, but your opinion counts a lot for me. I’m living in Toronto, Canada. I’m invested in Gold Juniors ETFs on NYSE in USD. According to your analysis studies, USD is probably approaching $118-120. What is wise to be done after that? Is it safer to sell USD investments, convert USD to CAD and then invest in the Toronto Stock Exchange? Thank you very much once again.
A: Thank you, I’m very happy to read that you’re so happy with the results that you got thanks to my analysis.
In my opinion, the question of the currency in which you invest is secondary to what you actually want to invest in.
Because if the USD tops at the same time as the precious metals market bottoms (actually, PMs could bottom before the USD Index tops), then PMs are likely to provide a great buying opportunity. Mining stocks in particular, as they tend to rally the most during the initial parts of a given upswing.
I can’t provide specific advice regarding individual investments, but in my opinion, it’s usually a good idea to simplify what you are NOT interested in trading / investing. If you’re not interested in the forex market trades, it’s often best to simplify the investment on that end – that’s one hassle less. If the instruments that you’d like to invest in are available on TSX as well as NYSE, it might be more convenient to use those on TSX.
In the case of mining stocks, there are ETFs that are listed there, for example, HBU.TO (if one is seeking 2x leverage, that is). To clarify – that would be a proxy for going LONG mining stocks, and right now I’m writing about going SHORT (for example, HGD.TO is a Canadian ETF that provides -2x leverage).
Summary
Summing up, it seems that the biggest part of the 2013-like decline is taking place right now, and – while I can’t make any promises regarding performance - it seems likely to me that our big profits are about to become huge, and then ridiculously big in the relatively near future.
Things might happen very fast in the coming days, and if I plan to make any adjustments, I’ll keep you informed. Still, if the targets that I’m mentioning in the “Trading” part of the summary are reached, I think that profits should be taken off the table without an additional confirmation from me. I will probably get on the long side of the market at that time, but I’ll send a confirmation if I decide to do so.
After the final sell-off (that takes gold to about $1,350-$1,500), I expect the precious metals to rally significantly. The final part of the decline might take as little as 1-5 weeks, so it's important to stay alert to any changes.
As always, we'll keep you – our subscribers – informed.
To summarize:
Trading capital (supplementary part of the portfolio; our opinion): Full speculative short positions (300% of the full position) in junior mining stocks are justified from the risk to reward point of view with the following binding exit profit-take price levels:
Mining stocks (price levels for the GDXJ ETF): binding profit-take exit price: $20.32; stop-loss: none (the volatility is too big to justify a stop-loss order in case of this particular trade)
Alternatively, if one seeks leverage, we’re providing the binding profit-take levels for the JDST (2x leveraged). The binding profit-take level for the JDST: $29.87; stop-loss for the JDST: none (the volatility is too big to justify a SL order in case of this particular trade).
For-your-information targets (our opinion; we continue to think that mining stocks are the preferred way of taking advantage of the upcoming price move, but if for whatever reason one wants / has to use silver or gold for this trade, we are providing the details anyway.):
Silver futures downside profit-take exit price: $12.32
SLV profit-take exit price: $11.32
ZSL profit-take exit price: $79.87
Gold futures downside profit-take exit price: $1,504
HGD.TO – alternative (Canadian) 2x inverse leveraged gold stocks ETF – the upside profit-take exit price: $19.87
HZD.TO – alternative (Canadian) 2x inverse leveraged silver ETF – the upside profit-take exit price: $49.87
Long-term capital (core part of the portfolio; our opinion): No positions (in other words: cash)
Insurance capital (core part of the portfolio; our opinion): Full position
Whether you’ve already subscribed or not, we encourage you to find out how to make the most of our alerts and read our replies to the most common alert-and-gold-trading-related-questions.
Please note that we describe the situation for the day that the alert is posted in the trading section. In other words, if we are writing about a speculative position, it means that it is up-to-date on the day it was posted. We are also featuring the initial target prices to decide whether keeping a position on a given day is in tune with your approach (some moves are too small for medium-term traders, and some might appear too big for day-traders).
Additionally, you might want to read why our stop-loss orders are usually relatively far from the current price.
Please note that a full position doesn't mean using all of the capital for a given trade. You will find details on our thoughts on gold portfolio structuring in the Key Insights section on our website.
As a reminder - "initial target price" means exactly that - an "initial" one. It's not a price level at which we suggest closing positions. If this becomes the case (as it did in the previous trade), we will refer to these levels as levels of exit orders (exactly as we've done previously). Stop-loss levels, however, are naturally not "initial", but something that, in our opinion, might be entered as an order.
Since it is impossible to synchronize target prices and stop-loss levels for all the ETFs and ETNs with the main markets that we provide these levels for (gold, silver and mining stocks - the GDX ETF), the stop-loss levels and target prices for other ETNs and ETF (among other: UGL, GLL, AGQ, ZSL, NUGT, DUST, JNUG, JDST) are provided as supplementary, and not as "final". This means that if a stop-loss or a target level is reached for any of the "additional instruments" (GLL for instance), but not for the "main instrument" (gold in this case), we will view positions in both gold and GLL as still open and the stop-loss for GLL would have to be moved lower. On the other hand, if gold moves to a stop-loss level but GLL doesn't, then we will view both positions (in gold and GLL) as closed. In other words, since it's not possible to be 100% certain that each related instrument moves to a given level when the underlying instrument does, we can't provide levels that would be binding. The levels that we do provide are our best estimate of the levels that will correspond to the levels in the underlying assets, but it will be the underlying assets that one will need to focus on regarding the signs pointing to closing a given position or keeping it open. We might adjust the levels in the "additional instruments" without adjusting the levels in the "main instruments", which will simply mean that we have improved our estimation of these levels, not that we changed our outlook on the markets. We are already working on a tool that would update these levels daily for the most popular ETFs, ETNs and individual mining stocks.
Our preferred ways to invest in and to trade gold along with the reasoning can be found in the how to buy gold section. Furthermore, our preferred ETFs and ETNs can be found in our Gold & Silver ETF Ranking.
As a reminder, Gold & Silver Trading Alerts are posted before or on each trading day (we usually post them before the opening bell, but we don't promise doing that each day). If there's anything urgent, we will send you an additional small alert before posting the main one.
Thank you.
Przemyslaw Radomski, CFA
Founder, Editor-in-chief

