

Briefly: in our opinion, full (300% of the regular position size) speculative short positions in mining stocks are justified from the risk/reward point of view at the moment of publishing this Alert. We are adjusting the price targets, by moving them closer to the current price.
The precious metals market moved in a volatile fashion yesterday, and we sent out an intraday Alert to let keep you informed before posting today's regular analysis. Generally, after we posted the intraday Alert, the indications that we saw became more vivid. We wrote the following
Silver soared today (greatly outperforming gold) and touched its late 2014 high, gold is higher, and miners are higher as well, but only to a limited extent. Out of the entire precious metals market, the latter were barely affected.
In fact, miners are up by less than 2% today. We know this is very tough to believe right now, as it is always the case when silver is soaring - but this is not a bullish combination. In early parts of big upswings miners outperform and silver lags. At the very end of a rally, silver soars while miners lag or even decline. We are in the latter type of situation.
In today's regular Gold and Silver Trading Alert, we wrote the following with regard to the similarity to the 2016 top:
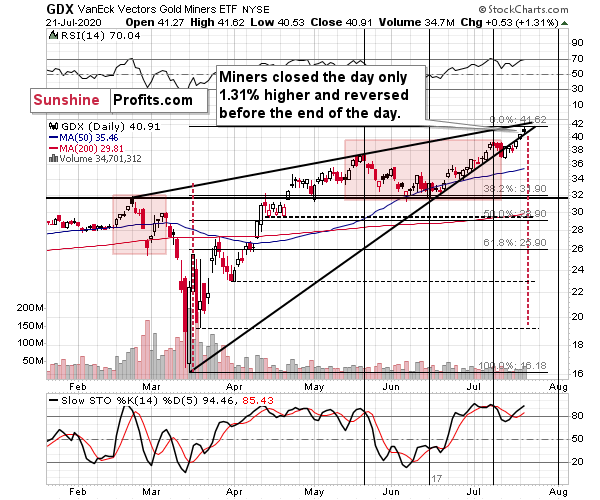
"Assuming the analogous relative price increases this time, one could expect GDX to form a top at $39.91 in terms of the daily closing prices and to form the intraday high at $40.81.
The GDX ETF just closed at $40.38 and the intraday high was $40.49. These prices are between the above-mentioned prices, which means that so far the situation is developing very similarly as it developed in 2016, and that we can expect the final top to be in or to be formed very soon."
At the moment of writing these words, GDX is trading at $40.97 and today's intraday high was $41.62. This less than 2% above the price that would be 100% similar to the 2016 price moves.
We also wrote that "we might see an initial move higher - back above the rising resistance line, and then a slide below it, perhaps through a daily reversal pattern". We wrote that "such a development would be a perfectly bearish confirmation of yesterday's big analysis." The miners are not back below this line, but they are very close to it and they underperformed gold (and GLD) to a big extent.
Consequently, it's either the case that the precious metals market is truly going to break higher from here, or it's finishing the big run-up from March lows and is ready to slide once again. Today's very strong performance of silver and very weak performance of mining stocks suggests that the latter is much more likely.
After we sent the above, miners (GDX) moved even lower, closing the day just 1.31% higher - at $40.91.
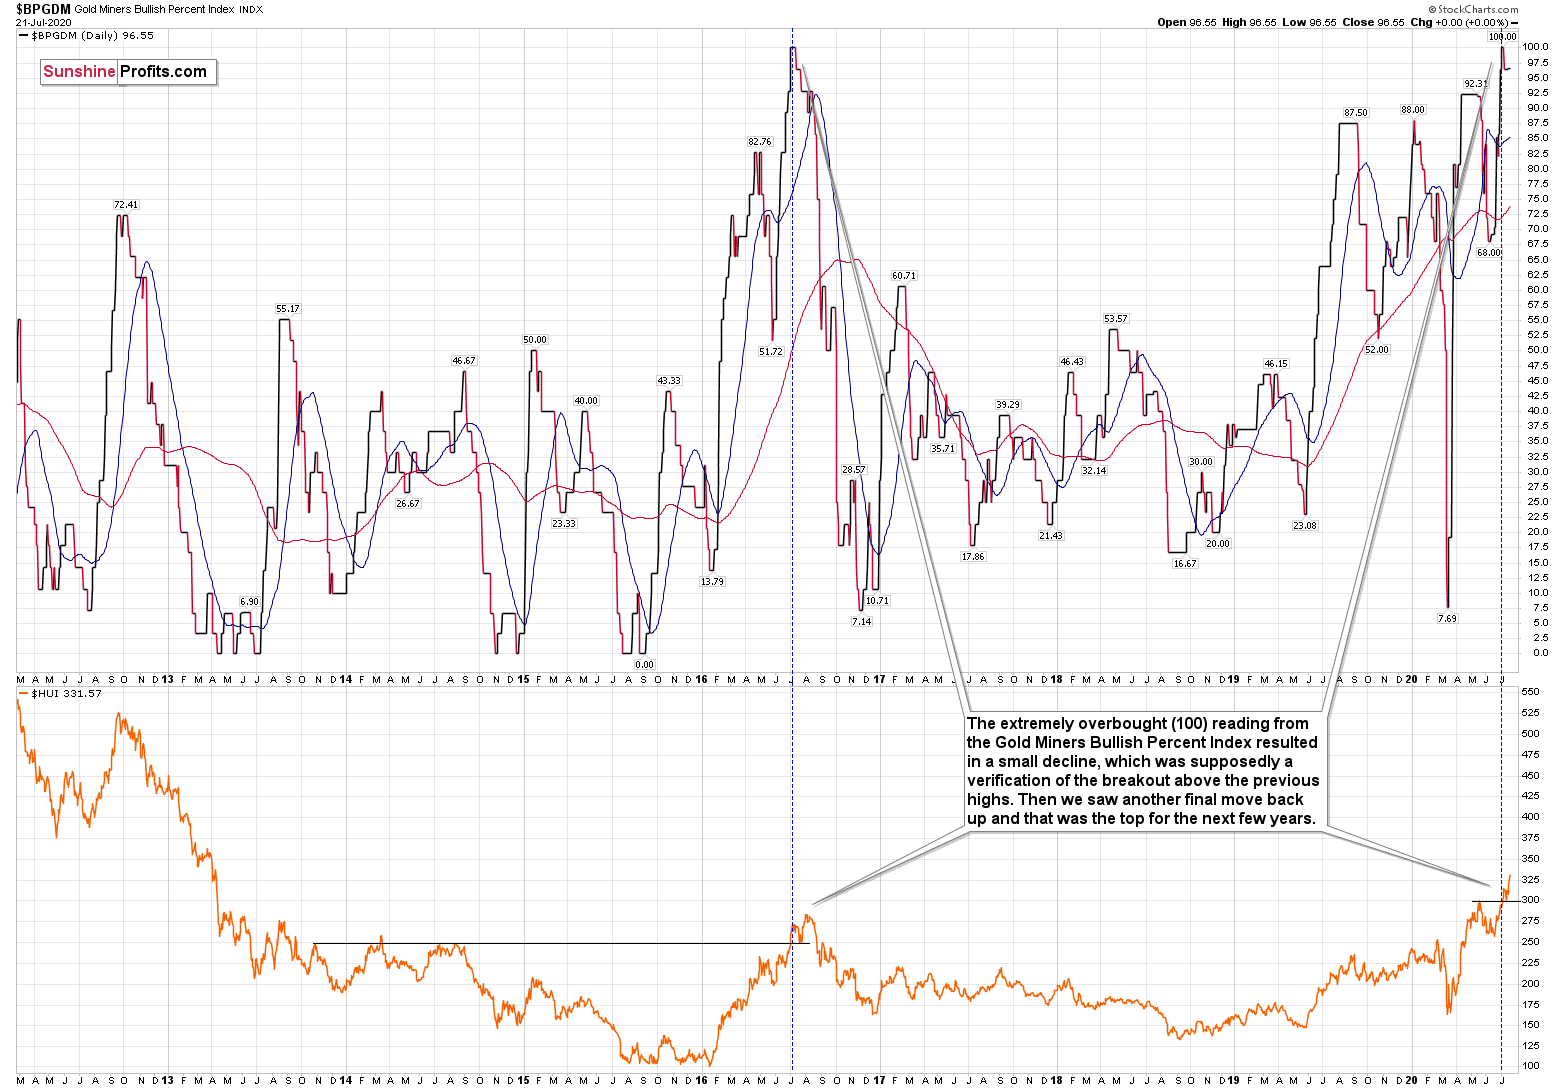
This means that the price levels achieved by mining stocks are very much in tune with what miners did back in 2016, a bit after the Gold Miners Bullish Percent Index flashed the extremely oversold sign by moving to 100.
The USD Index moved slightly below the 95 level and it then invalidated this breakdown. It's moving back up today, but so far, the move has been relatively small.
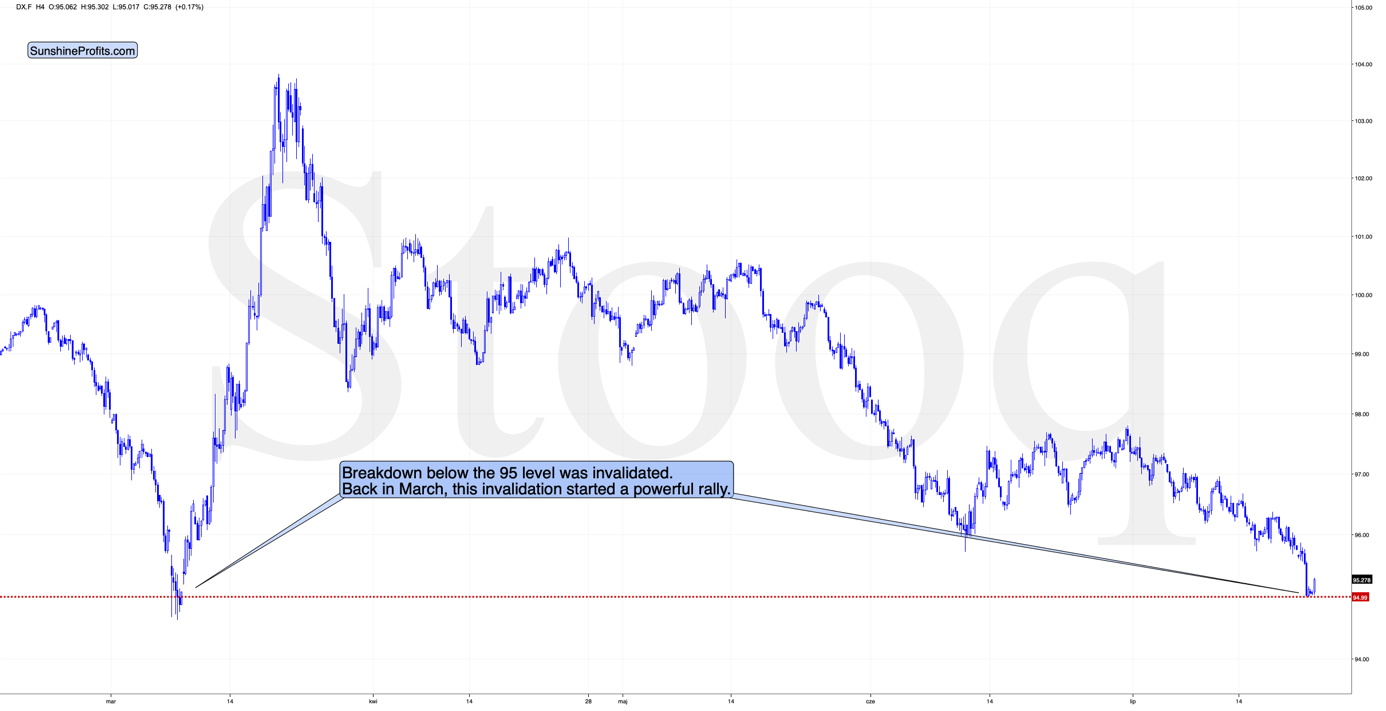
The invalidation of the breakdown below the 95 level is what launched the massive March rally, so it could be the case that it was the trigger that the USDX needed.
The long-term USD Index chart shows yet another important support level, of a much more long-term nature.
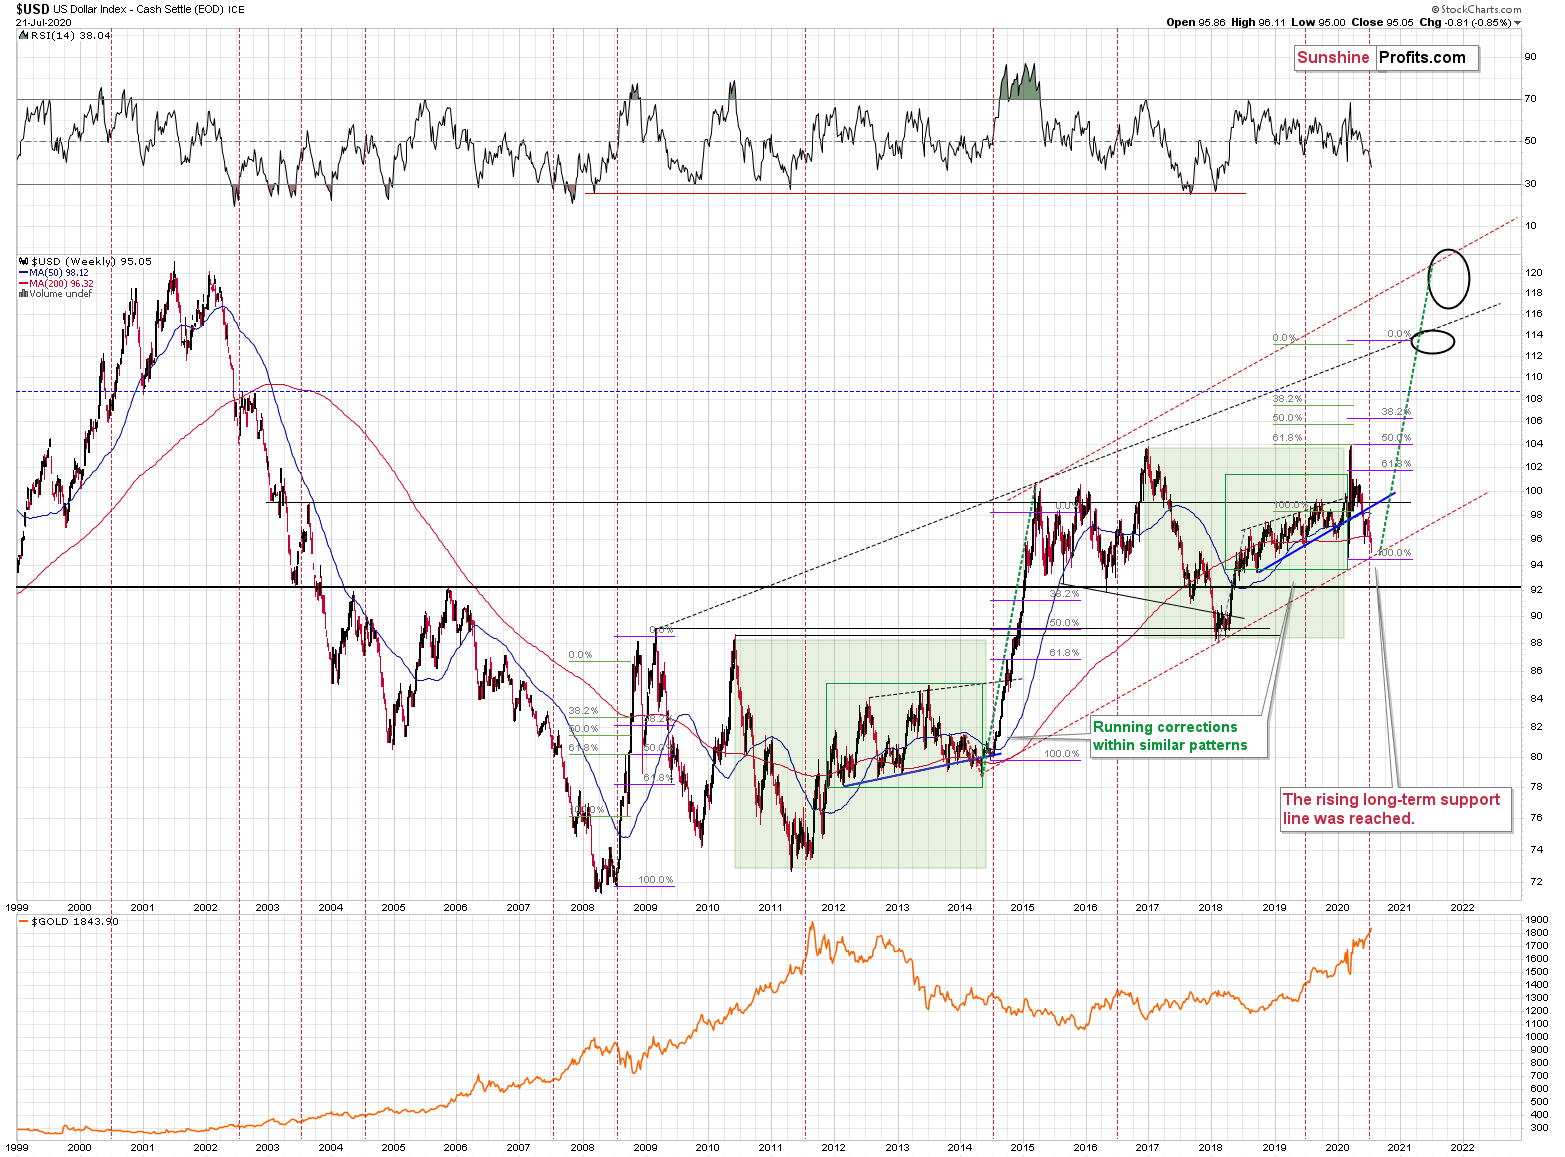
The rising red support line that's based on the major 2014 and 2018 bottoms, is practically where the USD Index just moved. Both bottoms are very important, and they are relatively far from each other. Both factors make the line particularly strong. Combined with the short-term support, it makes the follow-up rally likely.
Moving back to the precious metals market, silver's powerful short-term upswing is what appears to be a screaming buy signal. But it's not one. It's what we saw multiple times before major tops and declines, also in 2016.
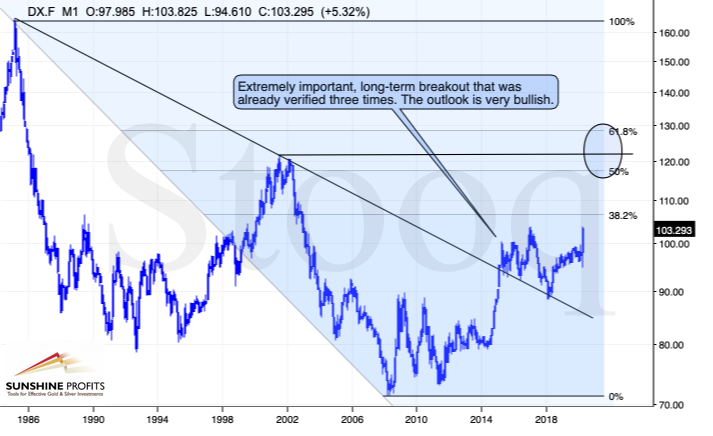
Please note that the USD Index remains in an uptrend and is after a very long-term breakout that was already verified several times. The rally that we'll likely see shortly will not be a "correction", but a move along with the major trend. The sizable move lower that we saw in the past few months, was a correction within the uptrend.
The pandemic, the QEs and so on are bearish fundamental news for the U.S. dollar, but the money-printing machines are not cold in the Eurozone, Japan and other parts of the world, either. Consequently, the above issues don't guarantee any decline in the USDX. And while the pandemic is the biggest issue that the world is facing right now, let's not forget about EU's major structural problems and how massive the money printing in Japan really is. The USD Index is a weighted average of several currency exchange rates, and the ones with the euro and the yen have the biggest weights - that's why we emphasized these two economies.
The situation is indeed quite bad in the U.S. and the dollar is still holding up much better than it did in early 2018, when there was no open-ended QE and no pandemic whatsoever. The trend in the USD Index remains up.
But silver just broke above its 2016 highs! Isn't it a bullish confirmation?
Let's take a closer look.
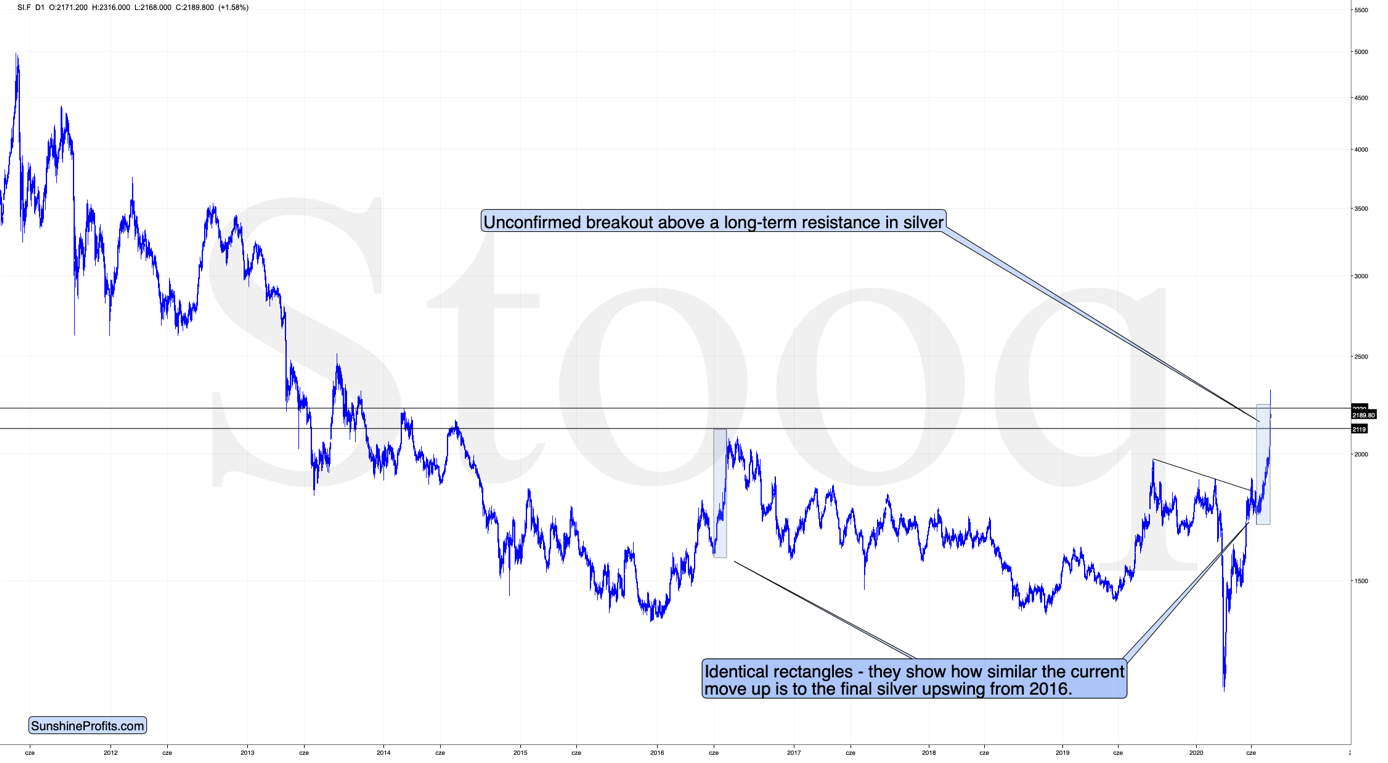
We marked the final upswing of 2016 with a blue rectangle and we copied it to the current situation - starting at the most recent low.
The moves are almost identical. Ok, silver moved slightly higher in today's pre-market trading, but it's already back within the rectangle. At the same time, silver invalidated the move below the 2014 high, and it seems that it's about to invalidate the rally above the late-2014 high as well. The invalidation of the breakout above the 2016 (which we expect to see shortly), will be the final sign that the top is indeed in.
So far, today's silver's performance looks like a huge daily reversal candlestick. Of course, the day is far from being over (in fact, the markets have yet to open in the U.S.), but the sizes of the moves both up and down are already meaningful.
And gold?
Gold is also reversing its course.
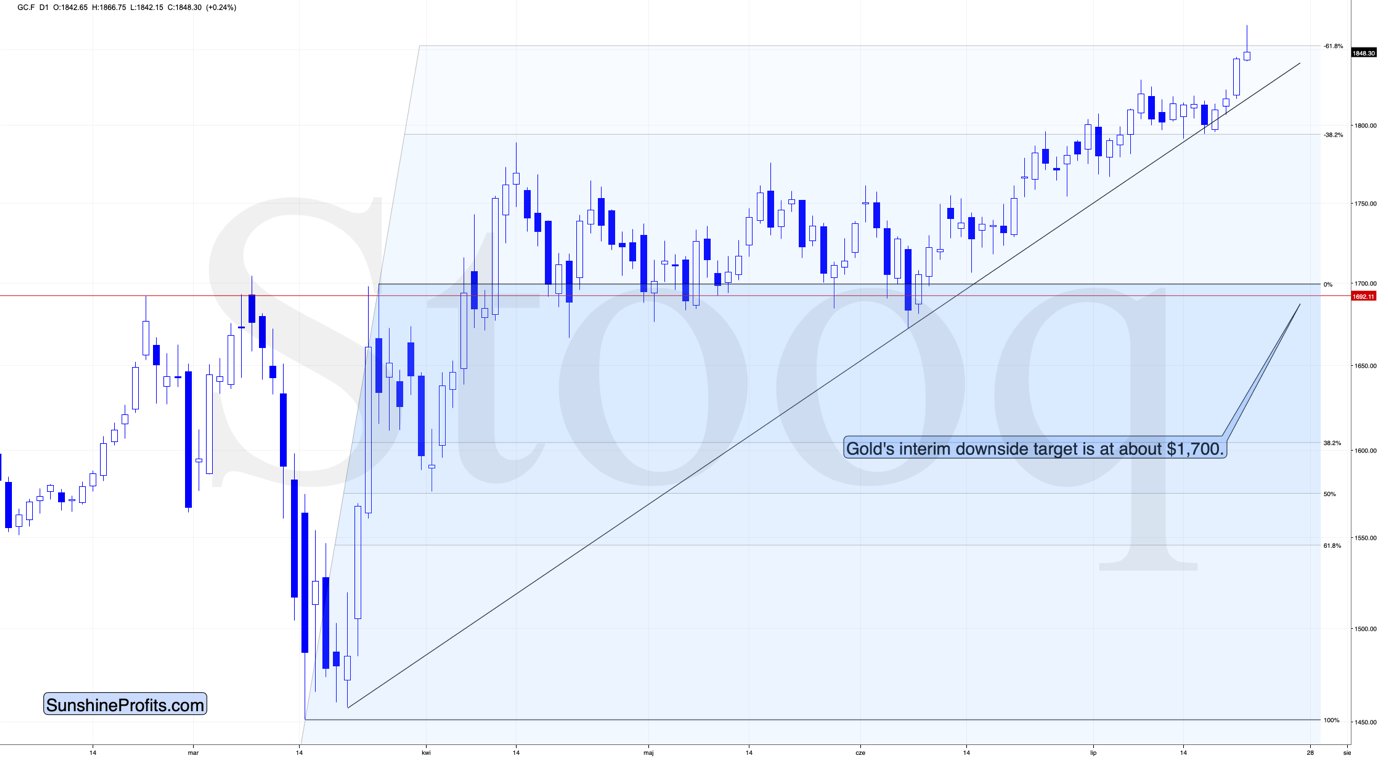
It moved above the previous highs and - based on today's pre-market reversal - it seems to have topped approximately at the 1.618 extension of the March rally. That's a slightly different way of using the Phi number - we usually use it for retracements like 61.8% or 38.2% (which is 1 - 0.618). Why are we mentioning it? Because it shows that gold has already reached a kind of resistance that could trigger a reversal (and it seems that it did just that) - it doesn't have to move to the 2011 high for the short-term rally to burn itself out.
Since we plan to adjust our positions when gold moves to $1,700 or so, we are moving the exit levels for the current trading positions in miners closer to the current price. The initial short-term downside target for the GDX ETF is about $31.90 (the nearest Fibonacci retracement), but we might adjust it later if miners react particularly strongly to gold's decline (which is quite likely given how weak they were yesterday).
With the starting price of $40.91, target price of $32.02 (conservatively a bit above the nearest round number), and assuming that the decline would take place over the next 7 trading days and that it would be identical on each day in percentage terms (which will probably not happen, but it's the average of the ways in which the GDX could decline), we get the following as the target for the DUST ETF (we were asked to provide the calculations, so we deliver):
32.02 / 40.91 = 0.7822, which means that GDX would have to decline by 1 - 0.7827 = 21.73%
If this decline is to take 7 trading days, then it would decline by 1.2173 ^ (1/7) - 1 = 2.849% each day.
Since DUST has 2x leverage regarding the daily moves, this means a daily rally of about 2.849% x 2 = 5.698%
Repeating the same daily upswing 7 times provides us with the total gain of 1.05698^7 -1 = 47.39%
Yesterday's closing price of DUST was $19.56, so the above means a target of $19.56 x 1.4739 = $28.83. After conservatively moving it $0.10 lower, we get $28.73 as the target.
This level is considerably more conservative than the previous target, but it's also based on the much more conservative price move. Miners could still slide much lower thereafter, but it might be better to gain on the decline through silver (just like it would have been best in March - such action would have increased the ultimate profitability of the trades, even though we managed to enter the long position in miners on the day when they bottomed).
Summary
Summing up, the extremely overbought reading from the Gold Miners Bullish Percent Index and the individual price moves (including silver's powerful upswing) make the current case very similar to the 2016 topping pattern, and other important indications (especially gold's and USD's long-term cycles) point to likely - sizable - decline in the following several weeks. Today's pre-market reversals in gold and silver as well as miners yesterday's reversal and it's relatively weak performance relative to gold and (especially) silver suggest that miners are about to move visibly lower.
Naturally, everyone's trading is their responsibility, but in our opinion, if there ever was a time to either enter a short position in the miners or to increase its size if it wasn't already sizable, it's now. We made money on the March decline and on the March rebound, and it seems that another massive slide is about to start. When everyone is on one side of the boat, it's a good idea to be on the other side, and the Gold Miners Bullish Percent Index literally indicates that this is the case with mining stocks.
Also, since we plan to adjust our positions when gold moves to $1,700 or so, we are moving the exit levels for the current trading positions in miners closer to the current price.
After the sell-off (that takes gold below $1,400), we expect the precious metals to rally significantly. The final decline might take as little as 1-6 weeks, so it's important to stay alert to any changes.
Most importantly - stay healthy and safe. We made a lot of money on the March decline and the subsequent rebound (its initial part) price moves (and we'll likely make much more in the following weeks and months), but you have to be healthy to really enjoy the results.
As always, we'll keep you - our subscribers - informed.
To summarize:
Trading capital (supplementary part of the portfolio; our opinion): Full speculative short positions (300% of the full position) in mining stocks is justified from the risk to reward point of view with the following binding exit profit-take price levels:
Senior mining stocks (price levels for the GDX ETF): binding profit-take exit price: $32.02; stop-loss: none (the volatility is too big to justify a SL order in case of this particular trade); binding profit-take level for the DUST ETF: $28.73; stop-loss for the DUST ETF: none (the volatility is too big to justify a SL order in case of this particular trade)
Junior mining stocks (price levels for the GDXJ ETF): binding profit-take exit price: $42.72; stop-loss: none (the volatility is too big to justify a SL order in case of this particular trade); binding profit-take level for the JDST ETF: $21.22; stop-loss for the JDST ETF: none (the volatility is too big to justify a SL order in case of this particular trade)
For-your-information targets (our opinion; we continue to think that mining stocks are the preferred way of taking advantage of the upcoming price move, but if for whatever reason one wants / has to use silver or gold for this trade, we are providing the details anyway. In our view, silver has greater potential than gold does):
Silver futures downside profit-take exit price: unclear at this time - initially, it might be a good idea to exit, when gold moves to $1,703.
Gold futures downside profit-take exit price: $1,703
Long-term capital (core part of the portfolio; our opinion): No positions (in other words: cash
Insurance capital (core part of the portfolio; our opinion): Full position
Whether you already subscribed or not, we encourage you to find out how to make the most of our alerts and read our replies to the most common alert-and-gold-trading-related-questions.
Please note that the in the trading section we describe the situation for the day that the alert is posted. In other words, it we are writing about a speculative position, it means that it is up-to-date on the day it was posted. We are also featuring the initial target prices, so that you can decide whether keeping a position on a given day is something that is in tune with your approach (some moves are too small for medium-term traders and some might appear too big for day-traders).
Plus, you might want to read why our stop-loss orders are usually relatively far from the current price.
Please note that a full position doesn't mean using all of the capital for a given trade. You will find details on our thoughts on gold portfolio structuring in the Key Insights section on our website.
As a reminder - "initial target price" means exactly that - an "initial" one, it's not a price level at which we suggest closing positions. If this becomes the case (like it did in the previous trade) we will refer to these levels as levels of exit orders (exactly as we've done previously). Stop-loss levels, however, are naturally not "initial", but something that, in our opinion, might be entered as an order.
Since it is impossible to synchronize target prices and stop-loss levels for all the ETFs and ETNs with the main markets that we provide these levels for (gold, silver and mining stocks - the GDX ETF), the stop-loss levels and target prices for other ETNs and ETF (among other: UGLD, DGLD, USLV, DSLV, NUGT, DUST, JNUG, JDST) are provided as supplementary, and not as "final". This means that if a stop-loss or a target level is reached for any of the "additional instruments" (DGLD for instance), but not for the "main instrument" (gold in this case), we will view positions in both gold and DGLD as still open and the stop-loss for DGLD would have to be moved lower. On the other hand, if gold moves to a stop-loss level but DGLD doesn't, then we will view both positions (in gold and DGLD) as closed. In other words, since it's not possible to be 100% certain that each related instrument moves to a given level when the underlying instrument does, we can't provide levels that would be binding. The levels that we do provide are our best estimate of the levels that will correspond to the levels in the underlying assets, but it will be the underlying assets that one will need to focus on regarding the signs pointing to closing a given position or keeping it open. We might adjust the levels in the "additional instruments" without adjusting the levels in the "main instruments", which will simply mean that we have improved our estimation of these levels, not that we changed our outlook on the markets. We are already working on a tool that would update these levels on a daily basis for the most popular ETFs, ETNs and individual mining stocks.
Our preferred ways to invest in and to trade gold along with the reasoning can be found in the how to buy gold section. Additionally, our preferred ETFs and ETNs can be found in our Gold & Silver ETF Ranking.
As a reminder, Gold & Silver Trading Alerts are posted before or on each trading day (we usually post them before the opening bell, but we don't promise doing that each day). If there's anything urgent, we will send you an additional small alert before posting the main one.
Thank you.
Sincerely,
Przemyslaw Radomski, CFA
Editor-in-chief, Gold & Silver Fund Manager

