Today's flagship issue comes one day ahead of schedule.
However, this seems more than justified given that we just heard news from the Fed and the markets reacted sharply.
What changed?
What didn't change?
What is the key thing that one should be focusing on, and what are the distractions?
These are the questions that we're going to address below.
Yesterday’s sudden move up in gold was all about the message coming from Powell, so we’ll start today’s analysis with a fundamental look at things. We’ll then move to a mix of fundamentals and technicals and finish off with technical details regarding the short-term outlook.
Powell’s Indecisive Comments Lift Gold
While the day began gloomy as interest rate uncertainty reigned, Fed Chairman Jerome Powell’s press conference helped spur risk appetite. Moreover, with the crowd pricing in more rate cuts in the months ahead, they can almost smell the return of pre-pandemic monetary policy. However, while sentiment has shifted, little has changed fundamentally.
For example, the FOMC statement read:
“The Committee decided to raise the target range for the federal funds rate to 4-1/2 to 4-3/4 percent. The Committee anticipates that ongoing increases in the target range will be appropriate in order to attain a stance of monetary policy that is sufficiently restrictive to return inflation to 2 percent over time.”
Thus, while the FOMC braces for “ongoing increases,” the crowd expects ‘ongoing decreases.’ Furthermore, while Powell flip-flopped from hawkish to dovish throughout his press conference, he said, “Given our outlook, I don’t see us cutting rates this year.”
“We’ve raised rates four and a half percentage points, and we’re talking about a couple of more rate hikes to get to that level we think is appropriately restrictive. Why do we think that’s probably necessary? We think because inflation is still running very hot.”
Conversely, he added:
“We can now say I think for the first time that the disinflationary process has started. We can see that and we see it really in goods prices so far.”
Then, he said:
 As a result, Powell was all over the place on Feb. 1, and his indecisive comments were perceived as bullish. In other words, since Powell didn’t spoil the party, why leave?
But, there seems to be a misperception that Powell can control the fundamentals. In a nutshell: his words are meaningless regarding their ability to control the business cycle. Yes, his rhetoric shifts sentiment and moves markets in the short term, but it’s largely irrelevant over the medium term.
Please see below:
 To explain, the Bloomberg headline above was from Aug. 27, 2021. Back then, Powell and the bulls assumed that QE would continue for months and that rate hikes wouldn’t commence until 2023. Yet, those projections were way off, and the FOMC has raised interest rates 18 times in 2022 (25 basis point increments).
As it stands, this was the most important quote of Powell’s Feb. 1 press conference:
 And therein lies the debate. Powell ‘thinks’ the U.S. will enjoy a soft landing, and the bulls are happy to run with his narrative like they did in 2021. However, we’ve warned on numerous occasions that the Fed has always pushed the U.S. federal funds rate (FFR) above the peak year-over-year (YoY) percentage change in the core Consumer Price Index (CPI), and that nine of the last 10 bouts of rising inflation have ended with recessions
Therefore, while it may seem like our fundamental thesis is all about inflation and higher interest rates, it’s not. The important point is that nearly every rate-hike cycle ends with a recession, and economic malaises alongside high inflation are much worse.
Please see below:
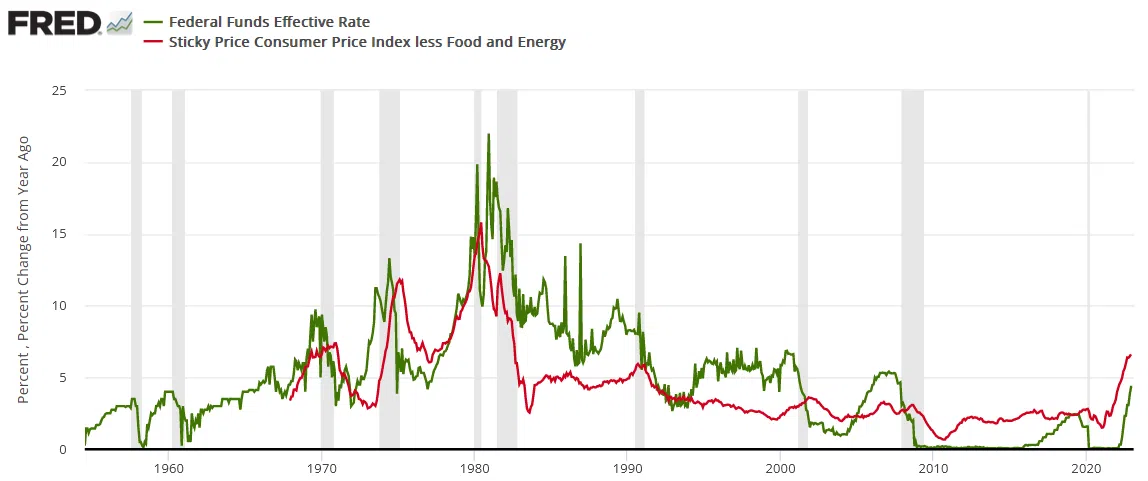
 To explain, the green line above tracks the FFR, the red line above tracks the YoY percentage change in the core Sticky CPI (data starts in the late 1960s), and the vertical gray bars represent recessions.
If you focus your attention solely on the green line, notice how nearly all rate-hike cycles have ended with recessions since 1954? More importantly, please note that the FFR spikes in 1985 and 1986 were short term and occurred alongside a falling core Sticky CPI. Likewise, the FFR’s rise from 1993 to 1995 also occurred alongside a falling core Sticky CPI. As such, the inflation pressures were much lower and recessions were initially avoided before occurring later.
In contrast, the right side of the chart shows how the YoY core Sticky CPI has risen for 17 straight months. As a result, this is nothing like 1985 or 1993.
Consequently, the moral of the story is that we’re not betting against inflation slowing; we’re betting against a soft landing before it returns to 2%; and while the current sentiment makes it seem like a fairy tale ending is on the horizon, the historical data speaks for itself.
In other words, the bulls are betting against historical precedent and placing all of their hopes on Powell’s ability to accomplish something no Fed committee before him has. Would you make that bet? In reality, if Powell struggles to deliver a consistent message during his press conferences, he’s unlikely to engineer a soft landing.
From another angle, let’s break down Powell’s belief that he can tame inflation without a “significant increase in unemployment.”
Please see below:
 To explain, the green line above tracks the FFR, the brown line above tracks the U.S. unemployment rate, and the vertical gray bars represent recessions. If you analyze the relationship, you can see that nearly all rate-hike cycles end with recessions, spikes in unemployment, and as they unfold, the Fed cuts the FFR.
Conversely, the right side of the chart shows that the brown line is at a ~50-year low, while the green line is still rising. So, Powell and the bulls are ignoring the ramifications at their own peril, and it’s likely only a matter of time before the historical relationship returns.
Overall, inflation is only one-half of our bearish fundamental thesis. The second, a recession, is how the cycle should end. But, since the U.S. labor market is so strong right now, the second act is delayed, and that’s why we believe the FFR needs to rise more than expected.
It’s not because we think inflation will spiral out of control, but because the CPI can’t hit 2% when wages are running at 6%+. Therefore, the unemployment rate needs to rise to reduce wage inflation to 2%, and that means the FFR needs to rise to decrease consumption and decrease labor demand. Yet, none of this has happened, and that’s why the current narrative lacks credibility.
As it stands, the outlook for risk assets like gold is only bullish if you believe that history is irrelevant and Powell has figured out something that no Fed Chair before him has. We don’t.
How do you see the cycle ending: soft or hard landing? Why does the crowd put so much faith in Powell’s predictions? Do you believe the Fed can control the fundamentals?
Silver Sees Green After Powell Speaks
While silver rallied intraday on Feb. 1 following Powell’s ambiguous remarks, it still couldn’t close above $24. Moreover, while the crowd assumes that Goldilocks will confront the financial markets in 2023 – meaning rate cuts, low inflation and high corporate earnings – we’ve warned that a realization is unrealistic.
To that point, while we have been employment bulls for many months and still believe the consensus underestimates the peak FFR, the fundamentals have not deviated from our expectations. For example, JOLTs job openings came in at 11.012 million on Feb. 1 and materially outperformed the consensus estimate of 10.250 million.
Please see below:
 Furthermore, the JOLTS spread shows there are nearly 5.3 million more job openings than Americans unemployed.
Please see below:
 To explain, the red line above subtracts the number of unemployed Americans from the number of JOLTS job openings. If you analyze the right side of the chart, you can see that the metric has re-accelerated recently, which is the opposite of what needs to occur to normalize wage inflation to 2%. As such, it’s another indicator of why the Goldilocks narrative lacks fundamental credibility.
To that point, S&P Global released its U.S. Manufacturing PMI on Feb. 1. The headline index improved from 46.2 in December to 46.9 in January, and an excerpt read:
“January data indicated only a fractional rise in workforce numbers at manufacturers. The rate of job creation eased for the fourth month running amid challenges hiring suitable staff and retaining skilled workers.”
Likewise, while the Institute for Supply Management’s (ISM) Manufacturing PMI declined from 48.4 in December to 47.4 in January, the report stated:
“ISM’s Employment Index registered 50.6 percent in January, 0.2 percentage point lower than the seasonally adjusted December reading of 50.8 percent (…).
“Labor management sentiment reversed in the month, with a strong majority of panelists' companies attempting to hire compared to reducing their employment levels. Although layoffs are occurring, there is a 4-to-1 hiring to reduction ratio (2-to-1 in the previous four months) as companies make decisions to retain workforces to support projected second-half growth.”
So, while these are not blowout results like the JOLTS report, the important point is that hiring remains prevalent, and that’s bullish for the FFR. Remember, job openings must decline and the unemployment rate needs to rise to achieve 2% wage inflation, and that’s not happening.
Speaking of which, S&P Global’s report noted:
 Again, while these are not blowout figures, they highlight the nature of jumpy inflation; and the more the bulls price in a soft landing and loosen financial conditions, the more inflation will bounce around and remain elevated.
Finally, a major casualty of the Goldilocks narrative has been the USD Index. With the crowd assuming the Fed is done and a re-acceleration of global growth will help other markets outperform, investors are eager to bid up risk-on currencies like the EUR, the GBP and the AUD.
As evidence, nothing screams a weaker U.S. dollar than flows into emerging markets (EM).
Please see below:
 To explain, the light blue bar on the right side of the chart shows how the most-recent weekly flows into EM debt and equities have soared. As a result, the crowd assumes the USD Index’s best days are in the rearview.
In contrast, the magnitude of the USD Index’s decline makes the medium-term outlook bullish, and we expect a sharp rally before this bear market ends.
Please see below:

To explain, the blue line above tracks the USD Index’s 12-week percentage change. If you analyze the right side of the chart, you can see that the recent slide is on par with major three-month declines throughout history.
However, sharp dispersions often precede sharp reversions, and Morgan Stanley notes that “rebounds often follow.” Therefore, don’t be surprised if the U.S. dollar shocks the consensus in the months ahead.
Overall, while Powell helped initiate another short squeeze across risk assets, silver still could not reclaim $24. Furthermore, while its long-term potential is undeniable, we still expect a sharp medium-term drawdown before its next bull market begins. Consequently, we believe that investors’ faith in Powell will erode as time passes.
How does wage inflation return to 2% without a material decline in the JOLTS spread? Would you buy the EM trade or the USD Index? Do you think the CPI will decline linearly?
The Bottom Line
While Powell moved markets on Feb. 1, he didn’t say anything unexpected. On the one hand, he was hawkish and reiterated his commitment to curbing inflation. On the other hand, he opened the door to pausing if inflation recedes. But, none of this is ‘news,’ as Powell would have stopped hiking rates months ago if inflation had declined rapidly. As such, we believe the crowd underestimates the FFR, and woefully underestimates the odds of a recession before this cycle ends.
In conclusion, the PMs were mixed on Feb. 1, as the intraday reversals were not enough to help gold and silver close in the green. Moreover, while the USD Index and the U.S. 10-Year real yield suffered, profound reversals should occur in the months ahead.
Technical Look at Fundamentals
Let me start by quoting one of the things that we already wrote above:
However, we’ve warned on numerous occasions that the Fed has always pushed the U.S. federal funds rate (FFR) above the peak year-over-year (YoY) percentage change in the core Consumer Price Index (CPI) and that nine of the last 10 bouts of rising inflation have ended with recessions.
The latter – likelihood of a recession – means that the stock market (along with silver, mining stocks, and – in particular – junior mining stocks) is likely to fall. Given how far it rose on the various stimulus-based programs, it can also fall substantially. This is not to be taken lightly.
The former implies that either higher rates or lower inflation, or both, are possible. Or at least a faster increase in rates than in inflation (or a slower decline in rates than in inflation).
In fact, let’s see the long-term chart once again.
Here’s what gold did in the long run.

The above chart features the gold price in nominal terms, and the below chart shows the price of gold in real terms (adjusted for inflation based on the official inflation statistics).
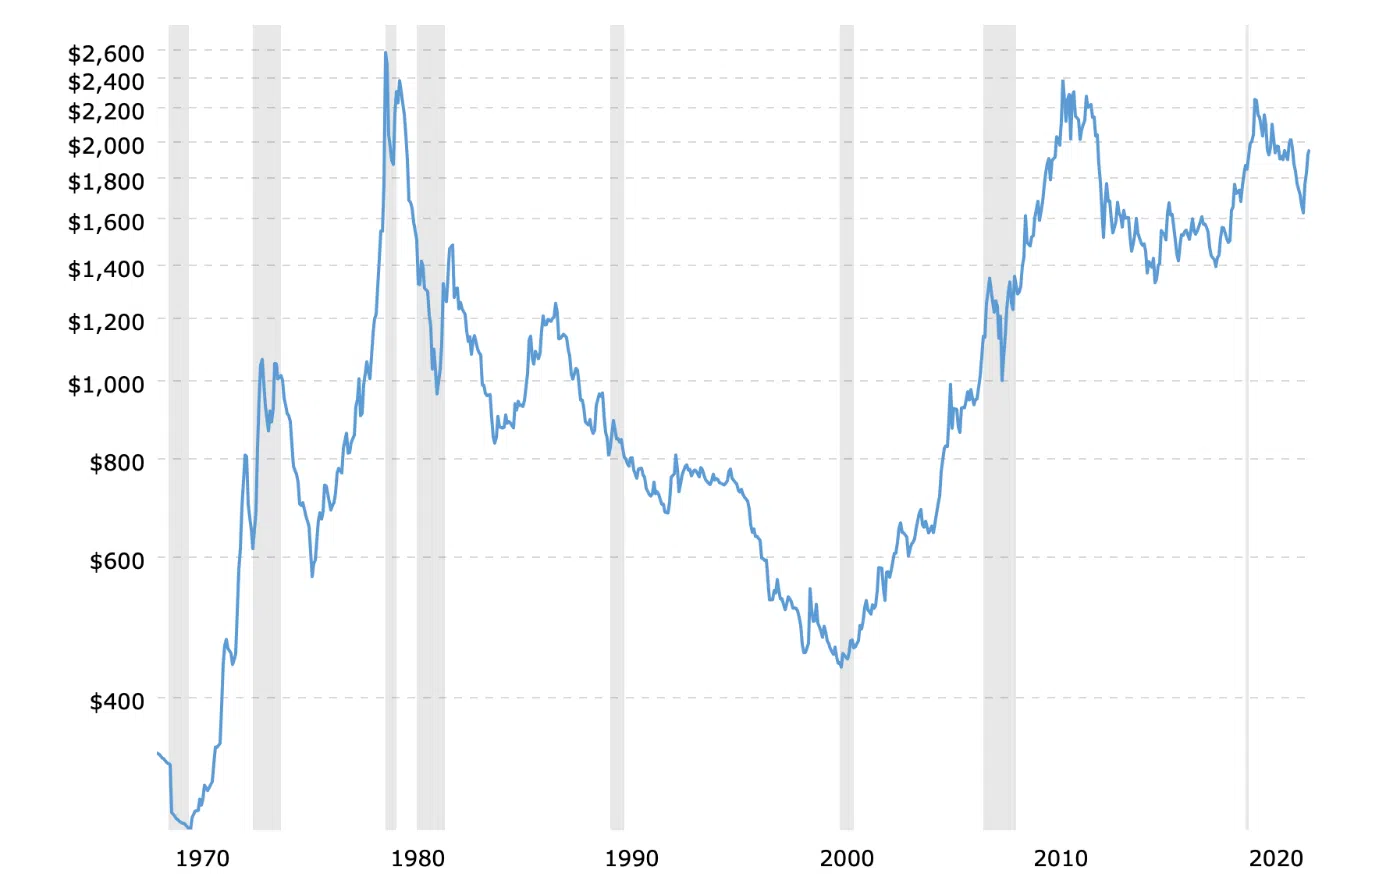
Source: Macrotrends.net
The thing that I want to emphasize here is gold’s performance in the 70s and 80s. There were two major declines in gold – one started in the mid-70s and another in 1980. Let’s zoom in a bit on the former, as it might not be clear based on the above charts.
Source: chartsrus.com
What happened on the rates vs. CPI chart at those times? There were some major shifts in their relative values.
To make it easier to see what was going on, let’s take a look at yet another chart – the one featuring both nominal and real Treasury yields. Of course, the yields are closely linked to the interest rates, so it’s pretty much the same chart.

The real yield is what is of the greatest importance here.
Why? Because that is what one effectively gets by postponing consumption, saving the capital, and investing (technically, lending) it at very low risk.
If the real yield moves below 0%, it means that one is effectively losing money while just earning interest on Treasuries. That’s when gold becomes highly sought after. Gold pays no interest, but it’s been currency throughout history, so it’s viewed as something safe and stable in the long run. Therefore, it seems better to just hold gold, which at least won’t (theoretically) lose value, while fiat money does. In other words, gold is then used as an inflation hedge.
When the real yields rally, however, the situation turns upside down.
Since gold doesn’t provide interest, and rising real yields mean that it makes more and more sense to have capital in the form of money that pays this increasing interest (like Treasuries), the appeal for gold ownership declines.
That’s why real yields and real interest rates are one of the two key fundamental drivers of gold prices. The other is the USD Index.
Indeed, the lows in real yields (mid-70s and 1980) corresponded to tops in the gold price.
So, again, to clarify:
- Rising real interest rates / yields are extremely likely to trigger declines in the gold price.
- Declining real interest rates / yields are extremely likely to trigger rallies in the gold price.
The above might not work in the short term, but it’s likely to work over the medium- and long term. After all, the markets can be particularly emotional in the short run and move on just about anything, regardless of whether it makes sense or not.
All right, to clarify even more, what exactly are those real interest rates? How to calculate them?
Here’s the definition from Google / Wikipedia.

Nominal interest rate minus the (expected) inflation rate. This approximation will suffice.
Where are the nominal interest rates going now? Higher. Sure, they might be going higher at a slower pace than previously, but they are going higher, and – as history has shown – they will continue to rise until the federal funds rate rises above the year-over-year CPI reading.
The latest year-over-year CPI reading in the U.S. (from Jan. 12, 2023) was 6.5%.
The FFR is about 2% below that.
The above and the historical tendencies imply that either the CPI has to move lower by at least 2% or the FFR has to move higher by 2% while the CPI is unchanged – or some combination of the above (which is most likely).
Either way, this means that the real interest rate is likely to rally by at least 2% from its current levels.
Let me quote what I already stated above:
Rising real interest rates / yields are extremely likely to trigger declines in the gold price.
This means that we are extremely likely to see big declines in the gold price.
What are the real rates doing now?

Well, they are soaring, of course. However, as I wrote earlier, the link between real rates and the gold price doesn’t have to work in the short term, as the markets can focus on all sorts of things due to technical/emotional reasons.
I won’t say that the current rally in real rates is unprecedented, but we haven’t seen this kind of upswing in a long time. The last time, we saw something of at least similar magnitude was right before the year 2000. What happened to the gold price back then?

Gold was after the “Brown Bottom”, but it declined, nonetheless.

In the case of the HUI Index – proxy for gold stocks – it was right before the final part of the slide.
Yes, this is as extremely bearish as it looks.
These are some of the reasons why this short-term rally is a counter-trend rally. The things that I’m covering in my day-to-day analyses are important too, but they are not as important as the above indications. I’m simply not commenting on the things that don’t change that often, but the day-to-day price swings do change often, and I’m commenting on them because they often make people concerned about the outlook.
Speaking of the short-term situation, let’s take a look at what happened and what didn’t happen yesterday.
Technically Speaking

Gold (the GLD ETF) moved slightly above its recent high.
Silver (the SLV ETF) moved higher but didn’t manage to match even its most recent short-term high – we saw a lower high.
Junior mining stocks (the GDXJ ETF) moved higher but didn’t manage to hold above their Jan. 9 high.
Consequently, while we don’t see any indication from the gold-silver dynamics, we see that mining stocks underperform gold, and we also see that junior miners are weaker than senior miners.
Miners’ underperformance of gold is bearish – it’s really that simple.
The fact that miners failed to move above their Jan. 9 high is also telling.
Looking at the GDXJ on a stand-alone basis shows that yesterday’s rally didn’t change anything.

The link between the current situation and what we saw in June 2021 and April 2022 remains intact.
In both previous cases, there was a small – but sharp – daily upswing before the decline continued. In the case of the 2021 analogy, we can see the similarity even in the RSI indicator, where it moved slightly up from about 50.
Consequently, the bearish implications remain intact, as does the sell signal from the MACD indicator, which is bearish (well, it’s a sell signal after all) on its own but has an additional bearish meaning because it shows how the current situation is indeed similar to what happened at the 2022 top.
All in all, the outlook for the precious metals market remains extremely bearish for the following weeks and months, despite all the bullish feelings and emotions that yesterday’s Fedspeak might have generated.
Overview of the Upcoming Part of the Decline
- It seems to me that the corrective upswing is over (or about to be over) and that the next big move lower is already underway (or that it’s about to start).
- If we see a situation where miners slide in a meaningful and volatile way while silver doesn’t (it just declines moderately), I plan to – once again – switch from short positions in miners to short positions in silver. At this time, it’s too early to say at what price levels this could take place and if we get this kind of opportunity at all – perhaps with gold prices close to $1,500 - $1,550.
- I plan to switch from the short positions in junior mining stocks or silver (whichever I’ll have at that moment) to long positions in junior mining stocks when gold / mining stocks move to their 2020 lows (approximately). While I’m probably not going to write about it at this stage yet, this is when some investors might consider getting back in with their long-term investing capital (or perhaps 1/3 or 1/2 thereof).
- I plan to return to short positions in junior mining stocks after a rebound – and the rebound could take gold from about $1,450 to about $1,550, and it could take the GDXJ from about $20 to about $24. In other words, I’m currently planning to go long when GDXJ is close to $20 (which might take place when gold is close to $1,450), and I’m planning to exit this long position and re-enter the short position once we see a corrective rally to $24 in the GDXJ (which might take place when gold is close to $1,550).
- I plan to exit all remaining short positions once gold shows substantial strength relative to the USD Index while the latter is still rallying. This may be the case with gold prices close to $1,400 and GDXJ close to $15 . This moment (when gold performs very strongly against the rallying USD and miners are strong relative to gold after its substantial decline) is likely to be the best entry point for long-term investments, in my view. This can also happen with gold close to $1,400, but at the moment it’s too early to say with certainty.
- The above is based on the information available today, and it might change in the following days/weeks.
You will find my general overview of the outlook for gold on the chart below:

Please note that the above timing details are relatively broad and “for general overview only” – so that you know more or less what I think and how volatile I think the moves are likely to be – on an approximate basis. These time targets are not binding nor clear enough for me to think that they should be used for purchasing options, warrants, or similar instruments.
Letters to the Editor
We received a few messages over e-mail, but as we are moving to our new platform, we will be transferring them below the articles as comments – and that’s where we’ll be replying to them.
Asking your questions below the articles or in the spaces called “Ask the Community” or “Position Sizes” directly will help us deliver a reply sooner. In some cases, someone from the community might reply and help even before we do.
Please remember about the Pillars of our Community, especially about the Kindness of Speech Pillar.
Also, if there’s anything that you’re unhappy with, it’s best to send us a message at [email protected].
Please note that this section is going to go away within the next 1-8 weeks, as you can add comments/questions below the article on Golden Meadow – the platform that we’re using to provide our analyses. Your notification e-mails include an invitation link that allows you to access the “Gold Trading Alerts” space.
Also, if you haven’t had the chance to see the video, in which I’m talking about the new platform and why we essentially moved from Sunshine Profits to Golden Meadow, I strongly encourage you to do so:
Summary
Summing up, it seems that the major bottom in the USD Index is in (or at hand), while the correction in stocks, gold, silver, and mining stocks is over – or very close to being over.
Gold and silver corrected about 61.8% of their 2022 decline, while junior miners corrected a bit more than 50% of the decline, but not more than 61.8% thereof. This is exactly how the big 2021 and 2022 declines in junior miners started.
Given the above, gold’s very long-term resistance (the 2011 high!), and the situation in the USD Index, it seems that the next big move lower in the precious metals sector is about to start.
Now, as more investors realize that interest rates will have to rise sooner than expected, the prices of precious metals and mining stocks (as well as other stocks) are likely to fall. In my opinion, the current trading position is going to become profitable in the following weeks, and quite possibly in the following days. And while I can’t promise any kind of performance, I fully expect it to become very profitable before it’s over and to prolong our 2022 winning streak.
After the final sell-off (that takes gold to about $1,350-$1,500), I expect the precious metals to rally significantly. The final part of the decline might take as little as 1-5 weeks, so it's important to stay alert to any changes.
As always, we'll keep you – our subscribers – informed.
To summarize:
Trading capital (supplementary part of the portfolio; our opinion): Full speculative short positions (300% of the full position) in junior mining stocks are justified from the risk to reward point of view with the following binding exit profit-take price levels:
Mining stocks (price levels for the GDXJ ETF): binding profit-take exit price: $20.32; stop-loss: none (the volatility is too big to justify a stop-loss order in case of this particular trade)
Alternatively, if one seeks leverage, we’re providing the binding profit-take levels for the JDST (2x leveraged). The binding profit-take level for the JDST: $22.87; stop-loss for the JDST: none (the volatility is too big to justify a SL order in case of this particular trade).
For-your-information targets (our opinion; we continue to think that mining stocks are the preferred way of taking advantage of the upcoming price move, but if for whatever reason one wants / has to use silver or gold for this trade, we are providing the details anyway.):
Silver futures downside profit-take exit price: $14.32
SLV profit-take exit price: $13.42
ZSL profit-take exit price: $48.87
Gold futures downside profit-take exit price: $1,504
HGD.TO – alternative (Canadian) 2x inverse leveraged gold stocks ETF – the upside profit-take exit price: $16.47
HZD.TO – alternative (Canadian) 2x inverse leveraged silver ETF – the upside profit-take exit price: $36.87
Long-term capital (core part of the portfolio; our opinion): No positions (in other words: cash)
Insurance capital (core part of the portfolio; our opinion): Full position
Whether you’ve already subscribed or not, we encourage you to find out how to make the most of our alerts and read our replies to the most common alert-and-gold-trading-related-questions.
Please note that we describe the situation for the day that the alert is posted in the trading section. In other words, if we are writing about a speculative position, it means that it is up-to-date on the day it was posted. We are also featuring the initial target prices to decide whether keeping a position on a given day is in tune with your approach (some moves are too small for medium-term traders, and some might appear too big for day-traders).
Additionally, you might want to read why our stop-loss orders are usually relatively far from the current price.
Please note that a full position doesn't mean using all of the capital for a given trade. You will find details on our thoughts on gold portfolio structuring in the Key Insights section on our website.
As a reminder - "initial target price" means exactly that - an "initial" one. It's not a price level at which we suggest closing positions. If this becomes the case (as it did in the previous trade), we will refer to these levels as levels of exit orders (exactly as we've done previously). Stop-loss levels, however, are naturally not "initial", but something that, in our opinion, might be entered as an order.
Since it is impossible to synchronize target prices and stop-loss levels for all the ETFs and ETNs with the main markets that we provide these levels for (gold, silver and mining stocks - the GDX ETF), the stop-loss levels and target prices for other ETNs and ETF (among other: UGL, GLL, AGQ, ZSL, NUGT, DUST, JNUG, JDST) are provided as supplementary, and not as "final". This means that if a stop-loss or a target level is reached for any of the "additional instruments" (GLL for instance), but not for the "main instrument" (gold in this case), we will view positions in both gold and GLL as still open and the stop-loss for GLL would have to be moved lower. On the other hand, if gold moves to a stop-loss level but GLL doesn't, then we will view both positions (in gold and GLL) as closed. In other words, since it's not possible to be 100% certain that each related instrument moves to a given level when the underlying instrument does, we can't provide levels that would be binding. The levels that we do provide are our best estimate of the levels that will correspond to the levels in the underlying assets, but it will be the underlying assets that one will need to focus on regarding the signs pointing to closing a given position or keeping it open. We might adjust the levels in the "additional instruments" without adjusting the levels in the "main instruments", which will simply mean that we have improved our estimation of these levels, not that we changed our outlook on the markets. We are already working on a tool that would update these levels daily for the most popular ETFs, ETNs and individual mining stocks.
Our preferred ways to invest in and to trade gold along with the reasoning can be found in the how to buy gold section. Furthermore, our preferred ETFs and ETNs can be found in our Gold & Silver ETF Ranking.
As a reminder, Gold & Silver Trading Alerts are posted before or on each trading day (we usually post them before the opening bell, but we don't promise doing that each day). If there's anything urgent, we will send you an additional small alert before posting the main one.
Thank you.
Przemyslaw K. Radomski, CFA
Founder, Editor-in-chief