

Briefly: in our opinion, full (200% of the regular size of the position) speculative short positions in gold, silver and mining stocks are justified from the risk/reward perspective at the moment of publishing this alert.
In today’s Alert we have little to comment on, because we described quite a lot yesterday. We even indicated that there might be the final pop-up in the gold price before the reversal takes place this week, so today’s pre-market upswing is not really anything new either.
The key thing that we would like to emphasize today is the situation in the USD Index.
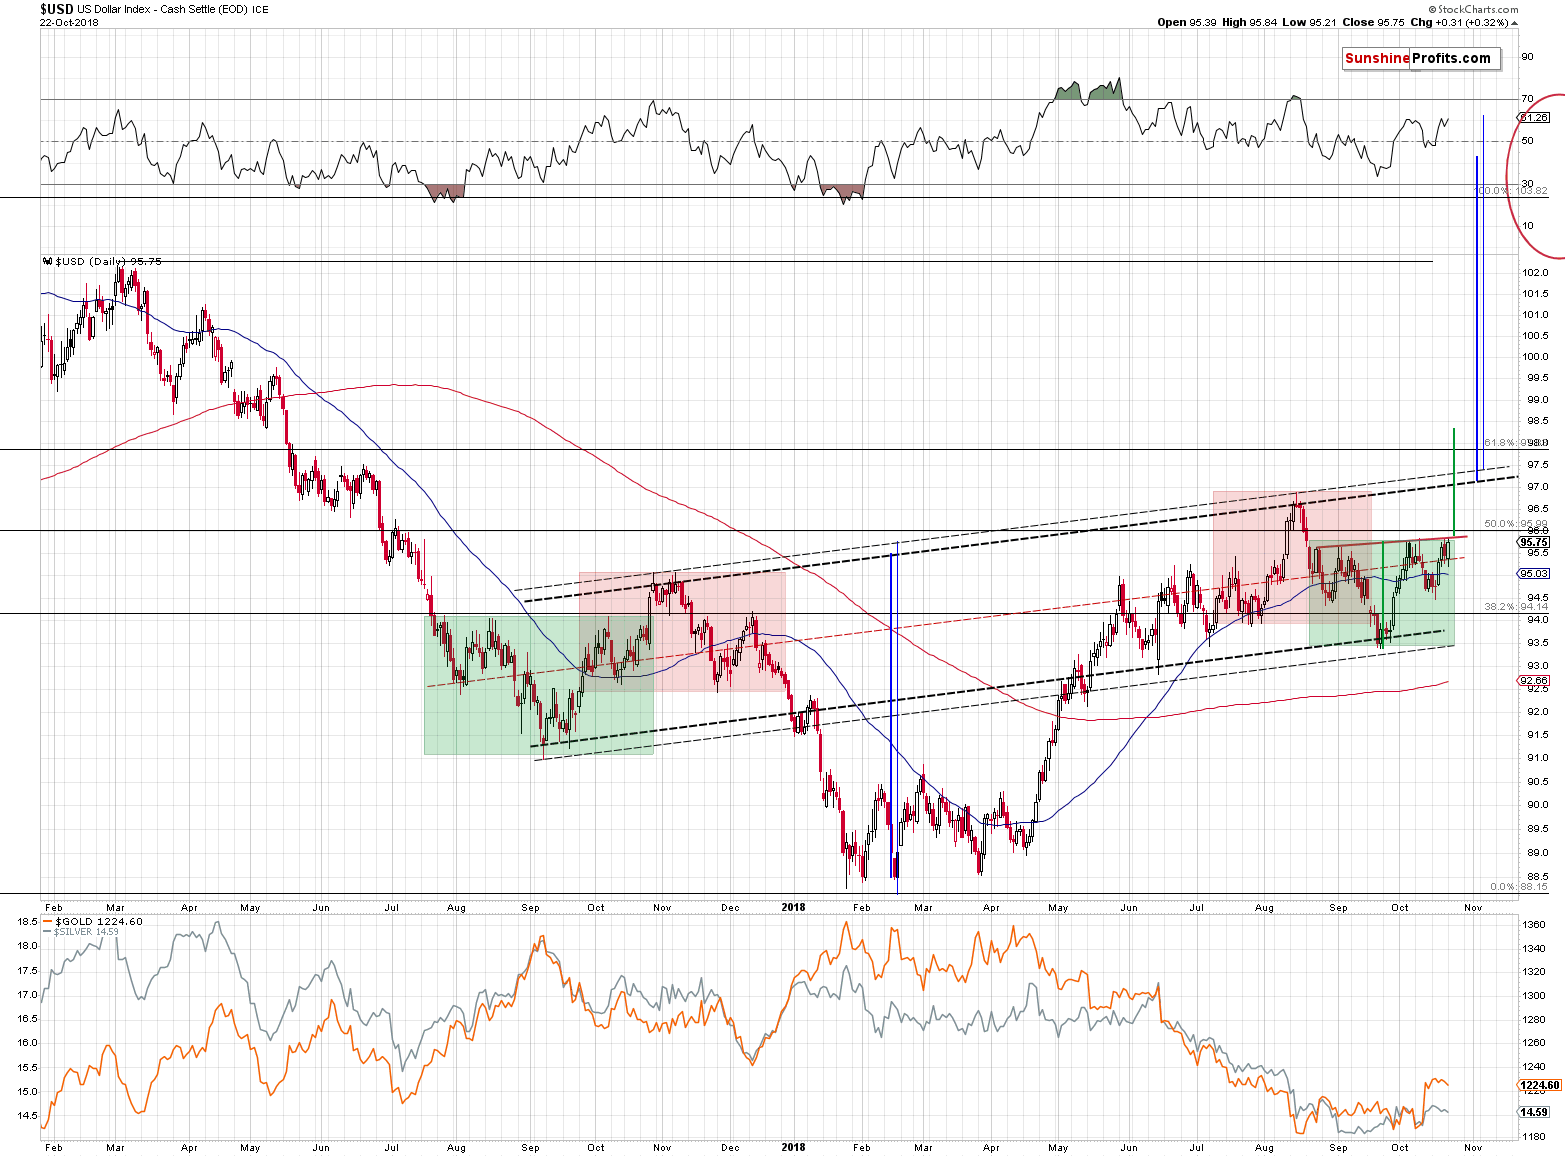
We already discussed the existence of the reflective pattern in the USD Index in the previous Alerts, but there’s one thing that we would like to add. Namely, we would like to address the potential (! – not completed) inverse head-and-shoulders pattern that is probably being formed.
But, first things first. The remarkable thing about the reflective nature of the recent price movement is that it is so similar. The October / November 2017 top is like the August 2018 top as they both took form of head-and-shoulders tops. We marked them with red. What’s even more profound is that outside shoulders of the top above-mentioned formations (left in 2017 and right in 2018) were the inside shoulders of the inverse head-and-shoulders patterns. We marked them with green. The reflective nature of the pattern is even clearer than we thought.
Now, the current inverse head-and-shoulders pattern has no direct implications yet as the price has not yet broken above its neck level, let alone confirmed such breakout. But, in light of the striking similarity between the 2017 decline and this year’s upswing, it’s likely that this formation will be completed.
The completion of the local (green) inverse head-and-shoulders pattern would provide us with the target at about 98.4, which means that it would likely result in a breakout above the medium-term inverse head-and-shoulders pattern that has its own target well above 100 – at about 103. In other words, based on the above-mentioned patterns, a move to the 2017 high in the USDX appears likely.
The above rally would perfectly fit the long-term analogies in the USD Index.
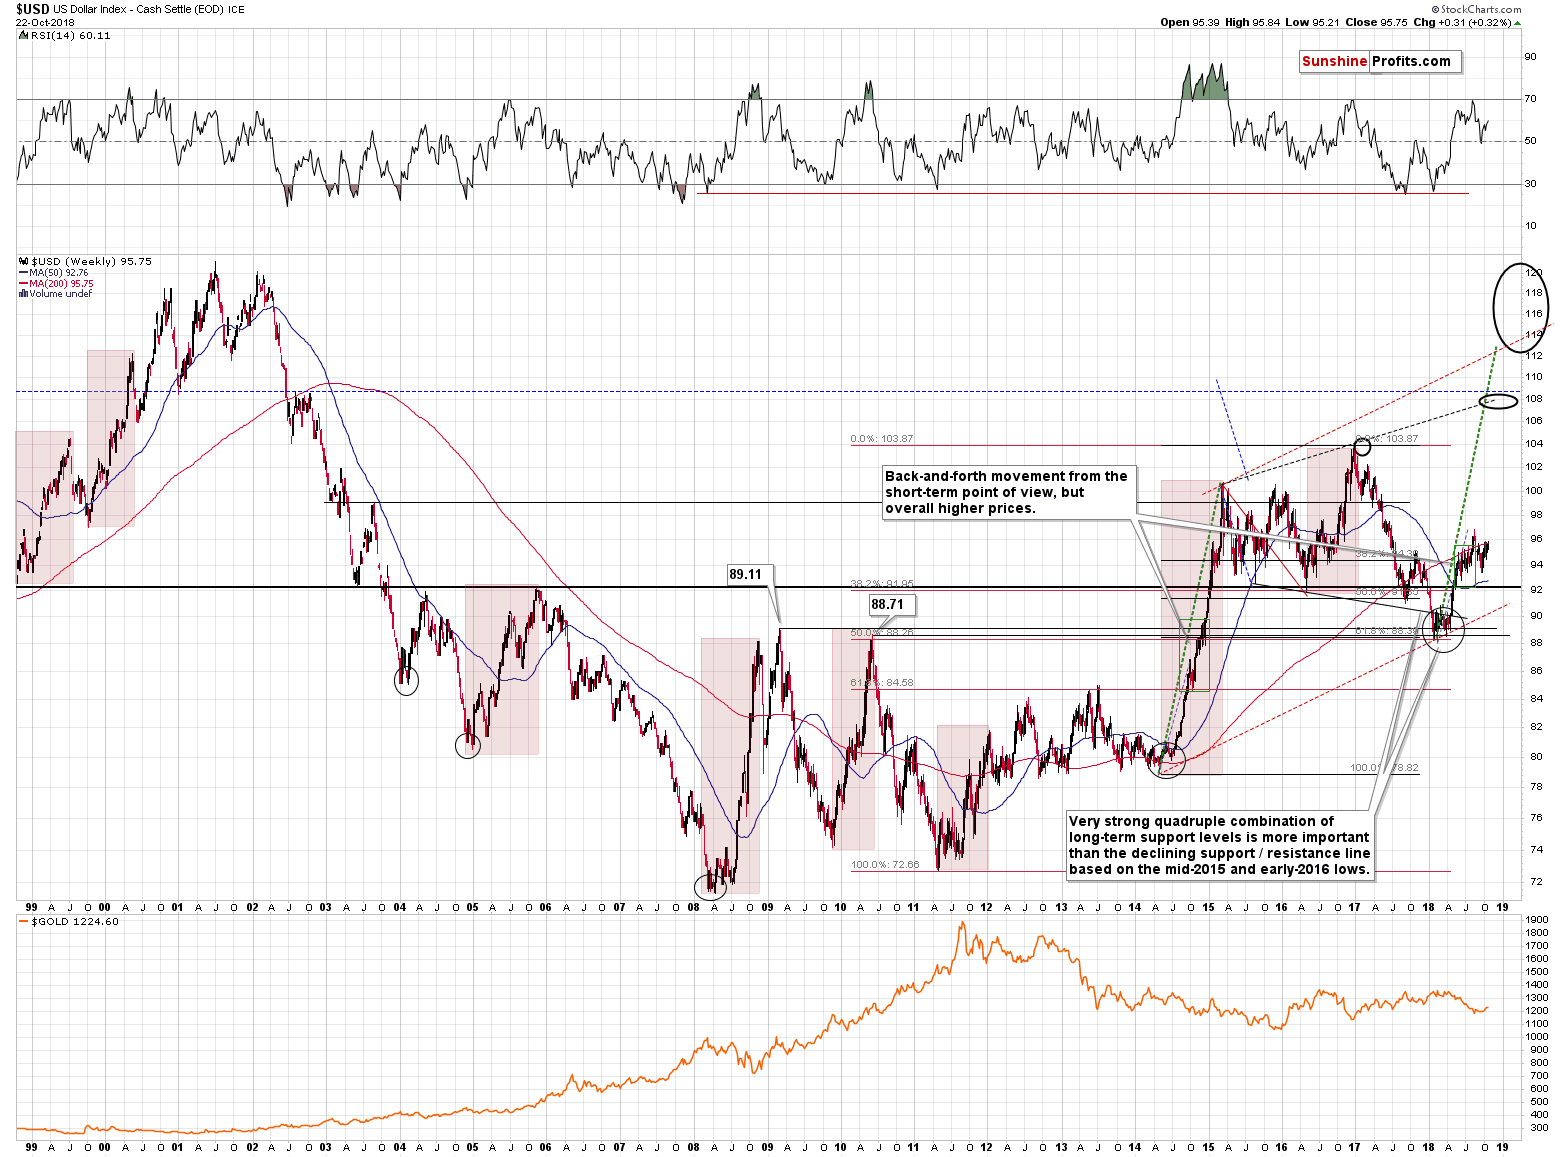
This year’s rally is still similar to what we saw in 2008, 2010 and to the 2014-2015 upswing. The current consolidation is bigger, but still similar to the one that we saw in 2010. Please note that based on the above chart, the USD Index is likely to move above the 2017 high, perhaps significantly so – to the 108 level, or even higher.
The implications for the precious metals market are very bearish.
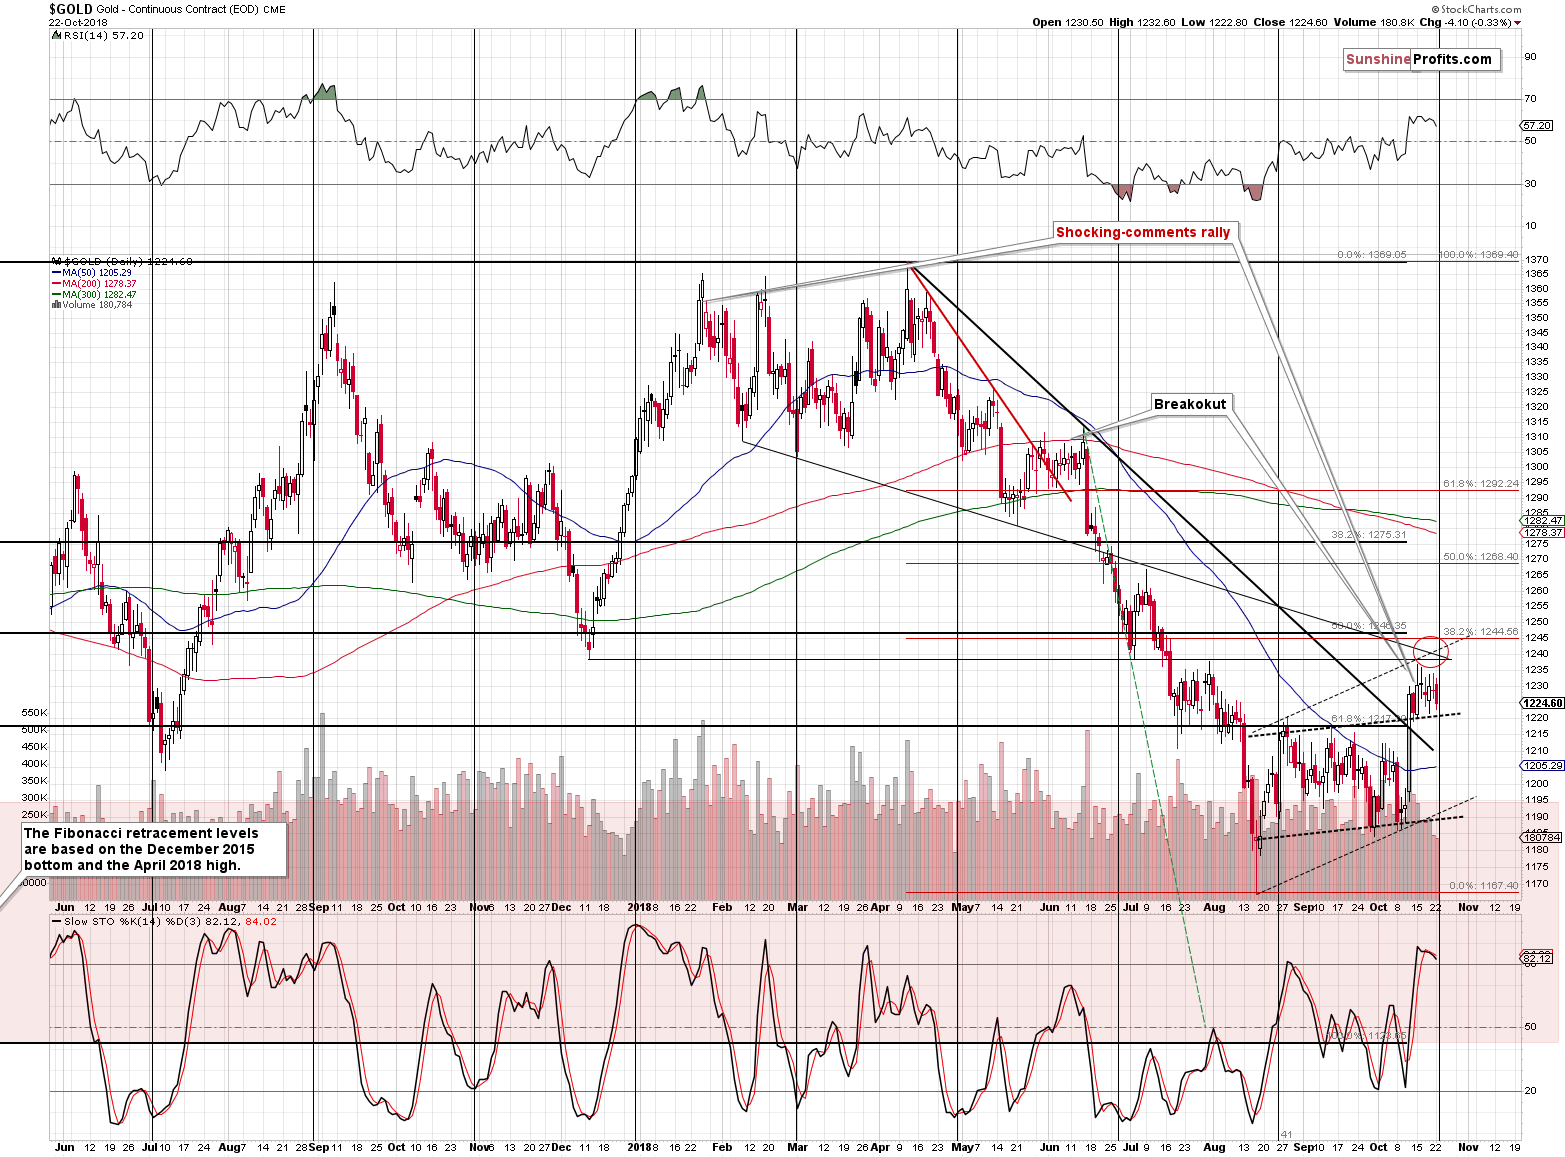
On the short-term note, however, we could still see a move to our target area – to its upper part. At the moment of writing these words, gold futures are trading bit below $1,240, while the pre-market high was $1,239.80. Consequently, the top may already be in, or we may see gold a few dollars higher before this week’s reversal takes place.
The key thing to keep in mind is that gold’s upswing is just temporary and that we have multiple signs that confirm that the real outlook is bearish – we discussed some of them yesterday.
Important Analyses
Before summarizing, we would like to emphasize that we have recently posted several analyses that are very important and that one should keep in mind, especially in the next several weeks. If you haven’t had the chance of reading them previously, we encourage you to do so today:
- Dear Gold Investor - Letters from 2013 - Analogy to 2013, which should make it easier to trade the upcoming sizable upswing (if enough factors point to it, that is) and to enter the market close to the final bottom.
- Gold to Soar Above $6,000 - discussion of gold’s long-term upside target of $6,000.
- Preparing for THE Bottom in Gold: Part 6 – What to Buy - extremely important analysis of the portfolio structure for the next huge, multi-year rally in the precious metals.
- Preparing for THE Bottom in Gold: Part 7 – Buy-and-hold on Steroids - description of a strategy dedicated to significantly boosting one’s long-term investment returns while staying invested in the PM sector.
- Gold’s Downside Target, Upcoming Rebound, and Miners’ Buy Plan - details regarding the shape of the following price moves, a buying plan for mining stocks, and a brief discussion of the final price targets for the current decline.
- Gold: What Happened vs. What Changed - discussion of the latest extreme readings from gold’s CoT report
- Key Factors for Gold & Silver Investors - discussion of key, long-term factors that support the bearish outlook for PMs. We are often asked what makes us so bearish – this article is a reply to this question.
- The Upcoming Silver Surprise - two sets of price targets for gold, silver and mining stocks: the initial and the final one.
- Precious Metals Sector: It’s 2013 All Over Again - comparison between 2013 and 2018 throughout the precious metals sector, the general stock market and the USD Index. Multiple similarities point to the repeat of a 2013-style volatile decline in the PMs.
- Changing One's Mind - Why, When, and How – discussing the way of analyzing the market that helps to stay focused on the growing one’s capital while not being influenced by the loss aversion bias. This essay might be particularly useful in light of the recent upswing in the PMs.
Summary
Summing up, the breakout in gold is a bullish development for the short term, but the rally that was likely to be seen based on it, is most likely ending. There are multiple bearish signs in place that confirm that the rally is just a correction within a bigger decline and there are indications that point to a reversal taking place this week. All in all, it seems that the huge profits on our short positions will soon become enormous, even if it takes a few more days before it happens.
Also, we are moving the stop-loss level for gold $4 higher.
As always, we’ll keep you – our subscribers – informed.
To summarize:
Trading capital (supplementary part of the portfolio; our opinion): Full short positions (200% of the full position) in gold, silver and mining stocks are justified from the risk/reward perspective with the following stop-loss orders and exit profit-take price levels:
- Gold: profit-take exit price: $1,062; stop-loss: $1,257; initial target price for the DGLD ETN: $82.96; stop-loss for the DGLD ETN $49.27
- Silver: profit-take exit price: $12.72; stop-loss: $15.76; initial target price for the DSLV ETN: $46.97; stop-loss for the DSLV ETN $27.37
- Mining stocks (price levels for the GDX ETF): profit-take exit price: $13.12; stop-loss: $20.83; initial target price for the DUST ETF: $80.97; stop-loss for the DUST ETF $27.67
Note: the above is a specific preparation for a possible sudden price drop, it does not reflect the most likely outcome. You will find a more detailed explanation in our August 1 Alert. In case one wants to bet on junior mining stocks’ prices (we do not suggest doing so – we think senior mining stocks are more predictable in the case of short-term trades – if one wants to do it anyway, we provide the details), here are the stop-loss details and target prices:
- GDXJ ETF: profit-take exit price: $17.52; stop-loss: $31.23
- JDST ETF: initial target price: $154.97 stop-loss: $51.78
Long-term capital (core part of the portfolio; our opinion): No positions (in other words: cash)
Insurance capital (core part of the portfolio; our opinion): Full position
Important Details for New Subscribers
Whether you already subscribed or not, we encourage you to find out how to make the most of our alerts and read our replies to the most common alert-and-gold-trading-related-questions.
Please note that the in the trading section we describe the situation for the day that the alert is posted. In other words, it we are writing about a speculative position, it means that it is up-to-date on the day it was posted. We are also featuring the initial target prices, so that you can decide whether keeping a position on a given day is something that is in tune with your approach (some moves are too small for medium-term traders and some might appear too big for day-traders).
Plus, you might want to read why our stop-loss orders are usually relatively far from the current price.
Please note that a full position doesn’t mean using all of the capital for a given trade. You will find details on our thoughts on gold portfolio structuring in the Key Insights section on our website.
As a reminder – “initial target price” means exactly that – an “initial” one, it’s not a price level at which we suggest closing positions. If this becomes the case (like it did in the previous trade) we will refer to these levels as levels of exit orders (exactly as we’ve done previously). Stop-loss levels, however, are naturally not “initial”, but something that, in our opinion, might be entered as an order.
Since it is impossible to synchronize target prices and stop-loss levels for all the ETFs and ETNs with the main markets that we provide these levels for (gold, silver and mining stocks – the GDX ETF), the stop-loss levels and target prices for other ETNs and ETF (among other: UGLD, DGLD, USLV, DSLV, NUGT, DUST, JNUG, JDST) are provided as supplementary, and not as “final”. This means that if a stop-loss or a target level is reached for any of the “additional instruments” (DGLD for instance), but not for the “main instrument” (gold in this case), we will view positions in both gold and DGLD as still open and the stop-loss for DGLD would have to be moved lower. On the other hand, if gold moves to a stop-loss level but DGLD doesn’t, then we will view both positions (in gold and DGLD) as closed. In other words, since it’s not possible to be 100% certain that each related instrument moves to a given level when the underlying instrument does, we can’t provide levels that would be binding. The levels that we do provide are our best estimate of the levels that will correspond to the levels in the underlying assets, but it will be the underlying assets that one will need to focus on regarding the signs pointing to closing a given position or keeping it open. We might adjust the levels in the “additional instruments” without adjusting the levels in the “main instruments”, which will simply mean that we have improved our estimation of these levels, not that we changed our outlook on the markets. We are already working on a tool that would update these levels on a daily basis for the most popular ETFs, ETNs and individual mining stocks.
Our preferred ways to invest in and to trade gold along with the reasoning can be found in the how to buy gold section. Additionally, our preferred ETFs and ETNs can be found in our Gold & Silver ETF Ranking.
As a reminder, Gold & Silver Trading Alerts are posted before or on each trading day (we usually post them before the opening bell, but we don't promise doing that each day). If there's anything urgent, we will send you an additional small alert before posting the main one.
=====
Latest Free Trading Alerts:
The first session of the week encouraged oil bears to another attack on the nearest support zone. Despite the initial success and a fresh October low, the buyers withstood their opponents’ pressure once again, blocked the way to lower levels and pushed the price of the commodity right under the barrier of $70. Do oil bulls have any solid technical arguments on their side to fight for higher prices of black gold?
=====
Thank you.
Sincerely,
Przemyslaw Radomski, CFA
Founder, Editor-in-chief, Gold & Silver Fund Manager
Gold & Silver Trading Alerts
Forex Trading Alerts
Oil Investment Updates
Oil Trading Alerts

