

Briefly: in our opinion, full (300% of the regular position size) speculative short positions in mining stocks are justified from the risk/reward point of view at the moment of publishing this Alert.
Gold is likely to plunge to $1,700, but not without an additional quick upswing first.
Gold just plunged over $100 in one day, while silver declined over $4. Miners declined significantly as well. Many investors and traders were caught off-guard by these moves, but not you. You knew very well that a dramatic decline was coming, and you also knew - based on what we wrote yesterday - that the move lower would likely not take form of a straight line. We wrote that gold would likely bounce from its rising support line at about $1,890. And what happened?
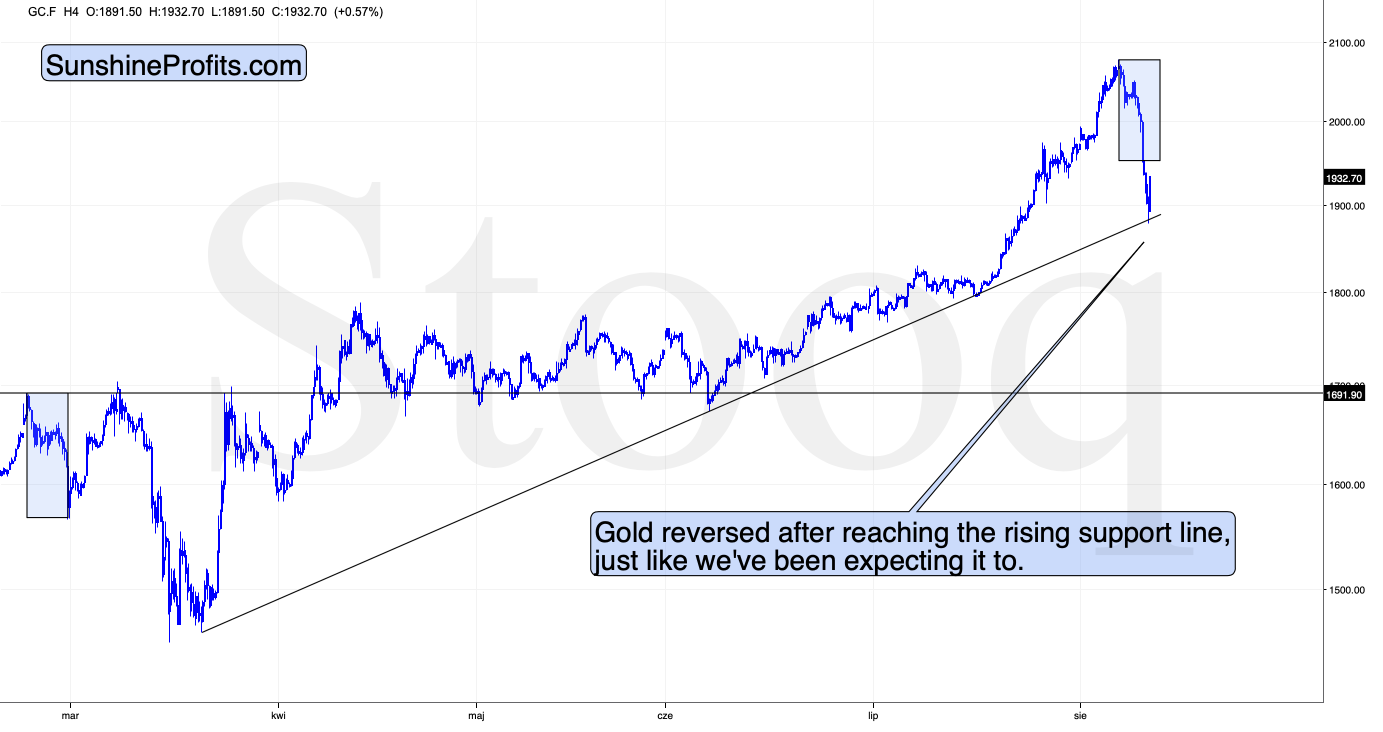
In today's pre-market trading, gold did exactly that. It moved to the rising support line, touched it, and rallied back up.
In yesterday's analysis, we wrote the following:
Gold declined in a specific zig-zag pattern, which is a consolidation pattern. We saw something somewhat similar in late February. The initial decline was not THE decline yet. Gold first tested the previous high and then topped in the most profound way. The thing that confirmed the top was when gold failed to hold the breakout above the previous highs. Will we see something like that once again?
It's unclear at this time. The shape of the decline so far makes both outcomes possible.
Based on the fact that gold reached its support line, a rebound is likely.
We copied the early-2020 decline to the current situation, so that it's clear that both took similar shape and both took similar amount of time. The current decline was bigger and a bit shorter, so we might expect the corrective upswing to be also quicker.
We've been writing about a smaller corrective upswing after gold reaches the rising support line, but given the most recent major top (early 2020) and the most similar top with regard to price at which it was formed (2011), it seems that we shouldn't rule out a move even back to the previous high, before the decline really starts.
The USD Index seems to have formed a double-bottom pattern, but... We still can't rule out a scenario in which the double-bottom pattern would turn into a triple-bottom pattern. The USDX just reversed and declined a bit, and gold reacted with another rally. So, it seems that if the USD Index continues to trade sideways, gold will do the same thing.
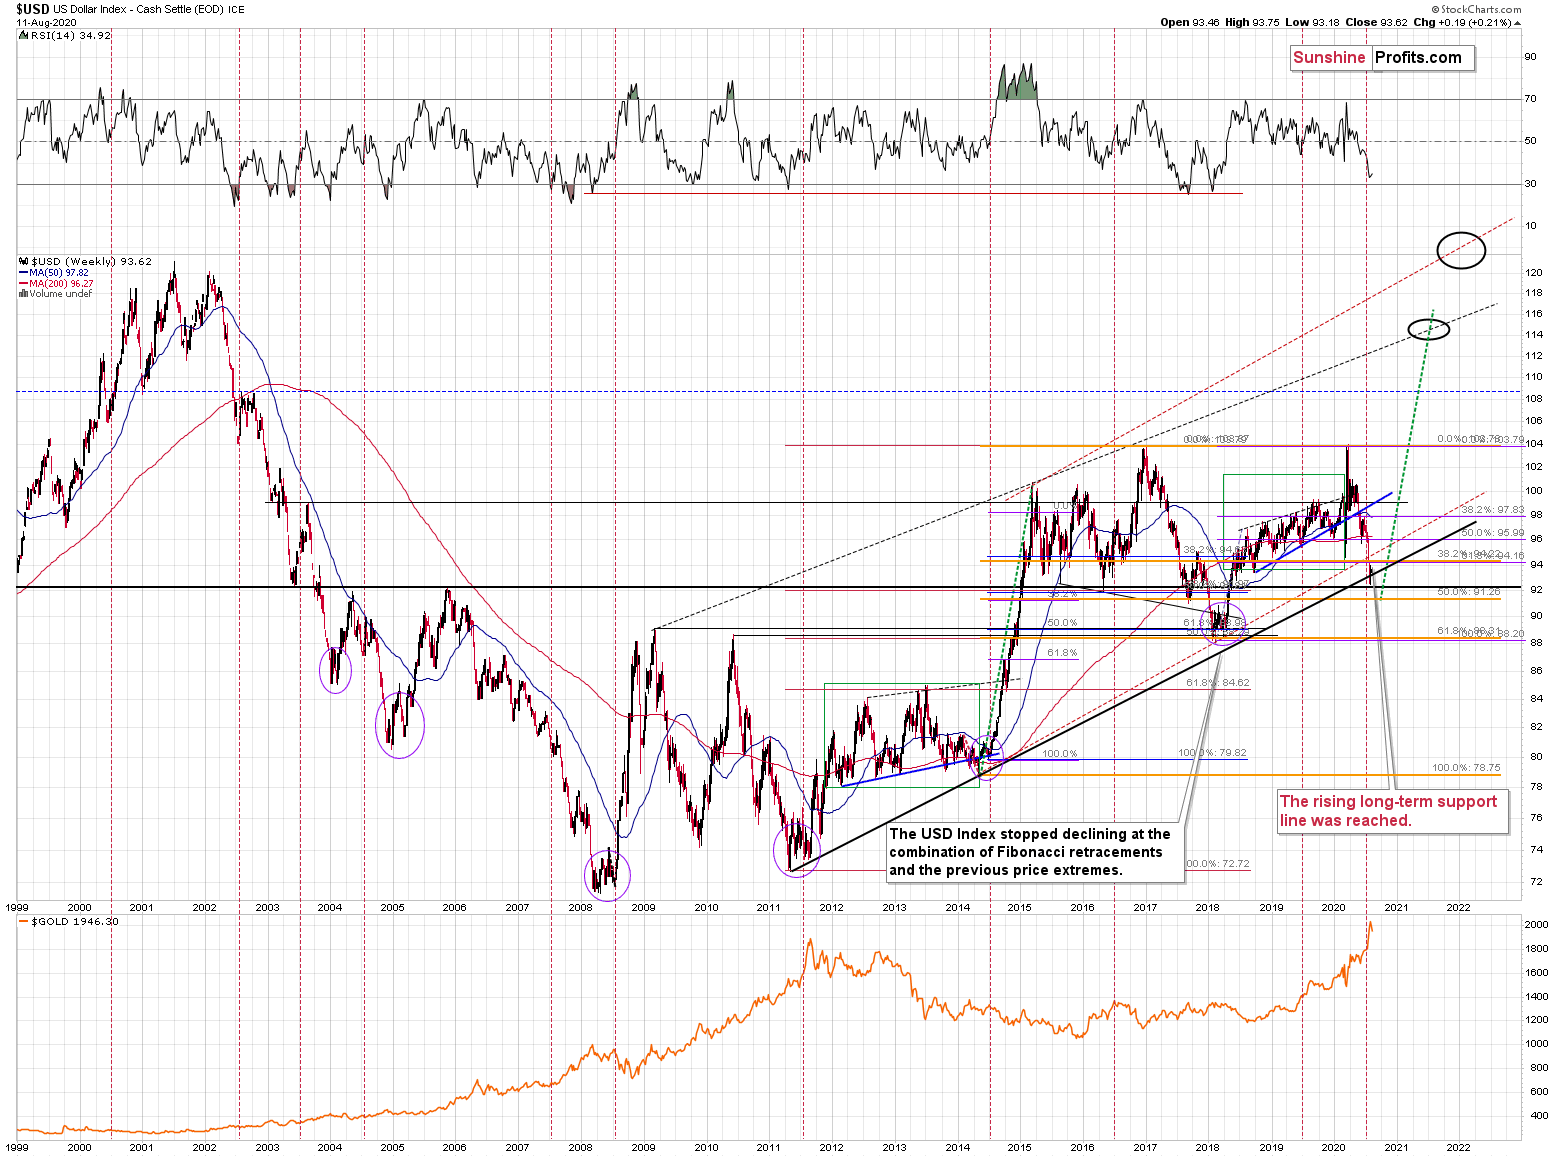
After all, most of the bottoms in the USD Index that formed mid-year (marked with purple ellipses) were rather broad, so we wouldn't rule out something similar also this time.
Then again, gold is very overbought in the short run (and so is silver and the rest of the precious metals sector), so it's likely to be vulnerable to a meaningful show of strength in the USDX.
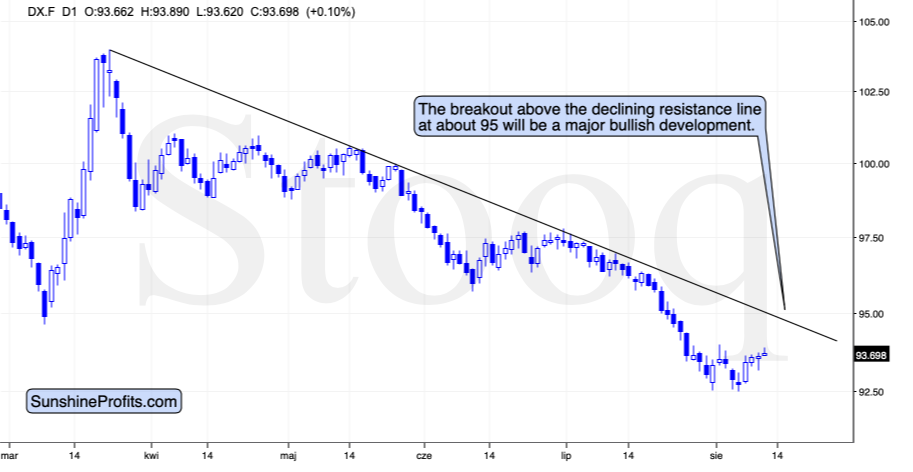
Will the latter finally rally soon? This seems likely based on the invalidation of the breakdown below the rising long-term support line, but a rally without another move closer to the recent lows is far from being a sure bet.
Gold is not likely to form a broad top here, as it's not the kind of performance that gold exhibited after similarly sharp rallies in the past - in 2006, 2008, 2009/2010, and 2011. Interestingly, all the above-mentioned spike tops formed close to gold's long-term cyclical turning point - which is also where gold is right now.
So, on one hand we could (but don't have to) have a broader bottom in the USD Index (which might indicate a broader top in gold), and on the other hand, we could have a spike-high in gold based on analogy to similar short-term rallies and long-term turning points. What's the most likely outcome here?
In my view, it would be most useful to look at gold's top that formed at the most similar price levels - the 2011 top.
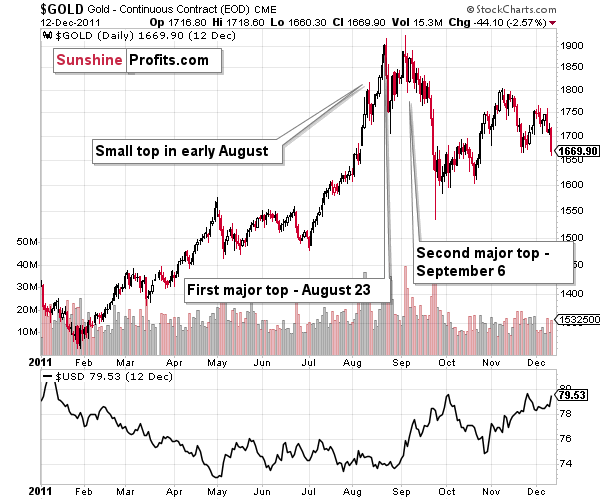
There was an initial top in early August, then an initial top, and then - after several days - the final top. Gold's plunge was significant even after the first top. However, it was not significant after the initial early-August-2011 top.
The USD Index had been trading sideways, forming a broad bottom in 2011 and while the first decline in gold took place practically without USD's help, it was the decisive move higher in the USDX that really changed the picture.
Will the USD Index rally significantly from here? That's most likely in our view. But will this happen without an additional move to the previous lows? This is unclear.
Since markets don't move in isolation, we might get the final "go" signal from a different market. And this could be the stock market.
In my previous analyses, I wrote that all in all, gold is likely to rally far in the long run, but in the short run it's vulnerable to a sizable decline, when the economic implications of the pandemic's continuation become obvious to investors.
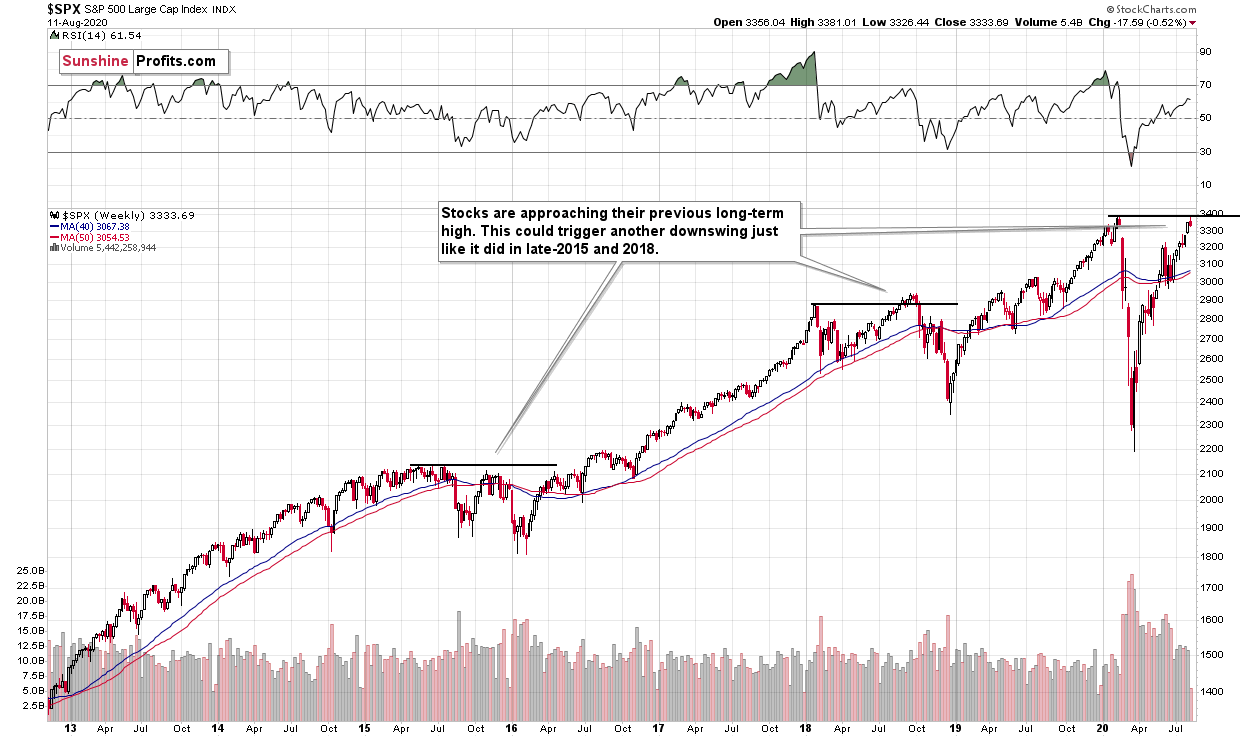
The S&P 500 is approaching its previous 2020 high. Given the economic background, I find this performance unfounded. But the markets can stick to a certain emotional trend for longer than many investors can remain logical, which would fit the above picture.
Back in 2015 stocks topped below their previous highs, and in 2018 they topped a bit above them, so the proximity to the previous is far from being a precise sell signal. It does indicate, that the stock market is likely vulnerable to sell signals coming from other markets and that this emotional rally could end rather sooner than later.
Do you remember what happened in February when the S&P 500 lost its upward momentum? They plunged, and that was when tops in mining stocks and silver formed. Gold made another attempt to move higher but ultimately declined profoundly in the following days.
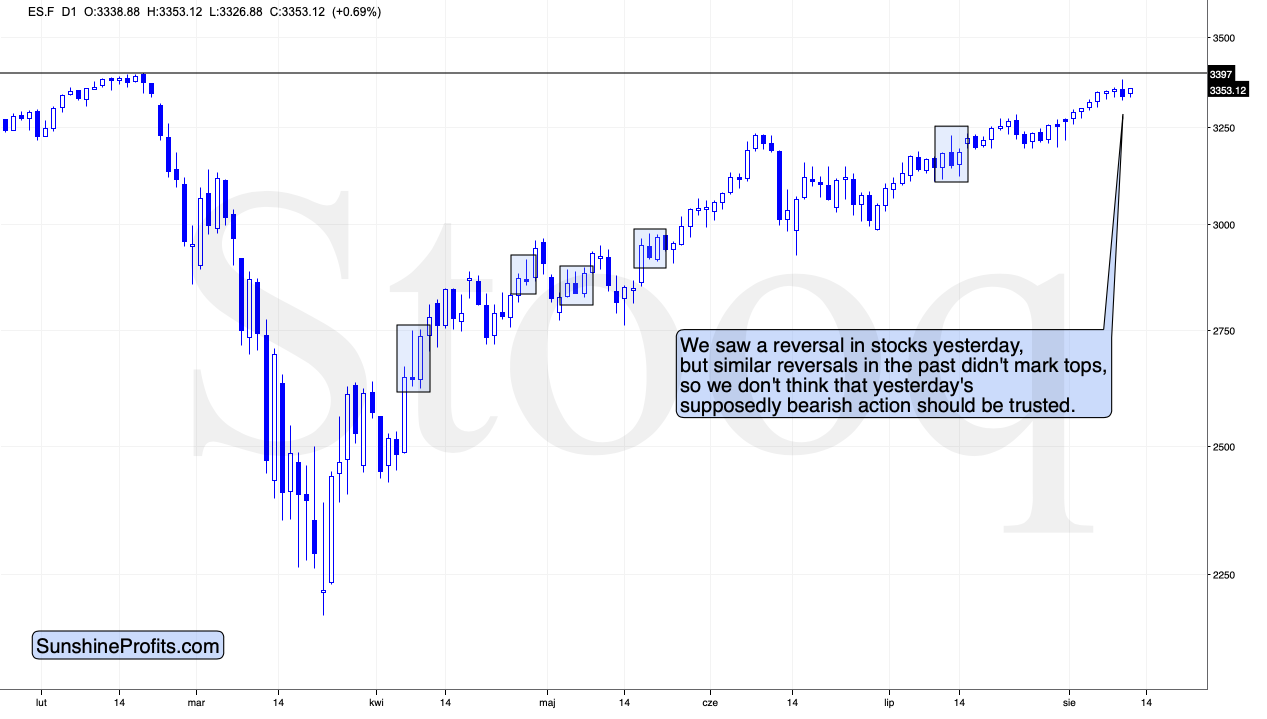
As you can see on the above chart, the S&P 500 futures are already very close to the previous 2020 high. A move to this level, or - even better - a small breakout that is then invalidated, could be the perfect trigger for all above-mentioned moves. This could be what triggers a move higher in the USD Index, as investors turn to cash, which in turn could trigger a decline in gold, just like what we saw in 2011.
So far, we saw a daily reversal slightly below the previous high. This seems bearish at first sight, but we doubt that it is really the case. Why? Because we saw this kind of "bearish reversal" several times in the past months and it was never the day when the S&P 500 topped. Indeed, the S&P 500 Index futures are already higher in today's pre-market trading.
Consequently, it seems likely that stocks could continue to move higher until they reach their previous 2020 high. In fact, we wouldn't be surprised if stocks move a bit above the previous high and then invalidate this move. It would serve as a perfect bearish confirmation of everything we wrote today.
...And if gold was to decline significantly here, then miners would be likely to truly plunge.
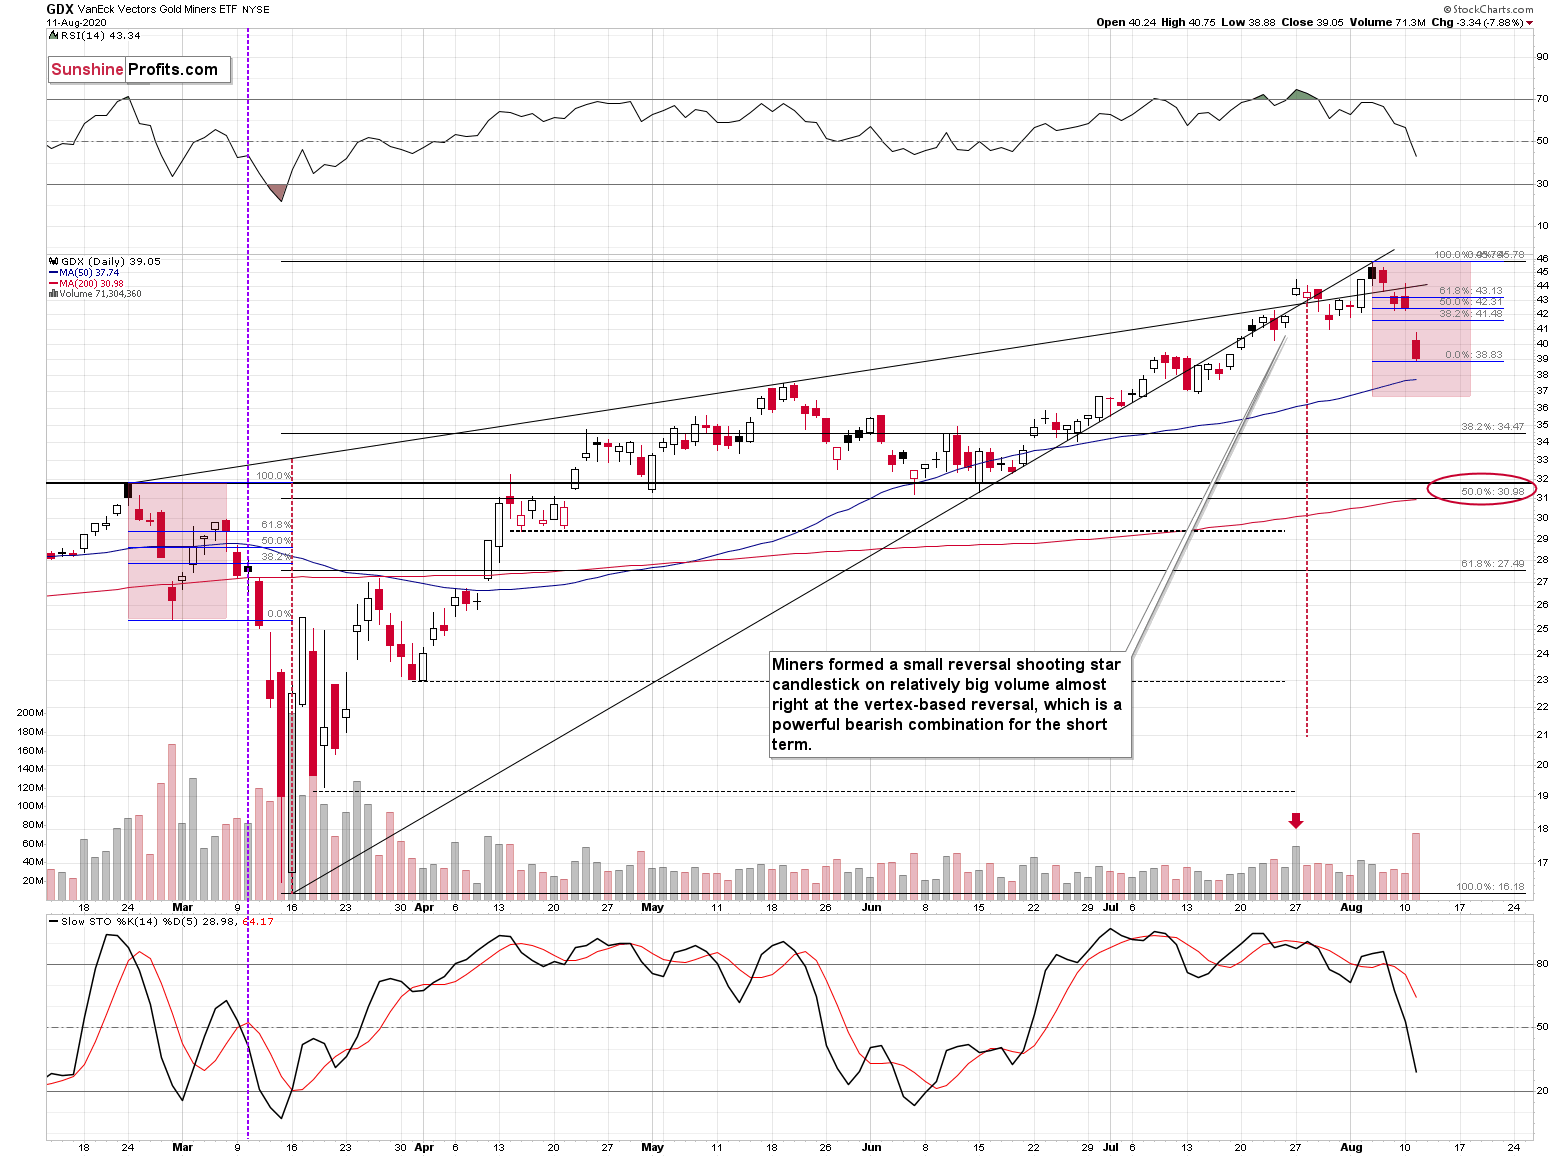
In fact, that's what they have done yesterday. Even though the decline is already sizable, it's not even halfway done in our view. And if gold is about to move higher in the very near term, then miners are likely to correct as well.
If gold is going to move close to its previous high once again before sliding, then it means that it would be repeating its March 2020 performance to a considerable extent. Consequently, looking at miners' performance from that period should also be useful.
Back in March, miners corrected a bit more than 61.8% of their initial decline, and at the same time, they moved back to the latest closing price before the volatile decline. In the current case, the above would translate into a rally back to about $42 - $43.
Let's keep in mind that the above-mentioned corrective upswing is a big "maybe" and it's less certain than the decline's continuation within the next couple of weeks. We are providing this upside target not as something that we aim to use for a long position, but rather to show you what kind of upswing would change absolutely nothing with regard to the likelihood of the decline's continuation.
Overview of the Upcoming Decline
As far as the current overview of the upcoming decline is concerned, I think that after bottoming temporarily at about $1,900, gold, silver and miners will bounce back - perhaps $30-$50 or so in gold - and perhaps back to their previous 2020 highs, and then we will probably see another - bigger - move lower. The latter would likely be triggered by a visible upswing in the USD Index.
During this final part of the slide, we would expect silver to decline more than miners. That would be in tune with how the markets initially reacted to the Covid-19 threat.
The impact of all the new rounds of money printing in the U.S. and Europe on the precious metals prices is very positive in the long run, but it doesn't make the short-term decline unlikely. In the very near term, markets can and do get ahead of themselves and then need to decline - sometimes very profoundly - before continuing their upward march.
We previously wrote that gold might (it was not likely, but we were mentioning this as one of the possibilities) even end its decline at about $1,900, but this is now quite unlikely. The reason is that gold already declined to this level, even though the USD Index's rally didn't really start just yet. So, when the USDX does indeed soar, gold would be likely to decline more.
Summary
Summing up, it seems that after reversing $4 above our upside target, gold has finally topped. The opposite appears likely in store for the USD Index, which seems to have formed a double-bottom pattern. While we can't rule out a situation in which the PMs and miners move higher one final time before plunging, it seems that regardless of this move, the outlook for the next few weeks for the mining stocks is very bearish.
Naturally, everyone's trading is their responsibility, but in our opinion, if there ever was a time to either enter a short position in the miners or to increase its size if it wasn't already sizable, it's now. We made money on the March decline and on the March rebound, and it seems that another massive slide is about to start. When everyone is on one side of the boat, it's a good idea to be on the other side, and the Gold Miners Bullish Percent Index literally indicates that this is the case with mining stocks.
After the sell-off (that takes gold to about $1,700), we expect the precious metals to rally significantly. The final decline might take as little as 1-6 weeks, so it's important to stay alert to any changes.
Most importantly - stay healthy and safe. We made a lot of money on the March decline and the subsequent rebound (its initial part) price moves (and we'll likely make much more in the following weeks and months), but you have to be healthy to really enjoy the results.
As always, we'll keep you - our subscribers - informed.
To summarize:
Trading capital (supplementary part of the portfolio; our opinion): Full speculative short positions (300% of the full position) in mining stocks is justified from the risk to reward point of view with the following binding exit profit-take price levels:
Senior mining stocks (price levels for the GDX ETF): binding profit-take exit price: $32.02; stop-loss: none (the volatility is too big to justify a SL order in case of this particular trade); binding profit-take level for the DUST ETF: $28.73; stop-loss for the DUST ETF: none (the volatility is too big to justify a SL order in case of this particular trade)
Junior mining stocks (price levels for the GDXJ ETF): binding profit-take exit price: $42.72; stop-loss: none (the volatility is too big to justify a SL order in case of this particular trade); binding profit-take level for the JDST ETF: $21.22; stop-loss for the JDST ETF: none (the volatility is too big to justify a SL order in case of this particular trade)
For-your-information targets (our opinion; we continue to think that mining stocks are the preferred way of taking advantage of the upcoming price move, but if for whatever reason one wants / has to use silver or gold for this trade, we are providing the details anyway. In our view, silver has greater potential than gold does):
Silver futures downside profit-take exit price: unclear at this time - initially, it might be a good idea to exit, when gold moves to $1,703.
Gold futures downside profit-take exit price: $1,703
Long-term capital (core part of the portfolio; our opinion): No positions (in other words: cash
Insurance capital (core part of the portfolio; our opinion): Full position
Whether you already subscribed or not, we encourage you to find out how to make the most of our alerts and read our replies to the most common alert-and-gold-trading-related-questions.
Please note that the in the trading section we describe the situation for the day that the alert is posted. In other words, it we are writing about a speculative position, it means that it is up-to-date on the day it was posted. We are also featuring the initial target prices, so that you can decide whether keeping a position on a given day is something that is in tune with your approach (some moves are too small for medium-term traders and some might appear too big for day-traders).
Plus, you might want to read why our stop-loss orders are usually relatively far from the current price.
Please note that a full position doesn't mean using all of the capital for a given trade. You will find details on our thoughts on gold portfolio structuring in the Key Insights section on our website.
As a reminder - "initial target price" means exactly that - an "initial" one, it's not a price level at which we suggest closing positions. If this becomes the case (like it did in the previous trade) we will refer to these levels as levels of exit orders (exactly as we've done previously). Stop-loss levels, however, are naturally not "initial", but something that, in our opinion, might be entered as an order.
Since it is impossible to synchronize target prices and stop-loss levels for all the ETFs and ETNs with the main markets that we provide these levels for (gold, silver and mining stocks - the GDX ETF), the stop-loss levels and target prices for other ETNs and ETF (among other: UGLD, DGLD, USLV, DSLV, NUGT, DUST, JNUG, JDST) are provided as supplementary, and not as "final". This means that if a stop-loss or a target level is reached for any of the "additional instruments" (DGLD for instance), but not for the "main instrument" (gold in this case), we will view positions in both gold and DGLD as still open and the stop-loss for DGLD would have to be moved lower. On the other hand, if gold moves to a stop-loss level but DGLD doesn't, then we will view both positions (in gold and DGLD) as closed. In other words, since it's not possible to be 100% certain that each related instrument moves to a given level when the underlying instrument does, we can't provide levels that would be binding. The levels that we do provide are our best estimate of the levels that will correspond to the levels in the underlying assets, but it will be the underlying assets that one will need to focus on regarding the signs pointing to closing a given position or keeping it open. We might adjust the levels in the "additional instruments" without adjusting the levels in the "main instruments", which will simply mean that we have improved our estimation of these levels, not that we changed our outlook on the markets. We are already working on a tool that would update these levels on a daily basis for the most popular ETFs, ETNs and individual mining stocks.
Our preferred ways to invest in and to trade gold along with the reasoning can be found in the how to buy gold section. Additionally, our preferred ETFs and ETNs can be found in our Gold & Silver ETF Ranking.
As a reminder, Gold & Silver Trading Alerts are posted before or on each trading day (we usually post them before the opening bell, but we don't promise doing that each day). If there's anything urgent, we will send you an additional small alert before posting the main one.
Thank you.
Sincerely,
Przemyslaw Radomski, CFA
Editor-in-chief, Gold & Silver Fund Manager

