

Briefly: in our opinion, full (200% of the regular size of the position) speculative short positions in gold, silver and mining stocks are justified from the risk/reward perspective at the moment of publishing this alert.
At first sight nothing really happened yesterday, but after closer examination we see that silver moved to the lowest daily close of 2017 and then moved back up, erasing practically the entire daily downswing. What can the silver reversal tell us?
Surprisingly little. Let’s take a closer look (charts courtesy of http://stockcharts.com).
Silver: Reversal or Breakdown?
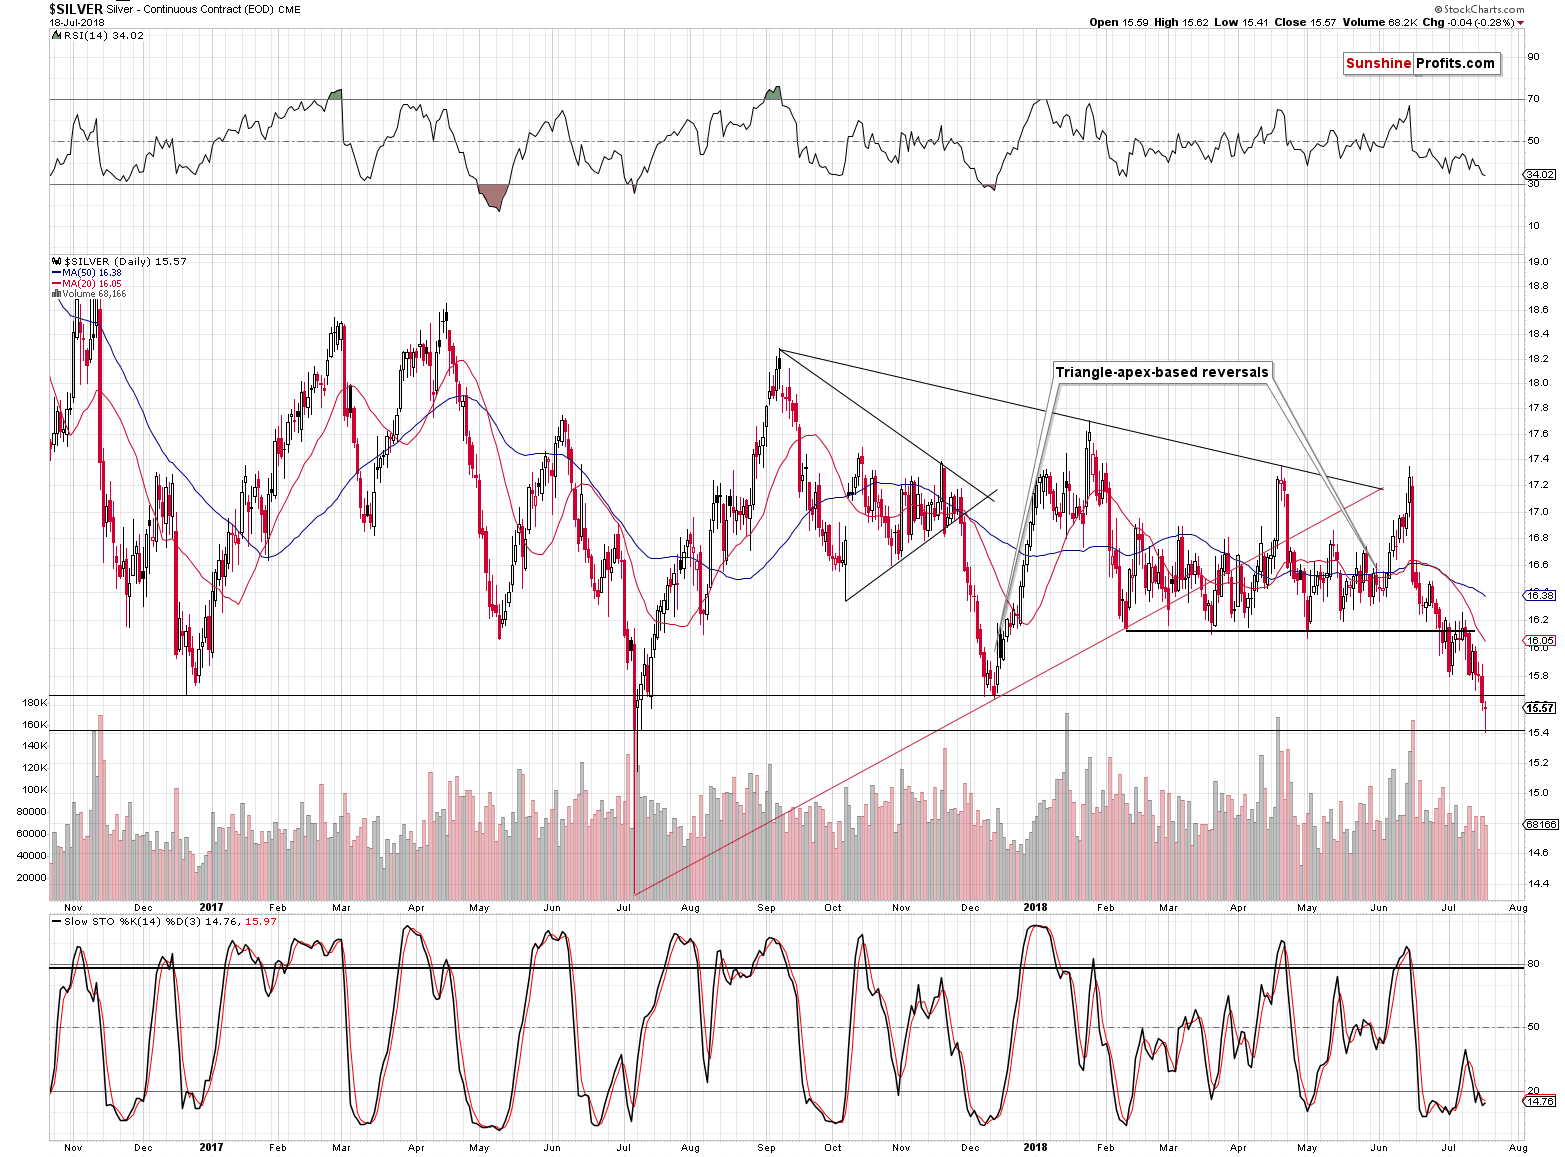
Silver’s final bottoms are usually formed on either very big or very small volume. The former represents the fierce battle in which bulls win, and the latter represents a situation when people’s interest in selling silver is so minimal that it takes very little to make the price rally. Yesterday’s volume was average – the key confirmation that a reversal should have was missing. It was not extreme enough, which is one of the signs that suggests that we saw a major bottom yesterday. Perhaps we saw a very temporary one, but not likely a major one.
The second thing that one should take into account is that silver is right after a breakdown below the medium-term lows: the one that formed in December 2017, and the one that formed in December 2016. Verifications are natural right after breakdowns and thus yesterday’s late-session move back to these lows is not surprising – it’s normal.
Naturally, if we see a continuation of strength and the mentioned breakdown is invalidated, the outlook may change, but it simply isn’t the case right now.
Gold’s Tiny Pause
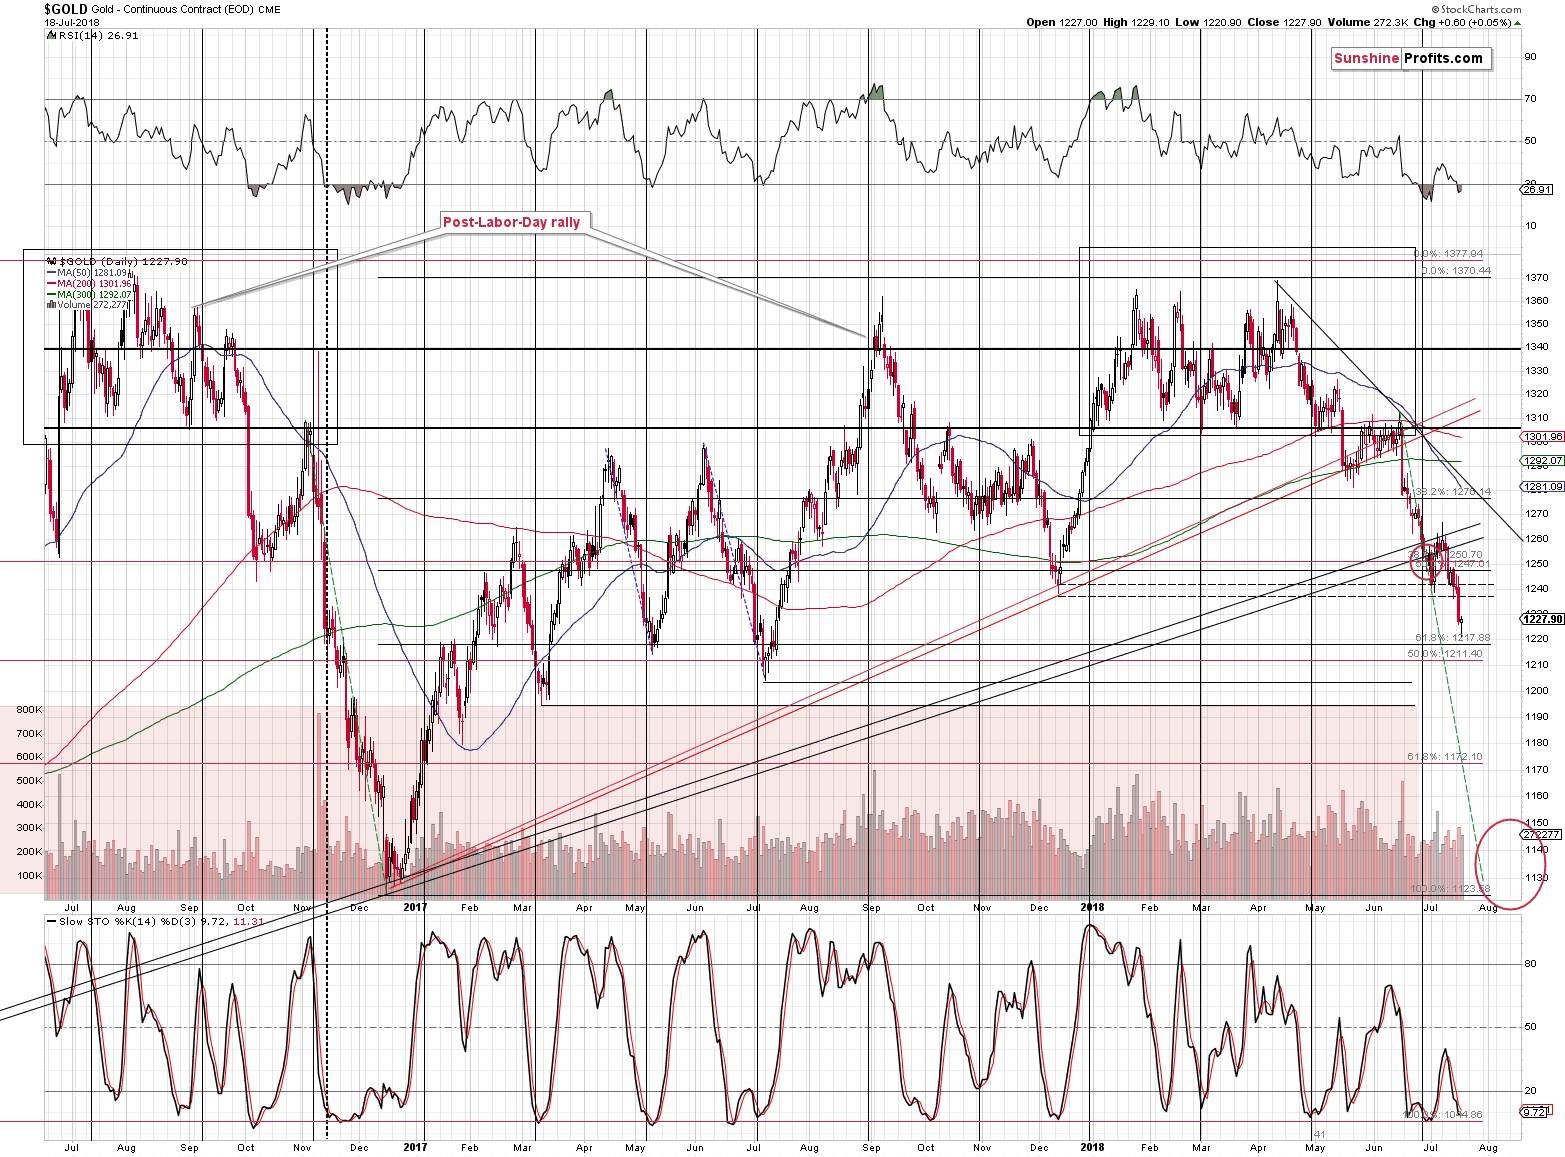
Gold reversed in a less visible way and it didn’t touch any significant support level on an intraday basis. The volume was not huge, which overall fits the implications of the silver chart.
In other words, our previous comments on gold, remain up-to-date:
Gold showed substantial weakness when the USD index moved lower in the previous days, and we explained that this meant that gold was likely to decline more visibly during the USD’s rally. And it did. The U.S. currency moved higher yesterday, while the yellow precious metal moved to new yearly lows and below the December 2017 bottom. This breakdown took place on high volume, which further confirmed the bearish outlook.
The are several nearby support levels and the most visible one is the one based on the July 2017 low – just a few dollars above $1,200. Will we see a rebound once gold moves to this level? It’s not that clear. If we didn’t expect gold to slide very far in the next few months, we would probably focus on a rebound. But in light of multiple bearish signs of medium-term nature and the powerful breakdown in the yen, it may not be the best course of action.
It was already very difficult to profit on the previous corrective upswing (but we did thanks to sizable profits from mining stocks) and this case could be even trickier. If we get a lot of bullish signs, we might adjust the position, but we are not doing so right now. If we see a rebound and we don’t take advantage of it, please keep in mind that it will be a deliberate decision based on the risk to reward ratio. It will not be something that we “fail to do”, but something that we know that may happen, but that will most likely not be worth acting on.
Mining Stocks’ Correction Update
In yesterday’s Alert, we commented on the situation in the mining stocks to gold ratio in the following way:
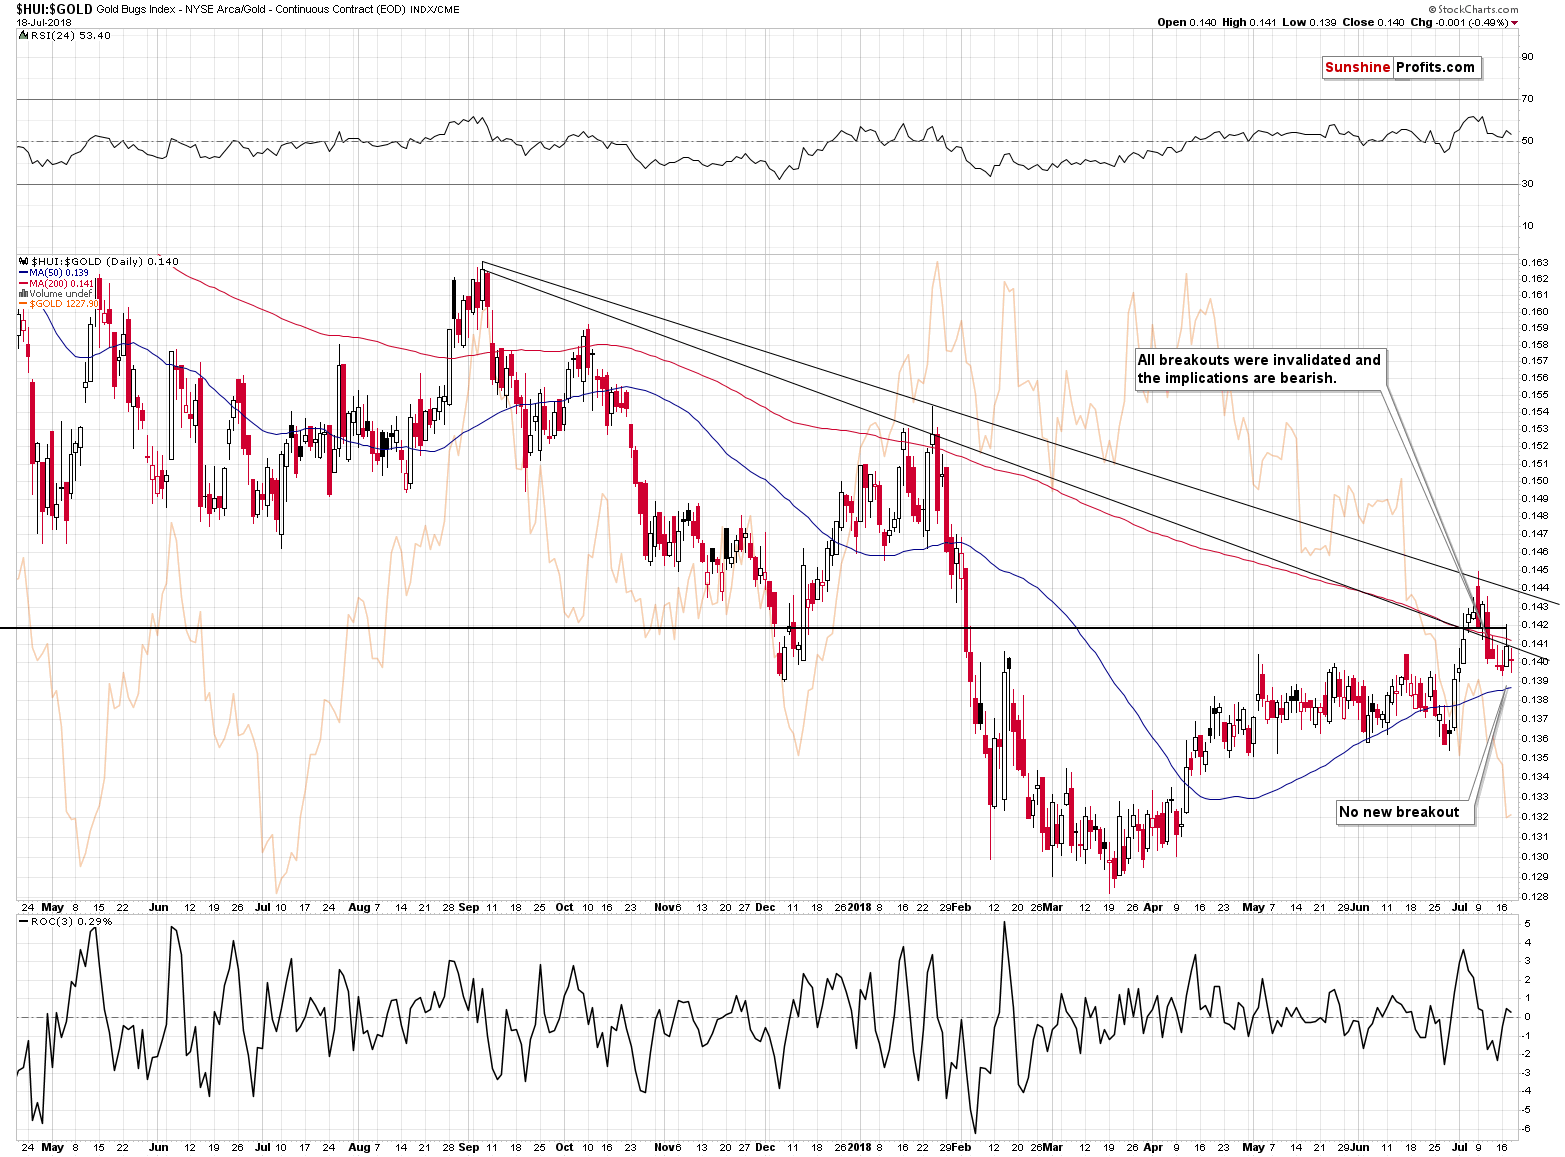
(…) strength in gold stocks relative to gold didn’t cause any technical changes on the above chart. Naturally, the ratio moved higher, but we saw no new breakout. There was an attempt to move above the late-2016 low (thick horizontal line) and the declining resistance line based on the previous highs in terms of closing prices, but none of them succeeded.
If we see more strength in the miners and the ratio rallies further and breaks above the mentioned levels, then the implications of the above chart may become bullish. But they are not bullish now.
Therefore, it was simply a corrective upswing – or a pause – that didn’t change the technical outlook. This means that the ratio is still likely to move lower.
Consequently, even though yesterday’s intraday reversal in miners seemed bullish, it actually isn’t.
The above remains up-to-date. Yesterday’s move lower in the ratio almost erased Tuesday’s upswing. Consequently, whatever bullish implications Tuesday’s strength might have had, they are already gone.
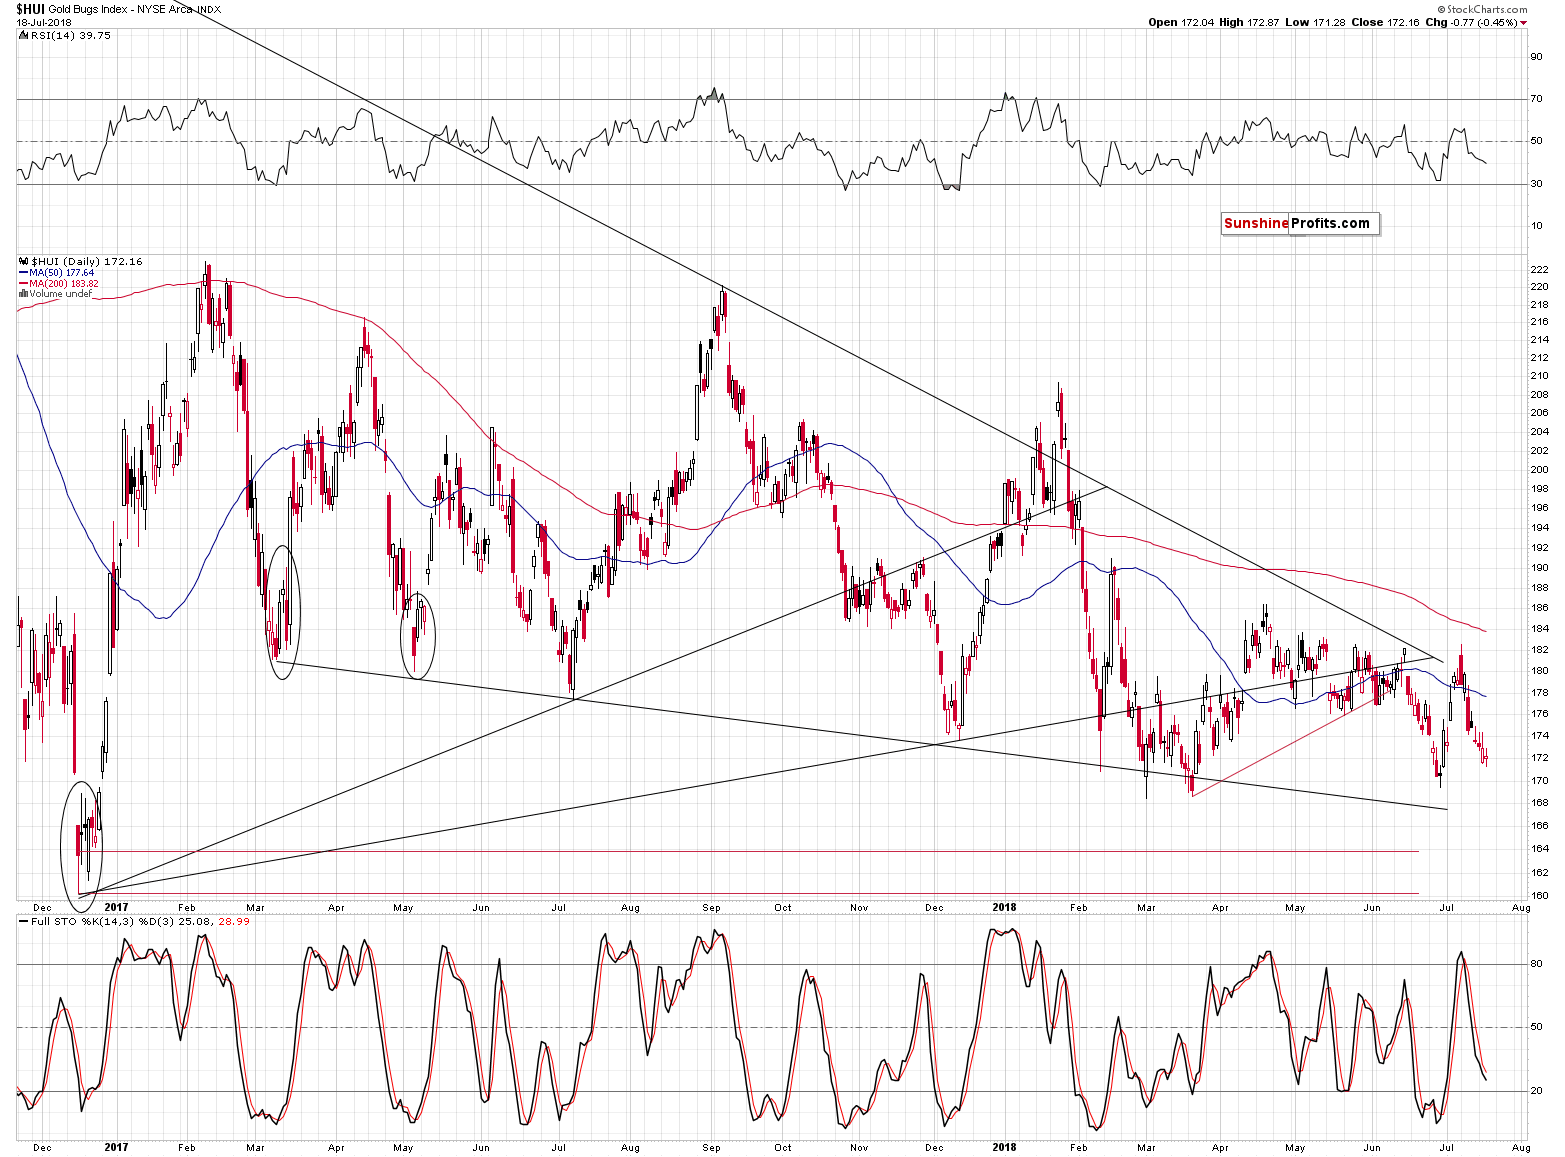
On the HUI Index chart, it’s visible as a small move lower and daily close near to Tuesday’s intraday low. In other words, it looks like the gold miners’ decline was delayed by one day – nothing more.
At this point you might be wondering if gold and silver’s reversals were a sign of strength relative to the action in the forex market.
USD’s Tricky Reversal
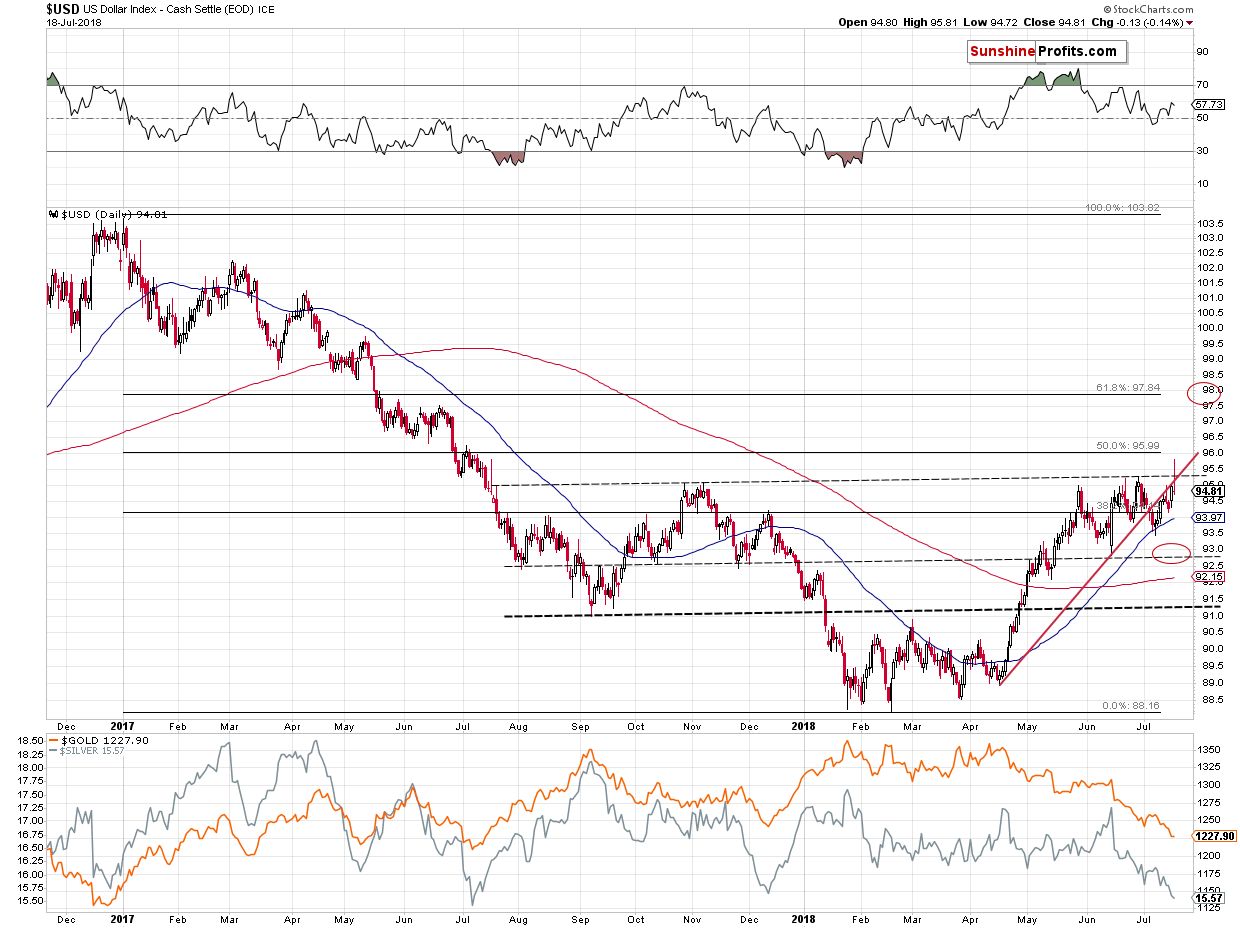
The USD Index rallied yesterday, but before the day was over, “it moved back below the previous highs” and the rising red support / resistance line. At least that’s what we have based on Stockcharts’ data. But, yesterday’s data from Stockcharts seems to be off as it's not in tune with what the individual currency exchange rates did.
Yesterday’s intraday high was much lower if we take into account data from finance.yahoo.com (95.41) and the previous highs from the same source took place on June 28thand June 21stat 95.53 (both). This means that there was no breakout yesterday, and thus no invalidation of it later on. This makes a big difference, because invalidations of breakouts are often strong bearish signs. All in all, it seems that we haven’t seen one yesterday and thus the outlook for the USDX didn’t change much.
Consequently, what we should focus on is whether gold’s and silver’s reaction was justified given what happened in the USD Index. It was. The USD reversed without a major technical sign and we can say the same about gold and silver. There was no new bearish sign from the gold-USDX link, but the outlook was already very bearish, so a daily neutral reading simply means that the previously bearish outlook remains unchanged.
Having said that, let’s move to the part of the USD Index that’s particularly closely connected to gold’s performance – the Japanese yen.
Yen’s Pause
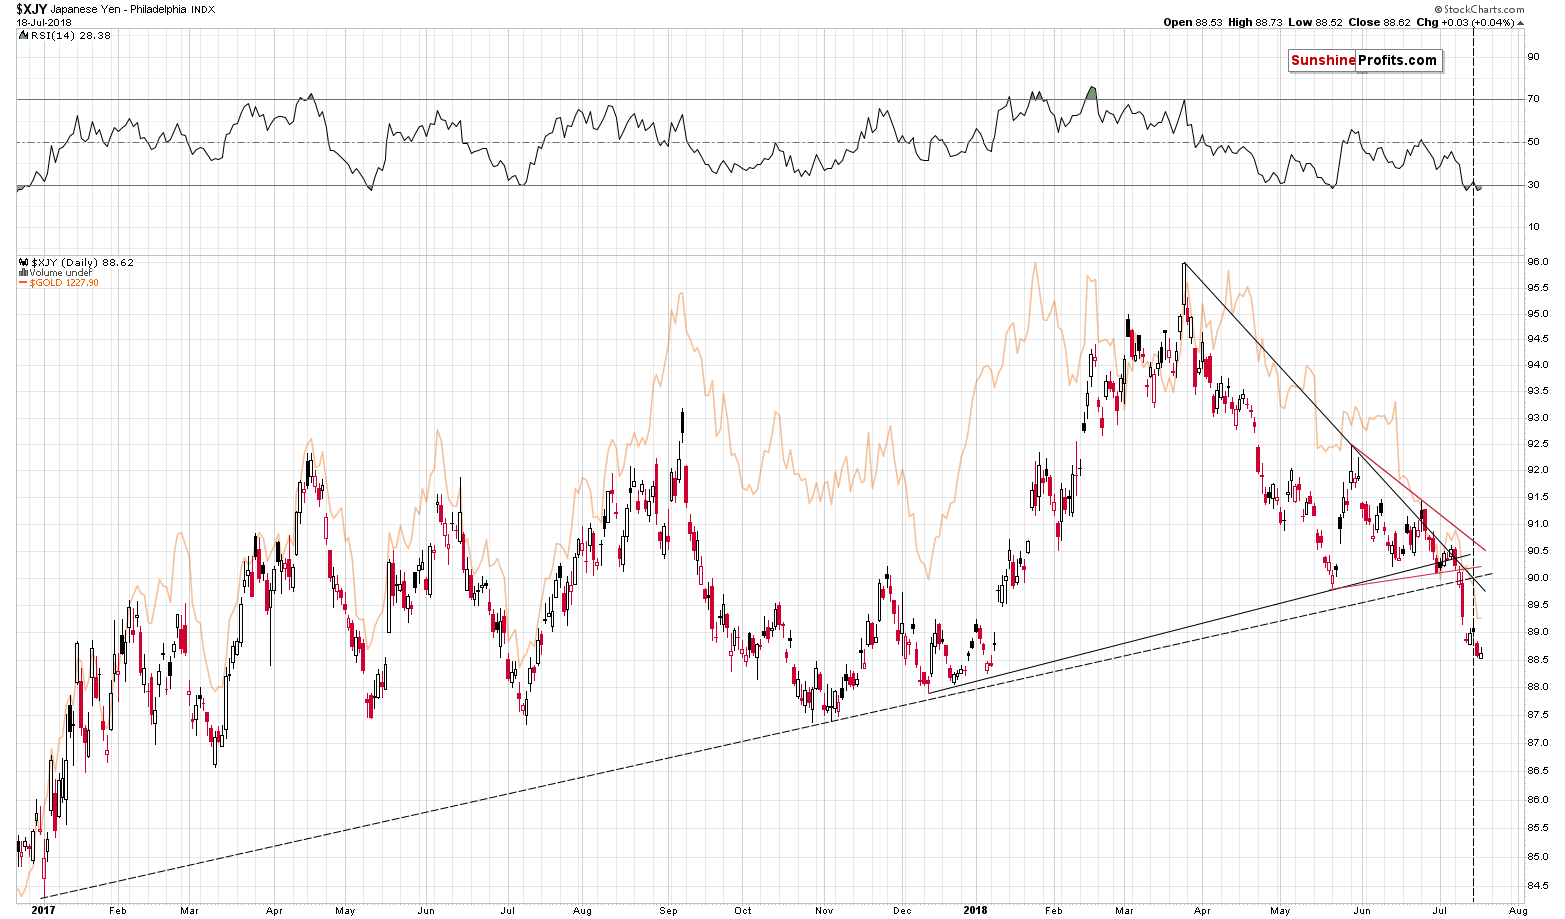
The Japanese currency simply paused, and it did so after multiple breakdowns, the most important of them being the long-term one.
That’s quite normal after a breakdown of this importance and it doesn’t make the outlook any less bearish. In fact, just because we are not seeing a sharp comeback after the breakdown makes the situation more bearish every day, because it means that the breakdown in the yen is more and more confirmed.
In other words, our previous comments on the Japanese yen remain up-to-date:
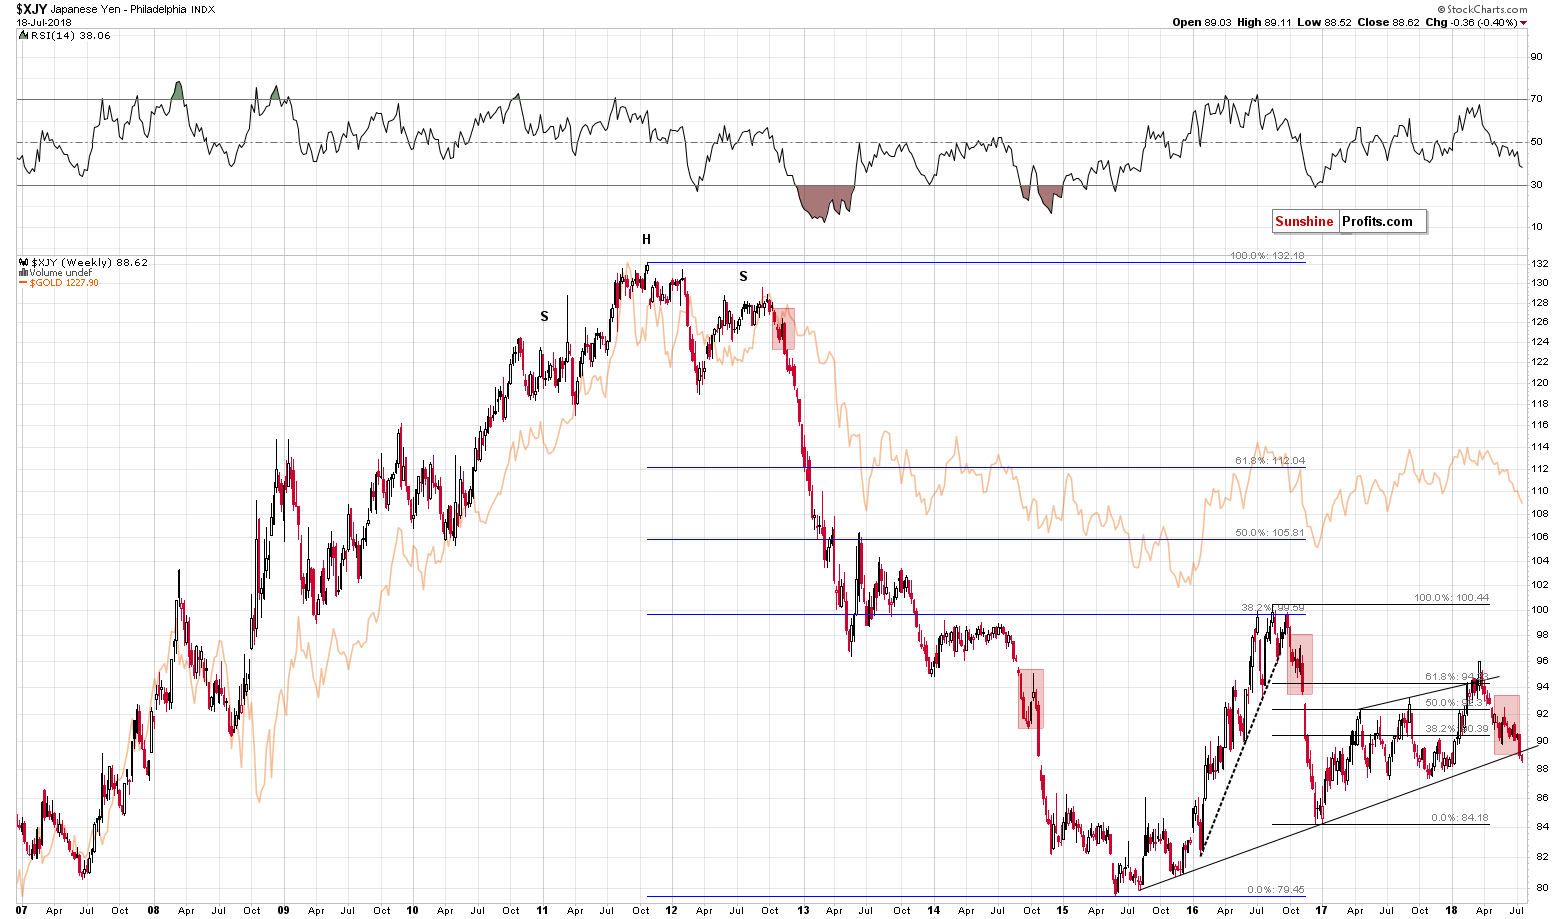
And we saw it. The Japanese yen just broke below the key long-term support line. Also, when viewing the currency while using the linear scale instead of a logarithmic one, this breakdown took place even sooner.
This is the most profound development on the long-term yen chart since the late-2016 breakdown. The results are clearly visible – a huge decline in the currency. And in gold.
There are multiple factors pointing to lower gold prices right now and this breakdown is one of the most important ones.
(…)
Due to the strong link between gold and yen, the above means that the odds of seeing a huge decline in the following weeks (not necessarily days, though, but we’ll move to that in the next paragraph) in both: the yen and the precious metals sector increased substantially.
Let’s keep in mind that there’s a triangle-apex-based reversal today (vertical dashed line), which may mean that we can see some kind of reversal today and a very short-term rally. This would likely serve as a quick verification of the breakdown below the long-term support line. The verification of a breakdown is not a bullish phenomenon, but a bearish one and it doesn’t seem that one should adjust their positions based on just the above. The same goes for the very short-term outlook in the case of gold and the rest of the precious metals sector.
In other words, a short-term corrective upswing may take place and if it does, there’s no need to be stressed about it – it will be the normal course of action. Action that we think is best to be left ignored – i.e. we don’t think that adjusting the positions is a good idea. Why? Because of what happened after similar situations in the past.
Please take one more look at the long-term Japanese yen chart. There were three similar cases to the very recent one and we marked them with red rectangles. All corrective upswings after these similar patterns were so tiny that they are practically invisible on the above chart. In all these cases it was much better to just hold on to a position than to try to time every correction. That’s what we plan to do in the near term with regard to our positions in the metals – unless something major happens we’ll likely stick to the short positions.
All in all, the implications for the precious metals market are very bearish.
Summary
Summing up, the outlook for the precious metals is extremely bearish for the following weeks and months, and – based on the situation in the USD Index and the Japanese yen - days. Naturally, we could still see a small move higher or a pause, but the odds for it are limited and it doesn’t seem that adjusting positions based on this possibility is a good idea.
The extra-large short positions in gold, silver, and mining stocks are definitely justified from the risk to reward point of view. It’s likely that the profits on the short position that we had opened only several days ago will increase much more before this trade is over.
As always, we’ll keep you – our subscribers – informed.
To summarize:
Trading capital (supplementary part of the portfolio; our opinion): Full short positions (200% of the full position) in gold, silver and mining stocks are justified from the risk/reward perspective with the following stop-loss orders and initial target price levels:
- Gold: initial target price: $1,142; stop-loss: $1,272; initial target price for the DGLD ETN: $63.96; stop-loss for the DGLD ETN $46.38
- Silver: initial target price: $14.42; stop-loss: $16.46; initial target price for the DSLV ETN: $32.97; stop-loss for the DSLV ETN $24.07
- Mining stocks (price levels for the GDX ETF): initial target price: $19.12; stop-loss: $23.64; initial target price for the DUST ETF: $37.97; stop-loss for the DUST ETF $20.87
In case one wants to bet on junior mining stocks' prices (we do not suggest doing so – we think senior mining stocks are more predictable in the case of short-term trades – but if one wants to do it anyway, we provide the details), here are the stop-loss details and initial target prices:
- GDXJ ETF: initial target price: $28.10; stop-loss: $34.82
- JDST ETF: initial target price: $74.83 stop-loss: $42.78
Long-term capital (core part of the portfolio; our opinion): No positions (in other words: cash)
Insurance capital (core part of the portfolio; our opinion): Full position
Important Details for New Subscribers
Whether you already subscribed or not, we encourage you to find out how to make the most of our alerts and read our replies to the most common alert-and-gold-trading-related-questions.
Please note that the in the trading section we describe the situation for the day that the alert is posted. In other words, it we are writing about a speculative position, it means that it is up-to-date on the day it was posted. We are also featuring the initial target prices, so that you can decide whether keeping a position on a given day is something that is in tune with your approach (some moves are too small for medium-term traders and some might appear too big for day-traders).
Plus, you might want to read why our stop-loss orders are usually relatively far from the current price.
Please note that a full position doesn’t mean using all of the capital for a given trade. You will find details on our thoughts on gold portfolio structuring in the Key Insights section on our website.
As a reminder – “initial target price” means exactly that – an “initial” one, it’s not a price level at which we suggest closing positions. If this becomes the case (like it did in the previous trade) we will refer to these levels as levels of exit orders (exactly as we’ve done previously). Stop-loss levels, however, are naturally not “initial”, but something that, in our opinion, might be entered as an order.
Since it is impossible to synchronize target prices and stop-loss levels for all the ETFs and ETNs with the main markets that we provide these levels for (gold, silver and mining stocks – the GDX ETF), the stop-loss levels and target prices for other ETNs and ETF (among other: UGLD, DGLD, USLV, DSLV, NUGT, DUST, JNUG, JDST) are provided as supplementary, and not as “final”. This means that if a stop-loss or a target level is reached for any of the “additional instruments” (DGLD for instance), but not for the “main instrument” (gold in this case), we will view positions in both gold and DGLD as still open and the stop-loss for DGLD would have to be moved lower. On the other hand, if gold moves to a stop-loss level but DGLD doesn’t, then we will view both positions (in gold and DGLD) as closed. In other words, since it’s not possible to be 100% certain that each related instrument moves to a given level when the underlying instrument does, we can’t provide levels that would be binding. The levels that we do provide are our best estimate of the levels that will correspond to the levels in the underlying assets, but it will be the underlying assets that one will need to focus on regarding the signs pointing to closing a given position or keeping it open. We might adjust the levels in the “additional instruments” without adjusting the levels in the “main instruments”, which will simply mean that we have improved our estimation of these levels, not that we changed our outlook on the markets. We are already working on a tool that would update these levels on a daily basis for the most popular ETFs, ETNs and individual mining stocks.
Our preferred ways to invest in and to trade gold along with the reasoning can be found in the how to buy gold section. Additionally, our preferred ETFs and ETNs can be found in our Gold & Silver ETF Ranking.
As a reminder, Gold & Silver Trading Alerts are posted before or on each trading day (we usually post them before the opening bell, but we don't promise doing that each day). If there's anything urgent, we will send you an additional small alert before posting the main one.
=====
Latest Free Trading Alerts:
Stocks were basically unchanged on Wednesday, as investors took short-term profits off the table following the recent rally. Is this a topping pattern before downward reversal, or just a quick flat correction before another leg up? Will quarterly earnings releases drive the market higher?
S&P 500 Just 2% Below Record High, but There's More Uncertainty
=====
Hand-picked precious-metals-related links:
PRECIOUS-Gold slips to 1-year low as U.S. dollar firms
=====
In other news:
Dollar Extends Advance on Upbeat Fed; Stocks Drop: Markets Wrap
Commodity Contagion Spreads as Raw Material Crash Threatens Calm
Rising interest rates, trade wars erode credit outlook: survey
Global Markets: Dollar gains, metals wane as China grabs for monetary easing
Donald Trump may kill the global recovery
Larry Kudlow: No recession in sight, maybe not until 2024
The cashless society is a con – and big finance is behind it
Oil prices fall on record U.S. output, stock build
Malta wants to become 'Blockchain Island'
=====
Thank you.
Sincerely,
Przemyslaw Radomski, CFA
Founder, Editor-in-chief, Gold & Silver Fund Manager
Gold & Silver Trading Alerts
Forex Trading Alerts
Oil Investment Updates
Oil Trading Alerts

