

Briefly: in our opinion, full (300% of the regular position size) speculative short positions in mining stocks are justified from the risk/reward point of view at the moment of publishing this Alert.
What we previously wrote about mining stocks' breakdown and yesterday's upswing, might seem like something that invalidates it or something that's just nonsense. In reality, it's one of the common patterns that we see after breakdowns - the price comes back to the previously broken level or line in order to check whether it's able to get back above it. If it's not, the breakdown holds, and it becomes verified. This increases the odds for decline's continuation. Conversely, if the move higher takes the price above the certain level or line, the breakdown becomes invalidated and the signal for the opposite side (here: bullish) is created.
What if both: verification and invalidation take place at the same time? This can't happen with regard to the same line, but if a given line or level is considered based on different perspectives or different prices (intraday, daily closes, weekly closes, monthly closes, quarterly closes), the "same" line might actually be slightly different. Which indication should one trust more in this case?
Of course, there are no certainties in any market, but in general, the more long-term-oriented a picture is, the more important the signals coming from it. Consequently, ceteris paribus (all other things being equal), the more long-term-oriented indications are likely more important.
With the above in mind, let's take a look at what happened in the gold and silver stocks yesterday.
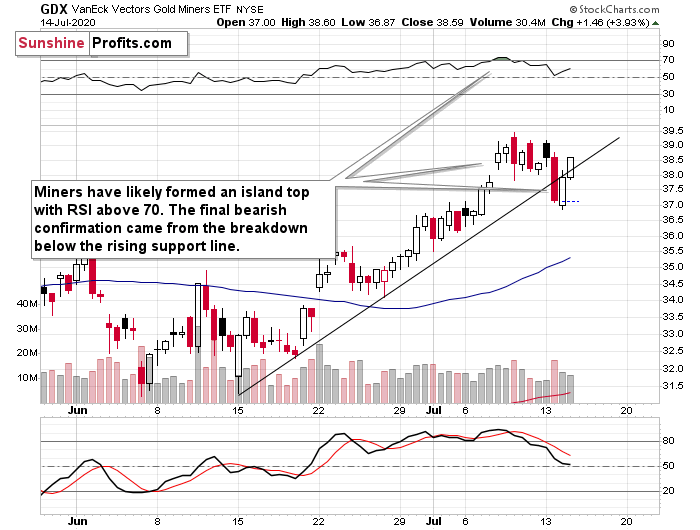
The GDX ETF invalidated its breakdown below the rising intraday support line, which could be viewed as a bullish sign, but...
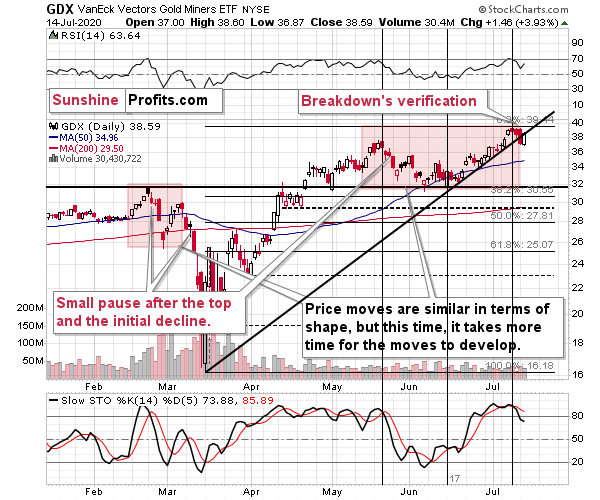
GDX's daily chart (which is twice as long-term as daily candlesticks include two 4-hour candlesticks from the previous chart) shows that the line that's based on more long-term price extremes actually held. This means that the breakdown wasn't invalidated - it's being verified.
The above chart also shows that a pause and a small comeback is relatively normal after the major tops and initial declines. Please note what happened after the February top, after the March top, and after the May top. The same thing - a daily pause. This perfectly fits yesterday's comeback to the previously broken rising support line, which now turned into resistance.
There's another good short-term reason to expect miners to turn south shortly. That's the way gold reacted to USD's weakness that we saw this week, and the specific situation in the latter.
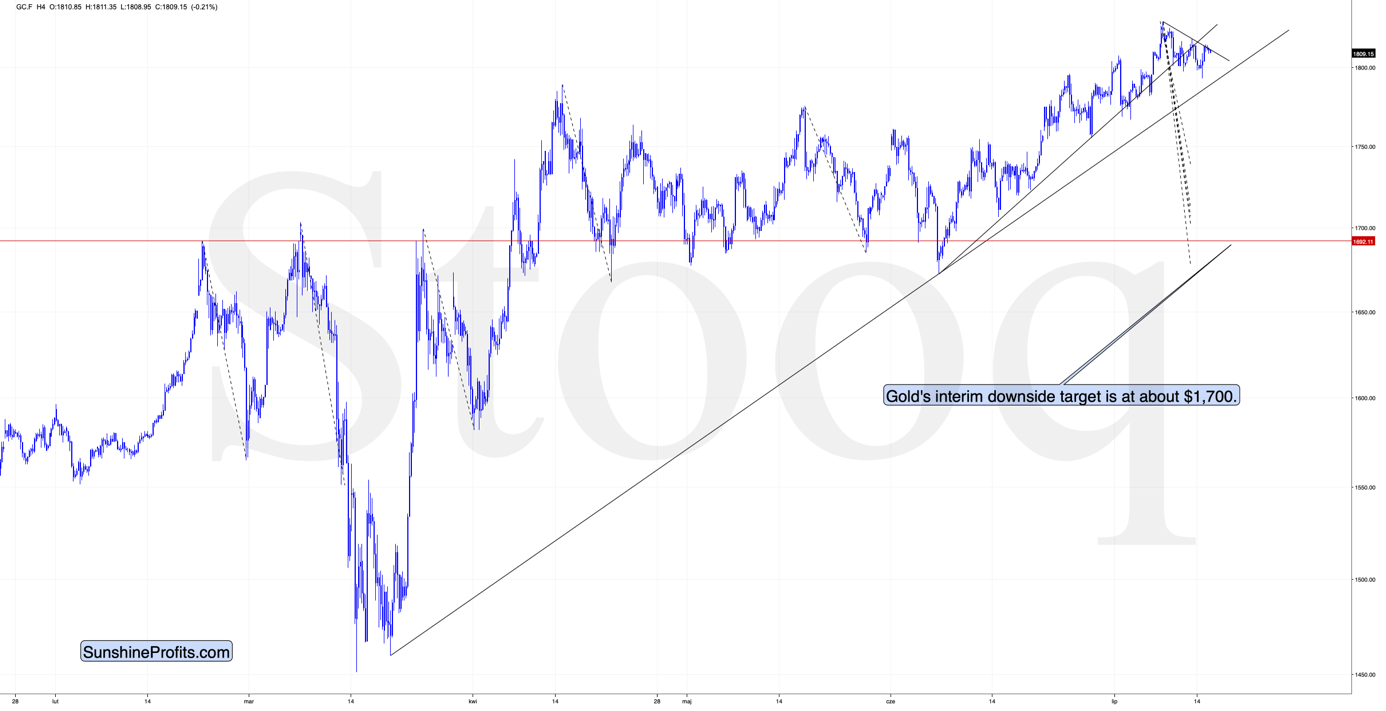
In short, gold didn't move to new highs even though the USD Index moved to new lows.
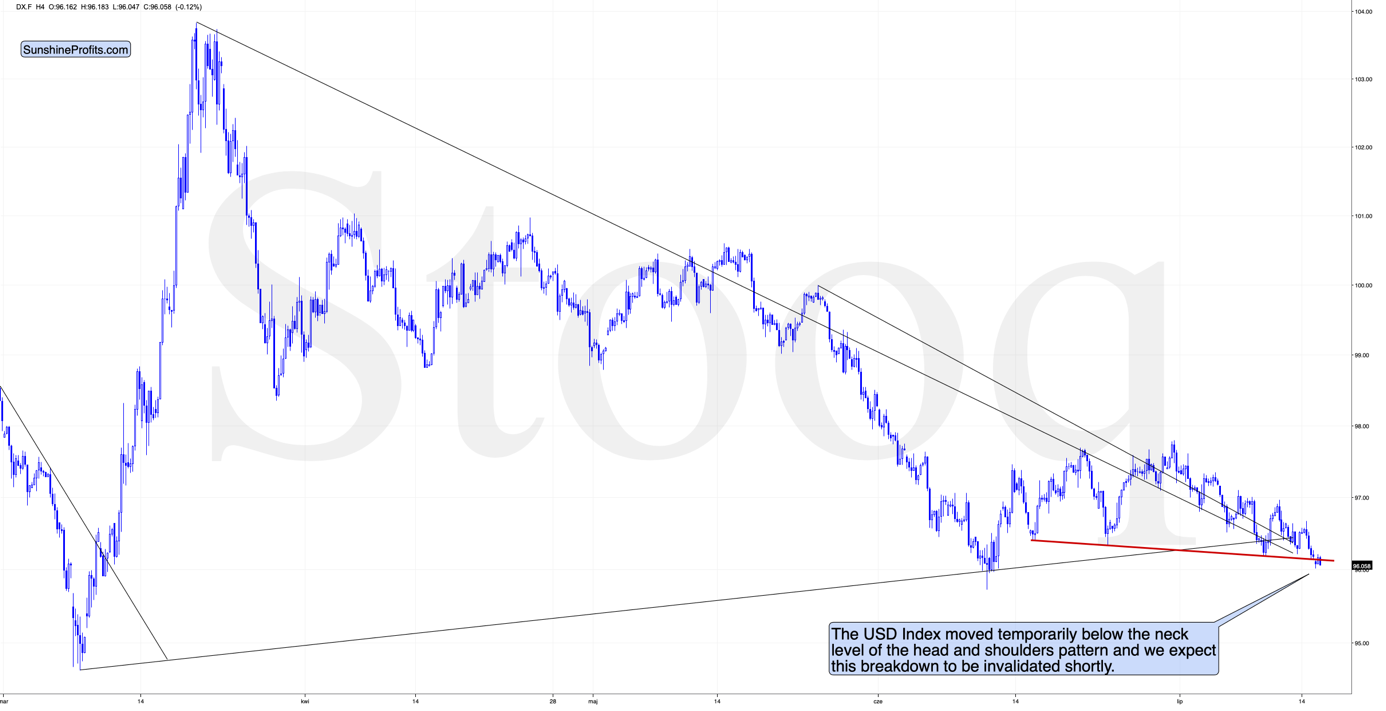
The USDX just moved slightly below the red support line, which could be viewed as the neck level of the monthly head-and-shoulder top pattern. This is a very bearish development at first sight, but much less so when we look at other details.
On Monday, we wrote the following:
The USD Index did move lower and right now it's in the situation where it could still move slightly lower before soaring. The reason is the incomplete head-and-shoulders formation. Theoretically, this formation is bearish once its completed, but based on what we wrote with regard to USD's long-term picture, it seems more likely that the USD Index will attempt to break lower and then invalidate this breakdown. We saw this kind of performance multiple times and invalidated H&S pattern is a very bullish phenomenon. In fact, all invalidations are strong signs to the opposite direction, but the signals coming from invalidated H&S patterns appear particularly strong.
So, while we might see lower USD values in the following hours, it seems that the direction will reverse shortly. The opposite is likely the case for the precious metals market.
The above could put bullish pressure on the precious metals sector in the next several hours or so, without changing the bearish potential for the next 1-6 weeks.
So far, that's exactly what took place. We just saw a small breakdown below the neck level and in response, gold didn't do barely anything - it certainly didn't move above its previous highs.
The invalidation of the breakdown will be a strong bullish sign and we wouldn't be surprised if the following upswing was relatively sharp. Sharp moves tend to take place after the volatility has practically dried up (that's how narrowing of the Bollinger Bands works), and if you look at USD's performance in the last couple of months, it's clear that it has been the case.
Summary
Summing up, given the specific situation in the USD Index and it's tendency to reverse mid-year, gold's relative weakness, and miners' short-term breakdown as well as many other long-term factors, it seems that the precious metals market is on a verge of a big move lower.
Naturally, everyone's trading is their responsibility, but in our opinion, if there ever was a time to either enter a short position in the miners or to increase its size if it wasn't already sizable, it's now. We made money on the March decline and on the March rebound, and it seems that another massive slide is about to start. When everyone is on one side of the boat, it's a good idea to be on the other side, and the Gold Miners Bullish Percent Index literally indicates that this is the case with mining stocks.
After the sell-off (that takes gold below $1,400), we expect the precious metals to rally significantly. The final decline might take as little as 1-6 weeks, so it's important to stay alert to any changes.
Most importantly - stay healthy and safe. We made a lot of money on the March decline and the subsequent rebound (its initial part) price moves (and we'll likely make much more in the following weeks and months), but you have to be healthy to really enjoy the results.
As always, we'll keep you - our subscribers - informed.
To summarize:
Trading capital (supplementary part of the portfolio; our opinion): Full speculative short positions (300% of the full position) in mining stocks is justified from the risk to reward point of view with the following binding exit profit-take price levels:
Senior mining stocks (price levels for the GDX ETF): binding profit-take exit price: $10.32; stop-loss: none (the volatility is too big to justify a SL order in case of this particular trade); binding profit-take level for the DUST ETF: $231.75; stop-loss for the DUST ETF: none (the volatility is too big to justify a SL order in case of this particular trade)
Junior mining stocks (price levels for the GDXJ ETF): binding profit-take exit price: $9.57; stop-loss: none (the volatility is too big to justify a SL order in case of this particular trade); binding profit-take level for the JDST ETF: $284.25; stop-loss for the JDST ETF: none (the volatility is too big to justify a SL order in case of this particular trade)
For-your-information targets (our opinion; we continue to think that mining stocks are the preferred way of taking advantage of the upcoming price move, but if for whatever reason one wants / has to use silver or gold for this trade, we are providing the details anyway. In our view, silver has greater potential than gold does):
Silver futures downside profit-take exit price: $8.58 (the downside potential for silver is significant, but likely not as big as the one in the mining stocks)
Gold futures downside profit-take exit price: $1,382 (the target for gold is least clear; it might drop to even $1,170 or so; the downside potential for gold is significant, but likely not as big as the one in the mining stocks or silver)
Long-term capital (core part of the portfolio; our opinion): No positions (in other words: cash
Insurance capital (core part of the portfolio; our opinion): Full position
Whether you already subscribed or not, we encourage you to find out how to make the most of our alerts and read our replies to the most common alert-and-gold-trading-related-questions.
Please note that the in the trading section we describe the situation for the day that the alert is posted. In other words, it we are writing about a speculative position, it means that it is up-to-date on the day it was posted. We are also featuring the initial target prices, so that you can decide whether keeping a position on a given day is something that is in tune with your approach (some moves are too small for medium-term traders and some might appear too big for day-traders).
Plus, you might want to read why our stop-loss orders are usually relatively far from the current price.
Please note that a full position doesn't mean using all of the capital for a given trade. You will find details on our thoughts on gold portfolio structuring in the Key Insights section on our website.
As a reminder - "initial target price" means exactly that - an "initial" one, it's not a price level at which we suggest closing positions. If this becomes the case (like it did in the previous trade) we will refer to these levels as levels of exit orders (exactly as we've done previously). Stop-loss levels, however, are naturally not "initial", but something that, in our opinion, might be entered as an order.
Since it is impossible to synchronize target prices and stop-loss levels for all the ETFs and ETNs with the main markets that we provide these levels for (gold, silver and mining stocks - the GDX ETF), the stop-loss levels and target prices for other ETNs and ETF (among other: UGLD, DGLD, USLV, DSLV, NUGT, DUST, JNUG, JDST) are provided as supplementary, and not as "final". This means that if a stop-loss or a target level is reached for any of the "additional instruments" (DGLD for instance), but not for the "main instrument" (gold in this case), we will view positions in both gold and DGLD as still open and the stop-loss for DGLD would have to be moved lower. On the other hand, if gold moves to a stop-loss level but DGLD doesn't, then we will view both positions (in gold and DGLD) as closed. In other words, since it's not possible to be 100% certain that each related instrument moves to a given level when the underlying instrument does, we can't provide levels that would be binding. The levels that we do provide are our best estimate of the levels that will correspond to the levels in the underlying assets, but it will be the underlying assets that one will need to focus on regarding the signs pointing to closing a given position or keeping it open. We might adjust the levels in the "additional instruments" without adjusting the levels in the "main instruments", which will simply mean that we have improved our estimation of these levels, not that we changed our outlook on the markets. We are already working on a tool that would update these levels on a daily basis for the most popular ETFs, ETNs and individual mining stocks.
Our preferred ways to invest in and to trade gold along with the reasoning can be found in the how to buy gold section. Additionally, our preferred ETFs and ETNs can be found in our Gold & Silver ETF Ranking.
As a reminder, Gold & Silver Trading Alerts are posted before or on each trading day (we usually post them before the opening bell, but we don't promise doing that each day). If there's anything urgent, we will send you an additional small alert before posting the main one.
Thank you.
Sincerely,
Przemyslaw Radomski, CFA
Editor-in-chief, Gold & Silver Fund Manager

