

Briefly: In our opinion, full (150% of the regular full position) speculative short positions in gold, silver and mining stocks are justified from the risk/reward perspective at the moment of publishing this alert.
All eyes were on the U.S. dollar yesterday as its index plunged about a full index point. The precious metals reacted by rallying and mining stocks finally managed to rally substantially and on huge volume. What can this strength in mining stocks along with the dollar’s slide tell us?
Let’s examine the situation starting with the USD Index (chart courtesy of http://stockcharts.com).
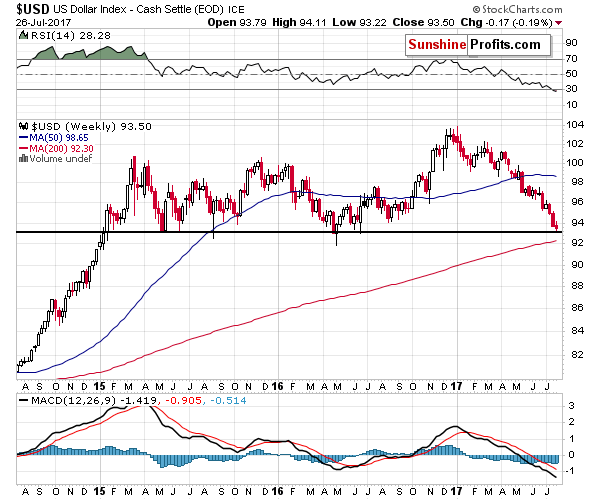
In the July 24, 2017 Alert, we wrote the following regarding the USD Index:
The USD Index broke below the late-2016 lows on Friday and there are a few things that we would like to stress. Firstly, the USD Index declined in an accelerated manner (reverse parabola), which is how the most volatile price swings end (remember the 2011 top in gold?). Secondly, the RSI indicator is the most oversold since the 2011 bottom (yes, the situation is so extreme at this point), while the fundamental picture still favors higher USD Index values (rising rates in the U.S. compared to expansive monetary policy in the EU and Japan, despite somewhat hawkish comments from Mario Draghi). Thirdly, while the USD broke through the short-term support levels, it is now approaching a long-term one – the 2015 and 2016 lows in terms of the weekly closing prices. They are just above the 93 level – about 0.6 below last week’s low. That’s only half of last week’s decline that would need to be seen for the USD to reach these key lows. In fact, just a repeat of Friday’s decline would almost be enough.
All of these factors point to a nearby reversal and the way that gold, silver, and – in particular – mining stocks have been reacting to the USD’s decline (to a limited extent) suggests that a reversal in the USD is likely to trigger a sharp decline in the precious metals sector.
Even if the USD was to repeat it’s Friday’s decline, would it be a good idea to bet on higher PM prices or even stay on the sidelines, especially given the recent show of volatility in silver?
The mentioned target area – just above the 93 level – was just reached. The USD Index moved to 93.152 (Bloomberg data), which was below the May 2015 bottom (in terms of the weekly closing prices - 93.18), but above the lowest weekly close of 2016 (93.03). Overall, it seems that the weekly support level was reached. It’s only two sessions until the week ends, so it could be the case that the bottom is already in. If it’s not, it’s likely at hand.
On June 24, we also wrote the following regarding gold and silver:
Can gold and silver move higher temporarily? Yes, but very likely not much higher. Can gold and silver plunge shortly after reaching their tops and decline in a very volatile manner, similarly to what silver did recently? Naturally, that’s the key thing in the current situation – the downside potential is multiple times greater than the temporary upside potential.
Gold could move to $1,265 or so (the previous top and the rising support line), but would that really matter if gold plunged over $150 shortly thereafter? The analogous price level for silver would be $16.90 and everyone saw recently just how fast silver could decline once it’s time for it.
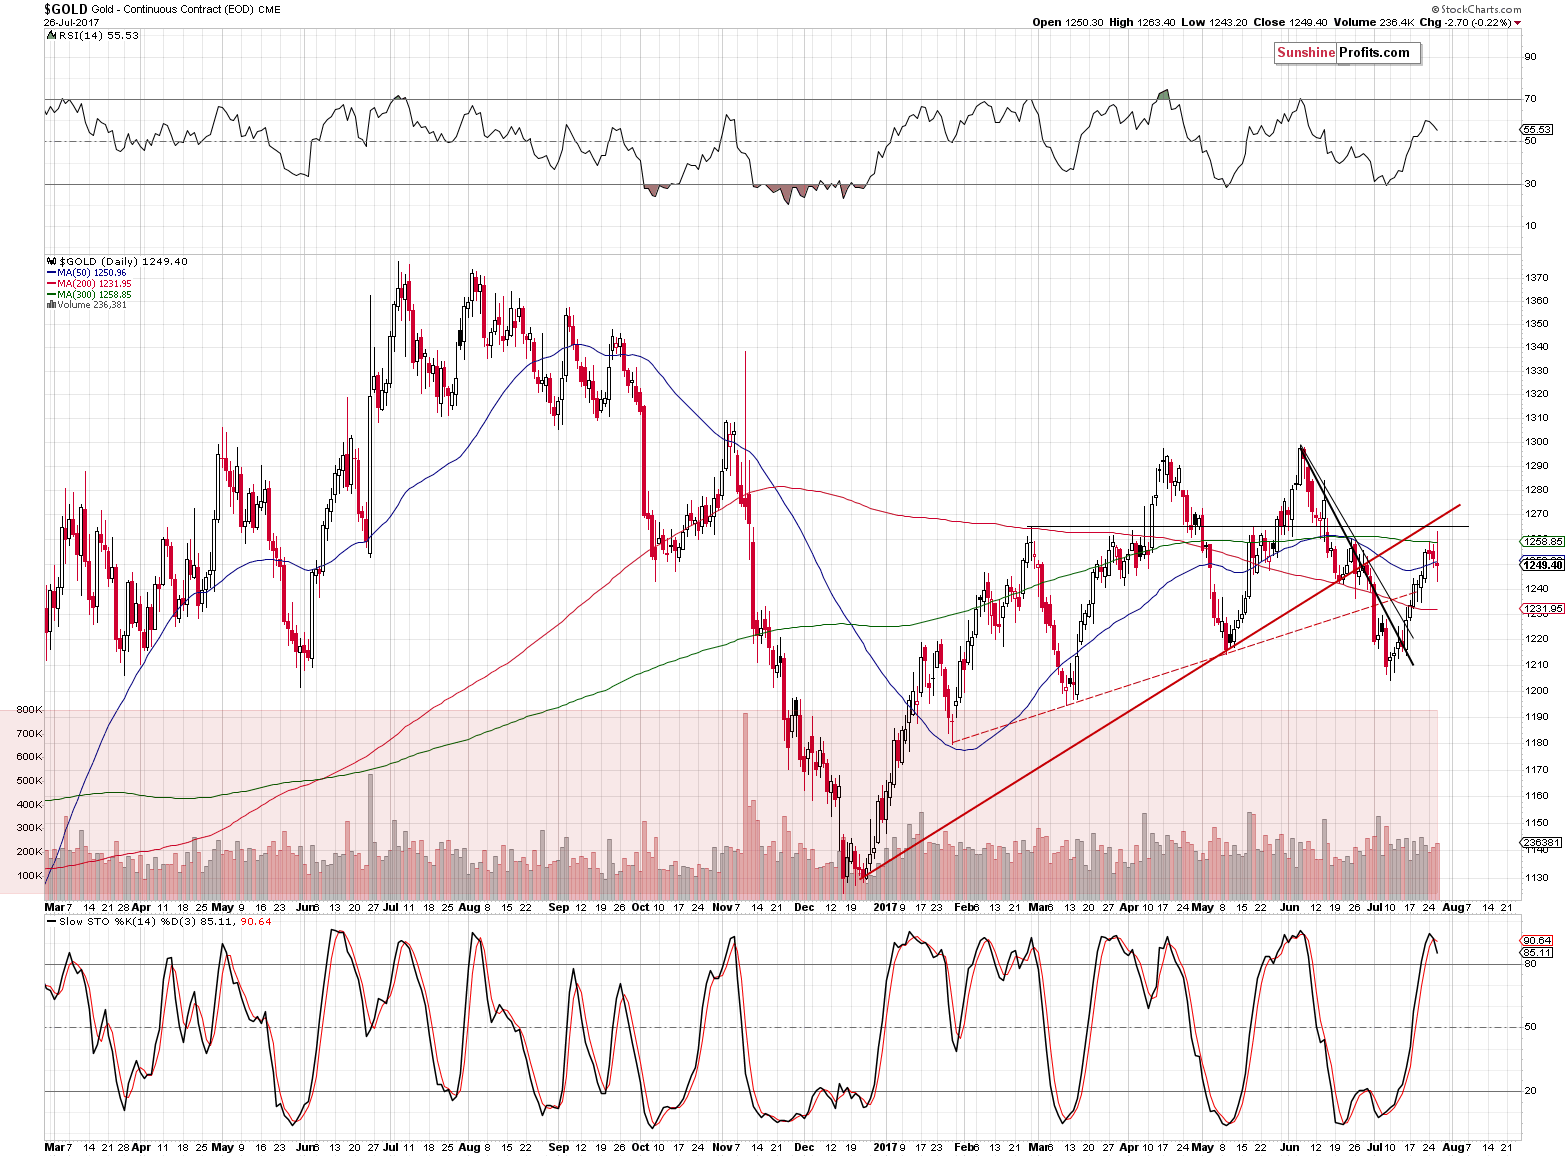
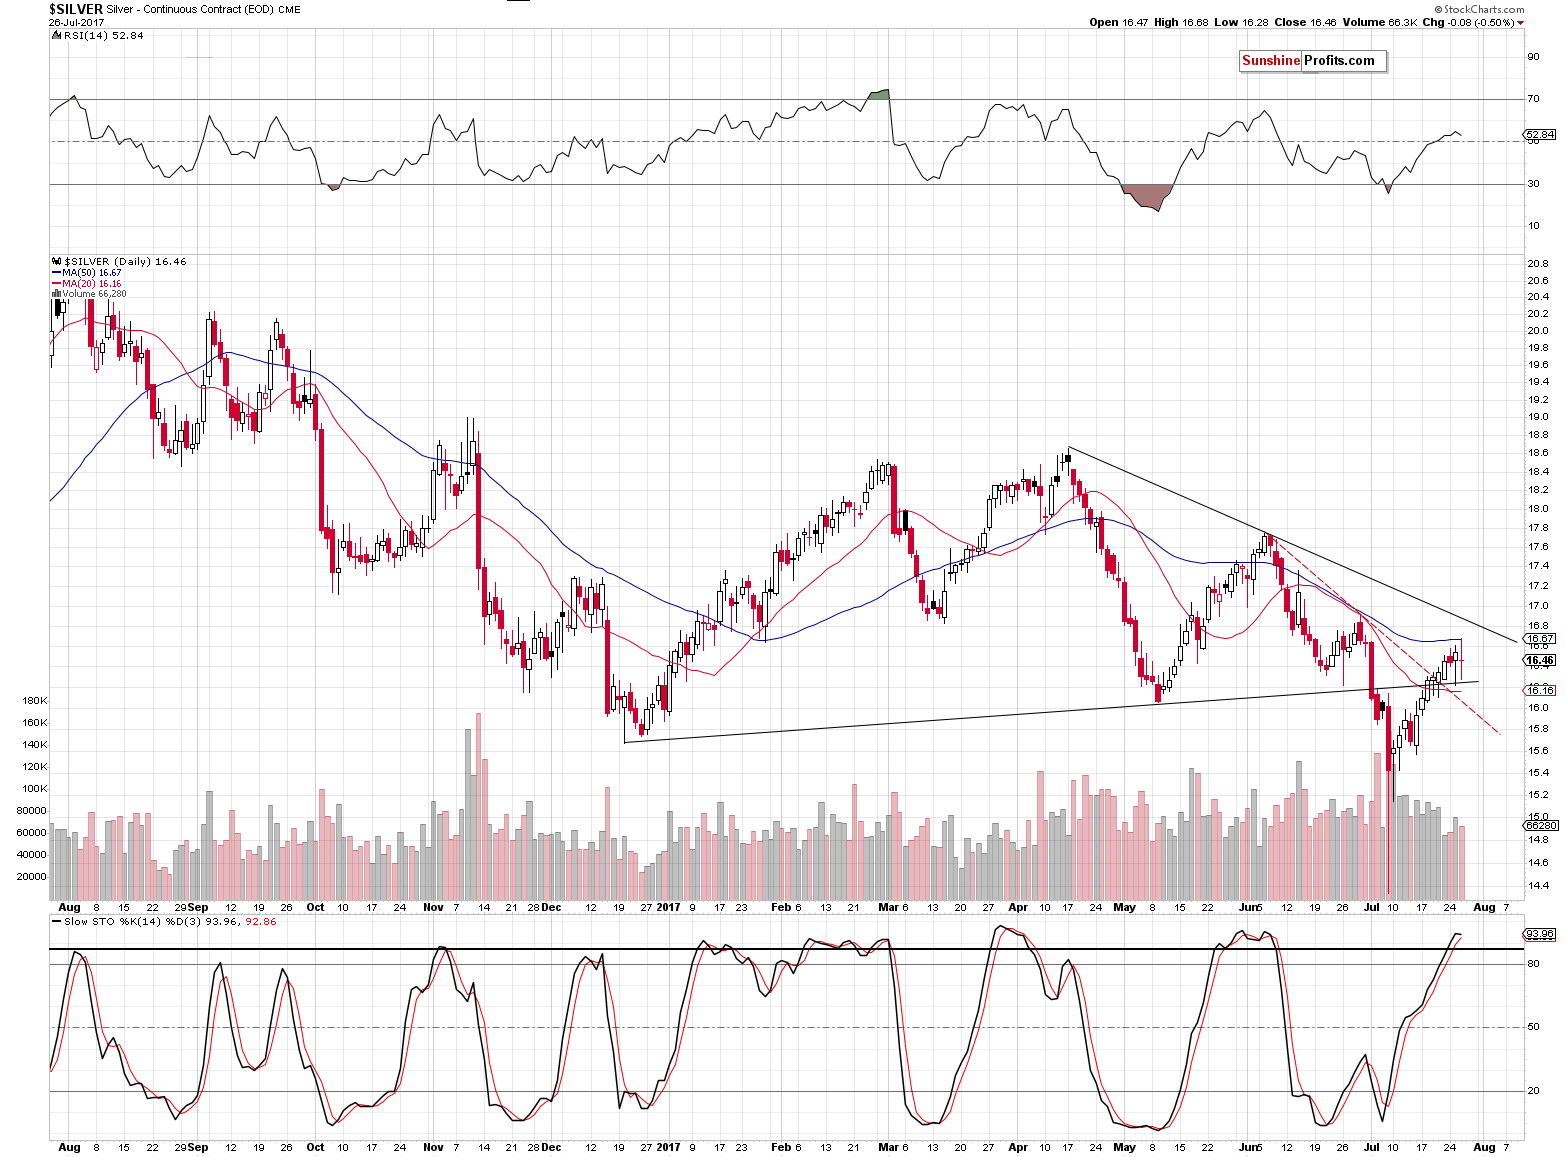
That’s exactly what gold did (today’s pre-market high was about $1,265). Actually, gold could move to above $1,270 and reverse after that as the rising red resistance line is now higher than when we wrote the above. Silver moved just a little above $16.70, so it didn’t even reach its declining resistance line.
Gold’s $16 and silver’s $0.20 upswings (from the start of the move to today’s pre-market high) may seem significant, but compared to the USD’s decline that was about a full index point, they are not bullish at all. The reactions are still weak.
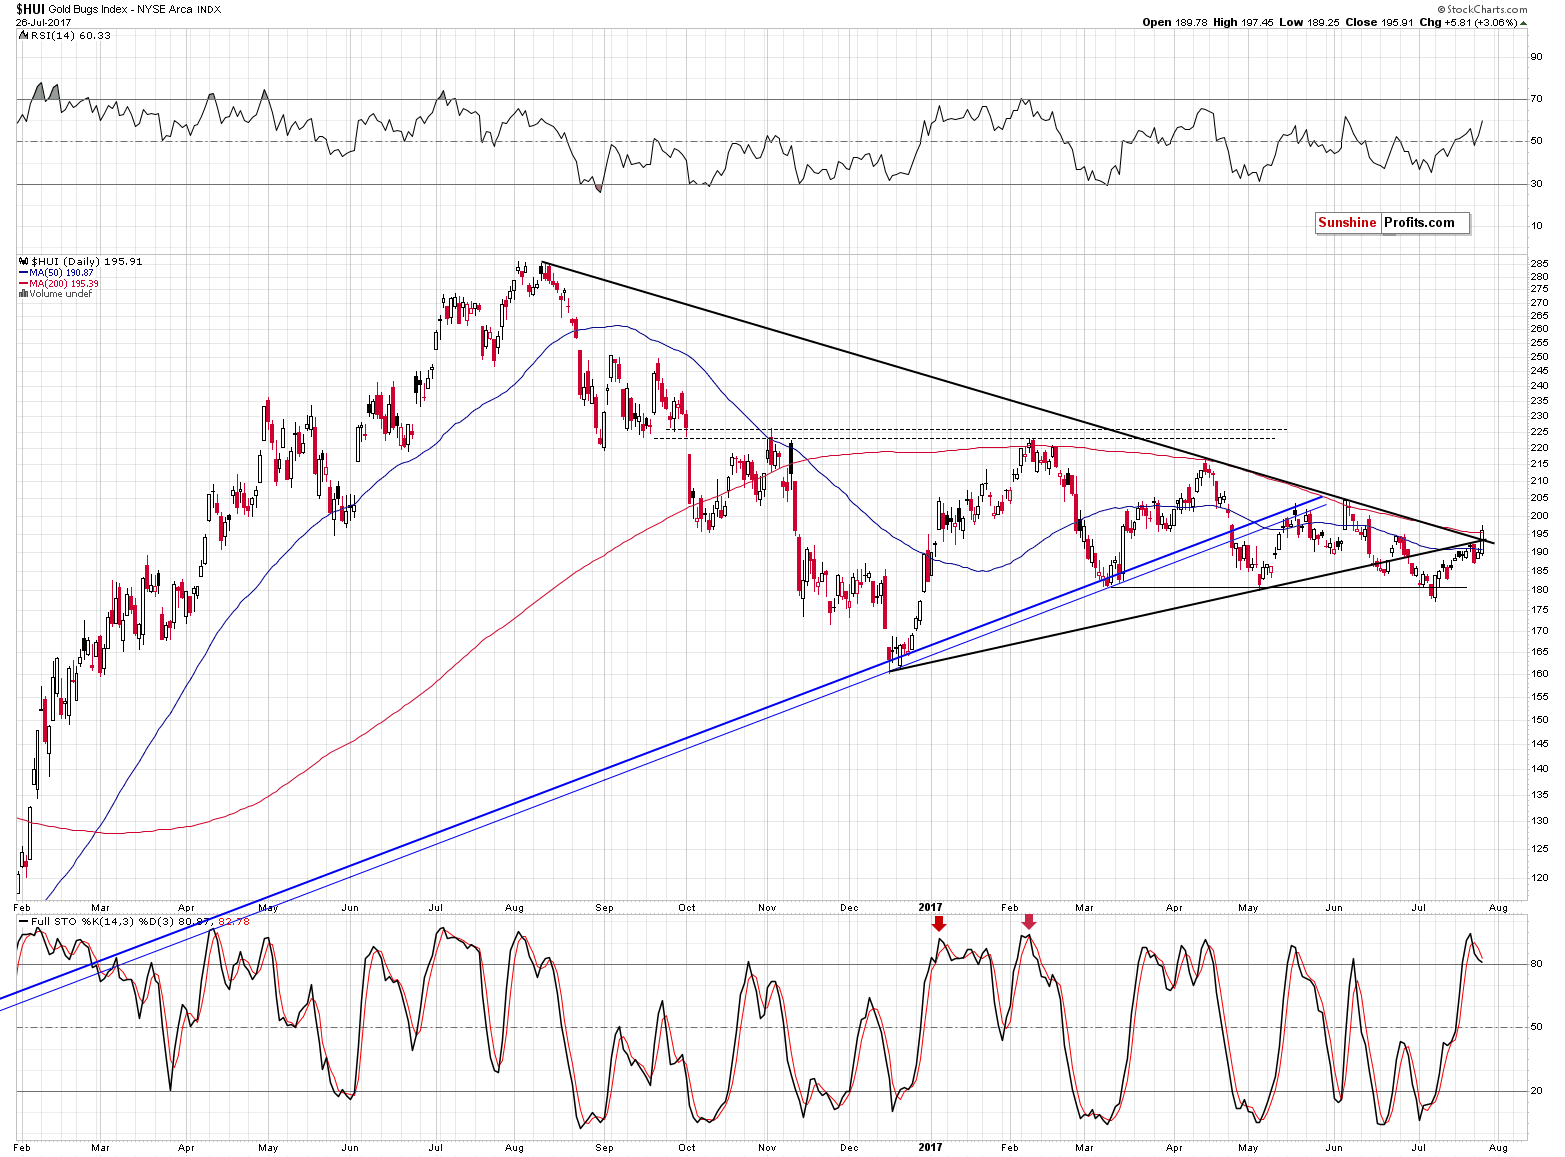
Speaking of reactions, mining stocks finally showed strength, but a single day thereof doesn’t appear convincing and there are several reasons for it. First of all, it is generally a good idea to wait for a given breakout’s confirmation before taking any action based on it, so the gold stocks’ move above two resistance lines and a single close above them is not convincing.
The second reason is that it is quite common for the lagging market to outperform right before / at the top and there’s little doubt regarding what part of the precious metals market was underperforming in the past days and weeks. The above mechanism works in this way as the general public enters the market at the tops, favors things that are cheaper without thinking, considering that perhaps they are cheaper or have been underperforming for a reason. It’s the same thing with junior mining stocks, which quite often outperform senior mining stocks close to the tops (that was the case yesterday, by the way). It didn’t have to be the case yesterday (it would have been more profound if silver had soared and miners hadn’t, but given the recent obvious lag in mining stock prices, this mechanism could be in play).
The third reason is the performance of the Stochastic indicator – despite the upswing, it didn’t invalidate the recent sell signal.
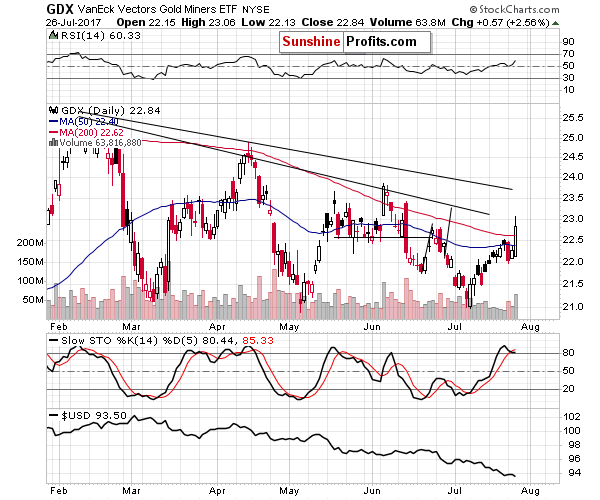
Finally, the fourth reason is the spike in volume. If it was the beginning of a rally, or the volume had been gradually increasing, an increase in the volume would be a bullish sign. However, none of these things apply and the analogy to the previous tops does.
In the first half of April, we saw a decline from above the 50-day moving average on more visible volume, which was followed by an even more profound rally on much higher volume. That was right before the final top. In case of the mid-May, the final top also took place on heavy volume and the same goes for the early June top. The level of volume that accompanied yesterday’s price move is in line with the levels of volume that were seen at or right before all recent tops. Consequently, it doesn’t seem that yesterday’s high volume is bullish.
Summing up, the USD Index moved to the previous bottoms in terms of the weekly closing prices in a very volatile manner. Gold and silver responded in a rather weak manner and even though mining stocks finally outperformed, the way in which they rallied (including the volume that accompanied the upswing) seems to resemble what happened at the previous tops. All in all, the session might have seemed exciting, but the situation didn’t change based on it. The medium-term outlook remains bearish and any strength here – if we see it at all – is likely to be only temporary.
As always, we will keep you – our subscribers – informed.
To summarize:
Trading capital (supplementary part of the portfolio; our opinion): Short positions (150% of the full position) in gold, silver and mining stocks are justified from the risk/reward perspective with the following stop-loss orders and initial target price levels / profit-take orders:
- Gold: initial target price level: $1,063; stop-loss: $1,317; initial target price for the DGLD ETN: $81.88; stop-loss for the DGLD ETN $44.57
- Silver: initial target price: $13.12; stop-loss: $19.22; initial target price for the DSLV ETN: $46.18; stop-loss for the DSLV ETN $17.93
- Mining stocks (price levels for the GDX ETF): initial target price: $9.34; stop-loss: $26.34; initial target price for the DUST ETF: $143.56; stop-loss for the DUST ETF $21.37
In case one wants to bet on junior mining stocks' prices (we do not suggest doing so – we think senior mining stocks are more predictable in the case of short-term trades – if one wants to do it anyway, we provide the details), here are the stop-loss details and initial target prices:
- GDXJ ETF: initial target price: $14.13; stop-loss: $45.31
- JDST ETF: initial target price: $417.04; stop-loss: $43.12
Long-term capital (core part of the portfolio; our opinion): No positions (in other words: cash)
Insurance capital (core part of the portfolio; our opinion): Full position
Important Details for New Subscribers
Whether you already subscribed or not, we encourage you to find out how to make the most of our alerts and read our replies to the most common alert-and-gold-trading-related-questions.
Please note that the in the trading section we describe the situation for the day that the alert is posted. In other words, it we are writing about a speculative position, it means that it is up-to-date on the day it was posted. We are also featuring the initial target prices, so that you can decide whether keeping a position on a given day is something that is in tune with your approach (some moves are too small for medium-term traders and some might appear too big for day-traders).
Plus, you might want to read why our stop-loss orders are usually relatively far from the current price.
Please note that a full position doesn’t mean using all of the capital for a given trade. You will find details on our thoughts on gold portfolio structuring in the Key Insights section on our website.
As a reminder – “initial target price” means exactly that – an “initial” one, it’s not a price level at which we suggest closing positions. If this becomes the case (like it did in the previous trade) we will refer to these levels as levels of exit orders (exactly as we’ve done previously). Stop-loss levels, however, are naturally not “initial”, but something that, in our opinion, might be entered as an order.
Since it is impossible to synchronize target prices and stop-loss levels for all the ETFs and ETNs with the main markets that we provide these levels for (gold, silver and mining stocks – the GDX ETF), the stop-loss levels and target prices for other ETNs and ETF (among other: UGLD, DGLD, USLV, DSLV, NUGT, DUST, JNUG, JDST) are provided as supplementary, and not as “final”. This means that if a stop-loss or a target level is reached for any of the “additional instruments” (DGLD for instance), but not for the “main instrument” (gold in this case), we will view positions in both gold and DGLD as still open and the stop-loss for DGLD would have to be moved lower. On the other hand, if gold moves to a stop-loss level but DGLD doesn’t, then we will view both positions (in gold and DGLD) as closed. In other words, since it’s not possible to be 100% certain that each related instrument moves to a given level when the underlying instrument does, we can’t provide levels that would be binding. The levels that we do provide are our best estimate of the levels that will correspond to the levels in the underlying assets, but it will be the underlying assets that one will need to focus on regarding the signs pointing to closing a given position or keeping it open. We might adjust the levels in the “additional instruments” without adjusting the levels in the “main instruments”, which will simply mean that we have improved our estimation of these levels, not that we changed our outlook on the markets. We are already working on a tool that would update these levels on a daily basis for the most popular ETFs, ETNs and individual mining stocks.
Our preferred ways to invest in and to trade gold along with the reasoning can be found in the how to buy gold section. Additionally, our preferred ETFs and ETNs can be found in our Gold & Silver ETF Ranking.
As a reminder, Gold & Silver Trading Alerts are posted before or on each trading day (we usually post them before the opening bell, but we don't promise doing that each day). If there's anything urgent, we will send you an additional small alert before posting the main one.
=====
Latest Free Trading Alerts:
Yesterday, the Fed released its most recent monetary policy statement. How can it affect the gold market?
On Tuesday, crude oil extended gains and hit a fresh July high, but will we see further rally in the coming days?
Yesterday, the greenback extended losses against the Canadian dollar, which resulted in a drop below the May 2016 low. Does it mean that the way to lower levels is open?
=====
Hand-picked precious-metals-related links:
Physical gold demand rises in first half, but market sees surplus: GFMS
Spot Gold Advances as Fed Holds Rates Steady, Assesses Inflation
Fresnillo silver, gold output jump on San Julian ramp up, higher ores
=====
In other news:
Fed says stimulus wind down to begin 'relatively soon,' leaves rates unchanged
Dollar steadies after Fed skid, shares hit new highs
Libor to End in 2021 as FCA Says Bank Benchmark Is Untenable
=====
Thank you.
Sincerely,
Przemyslaw Radomski, CFA
Founder, Editor-in-chief, Gold & Silver Fund Manager
Gold & Silver Trading Alerts
Forex Trading Alerts
Oil Investment Updates
Oil Trading Alerts

