

Briefly: in our opinion, full (300% of the regular position size) speculative short positions in junior mining stocks are justified from the risk/reward point of view at the moment of publishing this Alert.
As you read in yesterday’s analysis, the massive decline in the precious metals sector (especially in junior mining stocks) is here. After reading it, your profits on the short position in junior miners increased once again – congratulations!
At the moment of writing these words, gold is after/during a small correction, which is completely normal. Just because the market is likely to move somewhere it doesn’t mean that it’s likely to move there immediately. Wherever it moves, there will likely be corrections along the way, even if we just see them on an intraday basis.
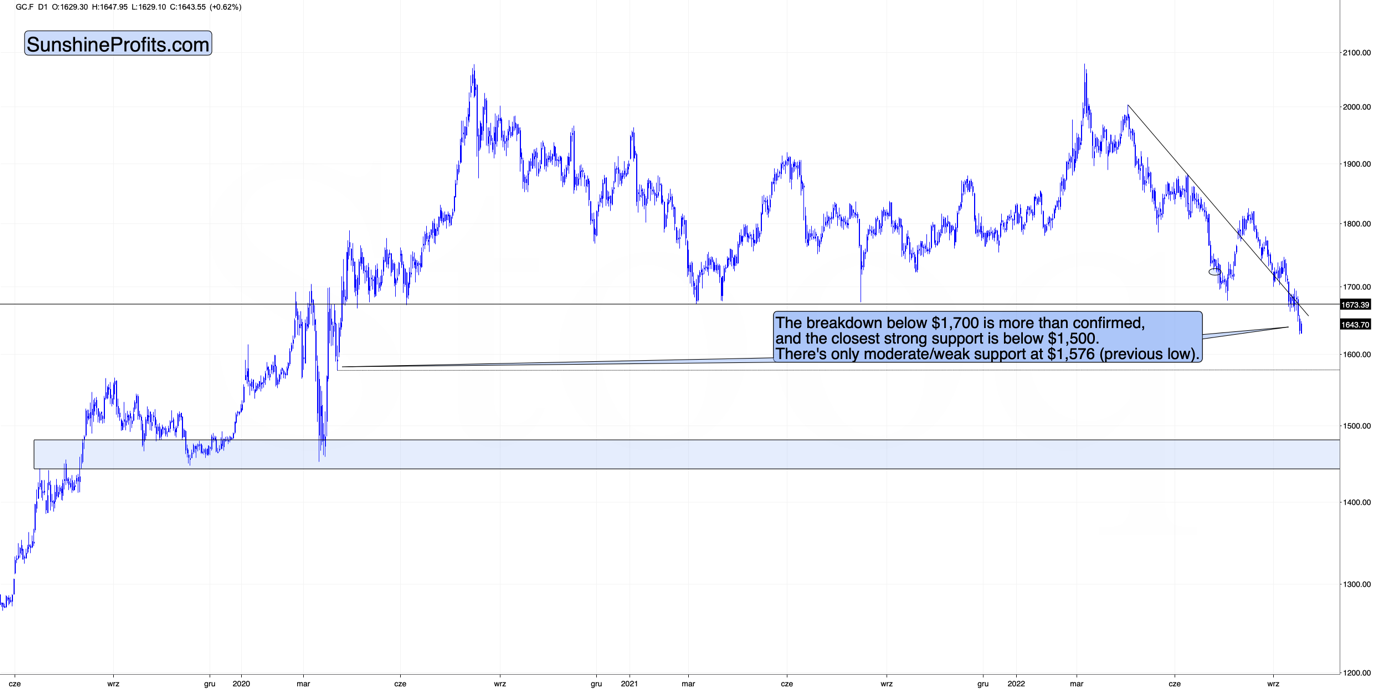
Gold is after a clear and confirmed breakdown below $1,700 – something that it hasn’t been able to do for many months. The above-mentioned level was a very strong support as it worked multiple times (also as resistance).
Because this strong support was broken and the breakdown was verified, it tells us that the force of the bears is even stronger! This, in turn, means that gold is unlikely to decline just a little now.
No.
It’s likely to slide.
There’s practically no strong support until gold’s price declines below $1,500. Since gold futures are trading at about $1,643 at the moment of writing these words, it seems that gold has a lot of room to decline in the near future.
Now, the above doesn’t mean that gold “has to decline immediately, every single day”. There might be small corrections along the way.
So what’s the point of writing about the strong support being so far, if there could be corrections earlier, anyway?
Because those small corrections are too small to be tradable in my opinion. They can – in my view – simply be ignored. I want you to know that a tiny rebound doesn’t invalidate the entire concept of this huge decline.
There is moderate/weak support at about $1,576 (the previous low), but I doubt that it would trigger a move that’s meaningful enough for us to care about it. If stocks move to an important support at that time, or the USD Index moves to an important resistance, then I might consider making adjustments to the very short-term outlook (and the trading position), but it seems unlikely at this point.
What appears likely is a move a bit below $1,500 and a rebound from there.
So, yes, I continue to expect gold’s next important bottom to form close to its 2020 low.
There’s a very good reason not to try to time every possible correction right now – the analogy to 2013 that’s been so useful in recent weeks and months.
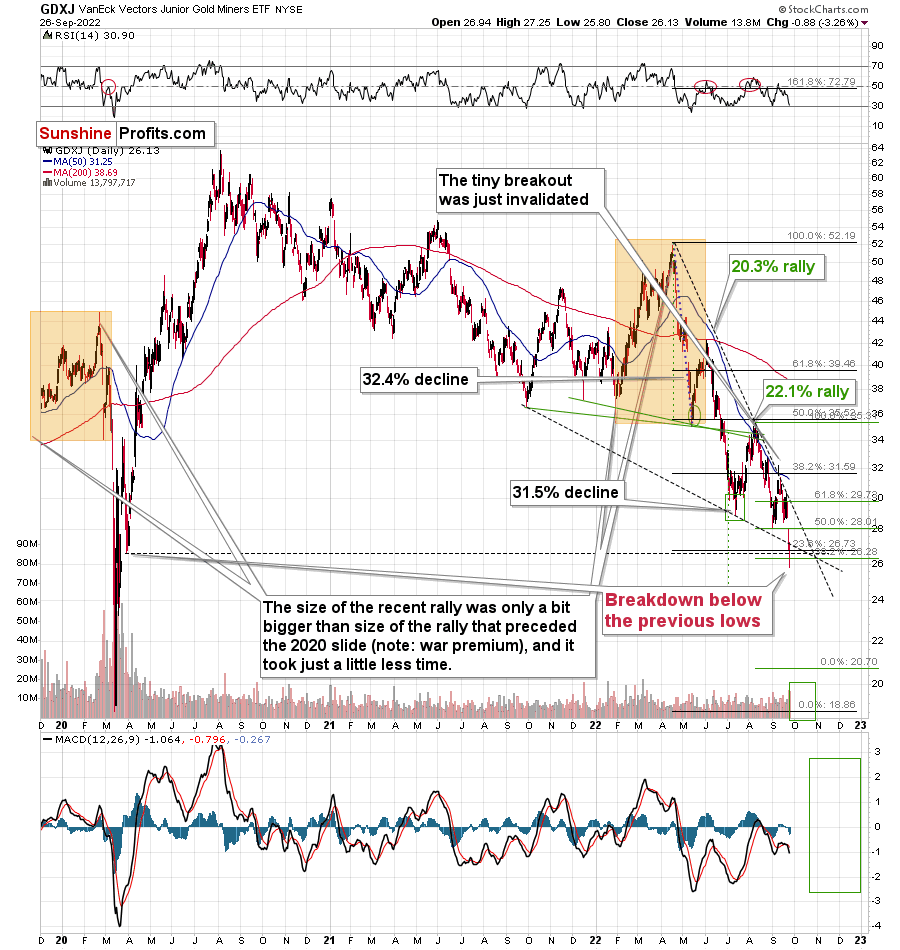
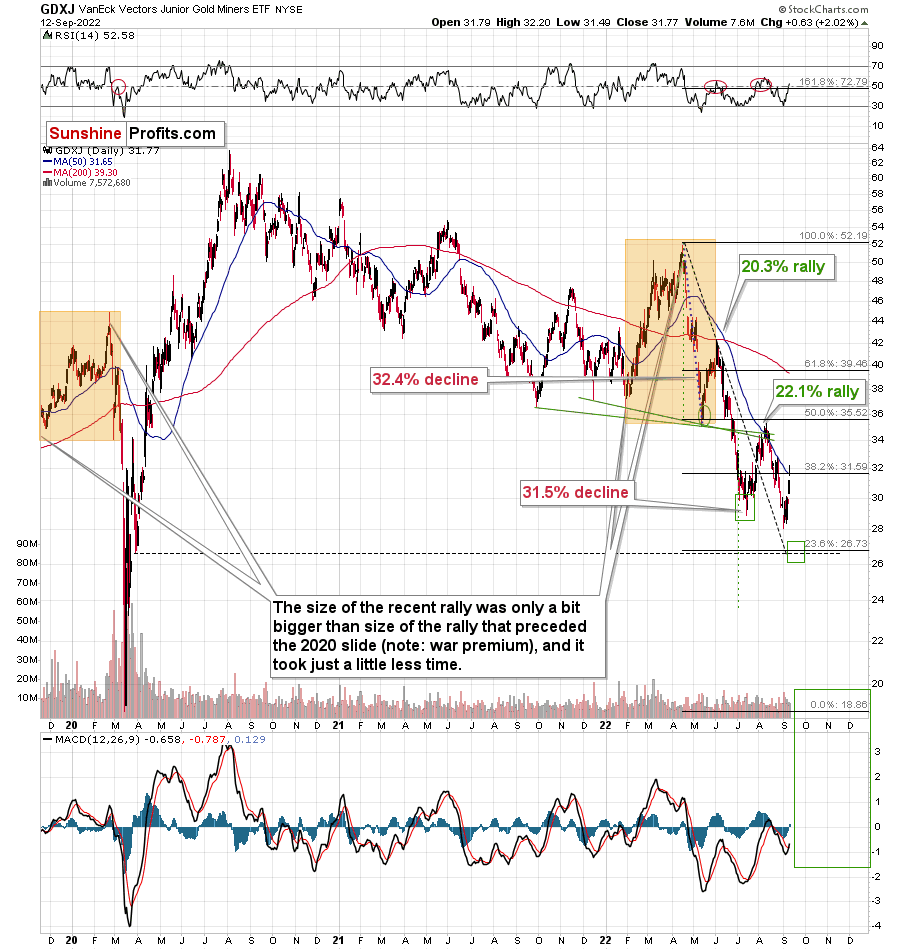
The Sep. 2012 – Mar. 2013 decline seems analogous to the Apr. 2022 – Jul. 2022 decline.
The Mar. 2013 rally appears analogous to the Jul. – Aug. 2022 rally.
And the early Apr. 2013 rally seems analogous to the Sep. 2022 rally.
Moreover, I wrote about this link earlier this month. Quoting my Sep. 13, 2022 Gold & Silver Trading Alert:
What about junior mining stocks?
They moved higher as they were practically forced to by rallying gold, but please note that they ended the day only 2% higher, which is very little compared to silver’s almost 6% rally.
Plus, please note that junior miners reversed some of their earlier gains before the end of the session.
Interestingly, the GDXJ just approached its 50-day moving average, which means the end of previous counter-trend rallies ever since the April 2022 top.
This ~$4 rally fits the final counter-trend rally that we saw in 2013.
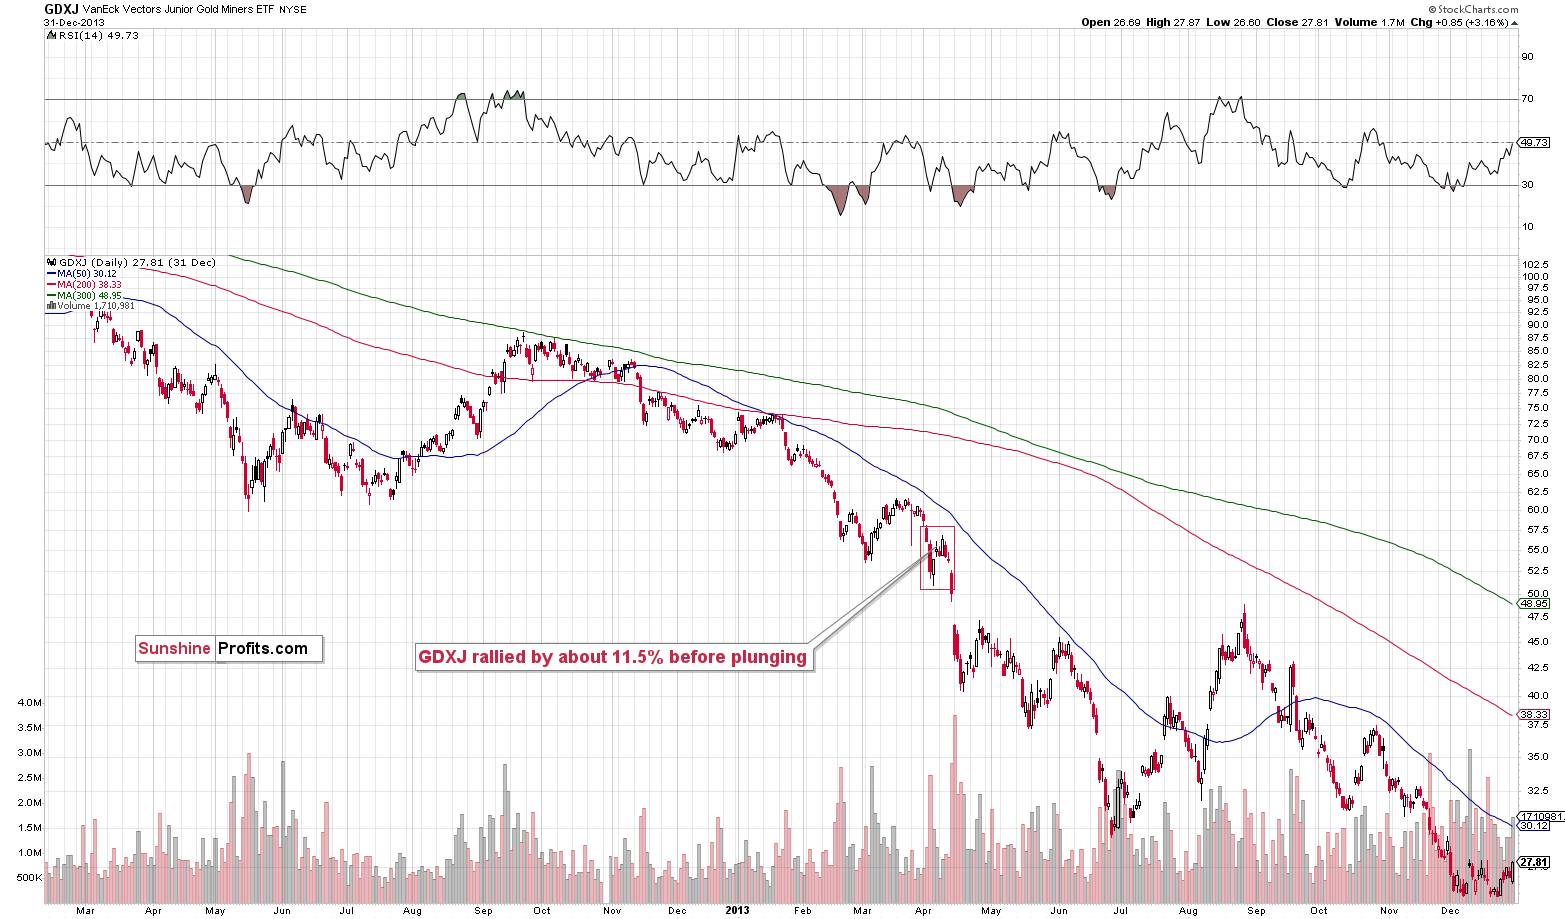
The GDXJ rallied by about 14.7% from its recent low.
Back in 2013, the GDXJ rallied by about 11.5% before plunging.
This time, the corrective rally is bigger, but please note that the decline that we saw beforehand was sharper than what we saw in 2013. Consequently, a bigger bounce is normal.
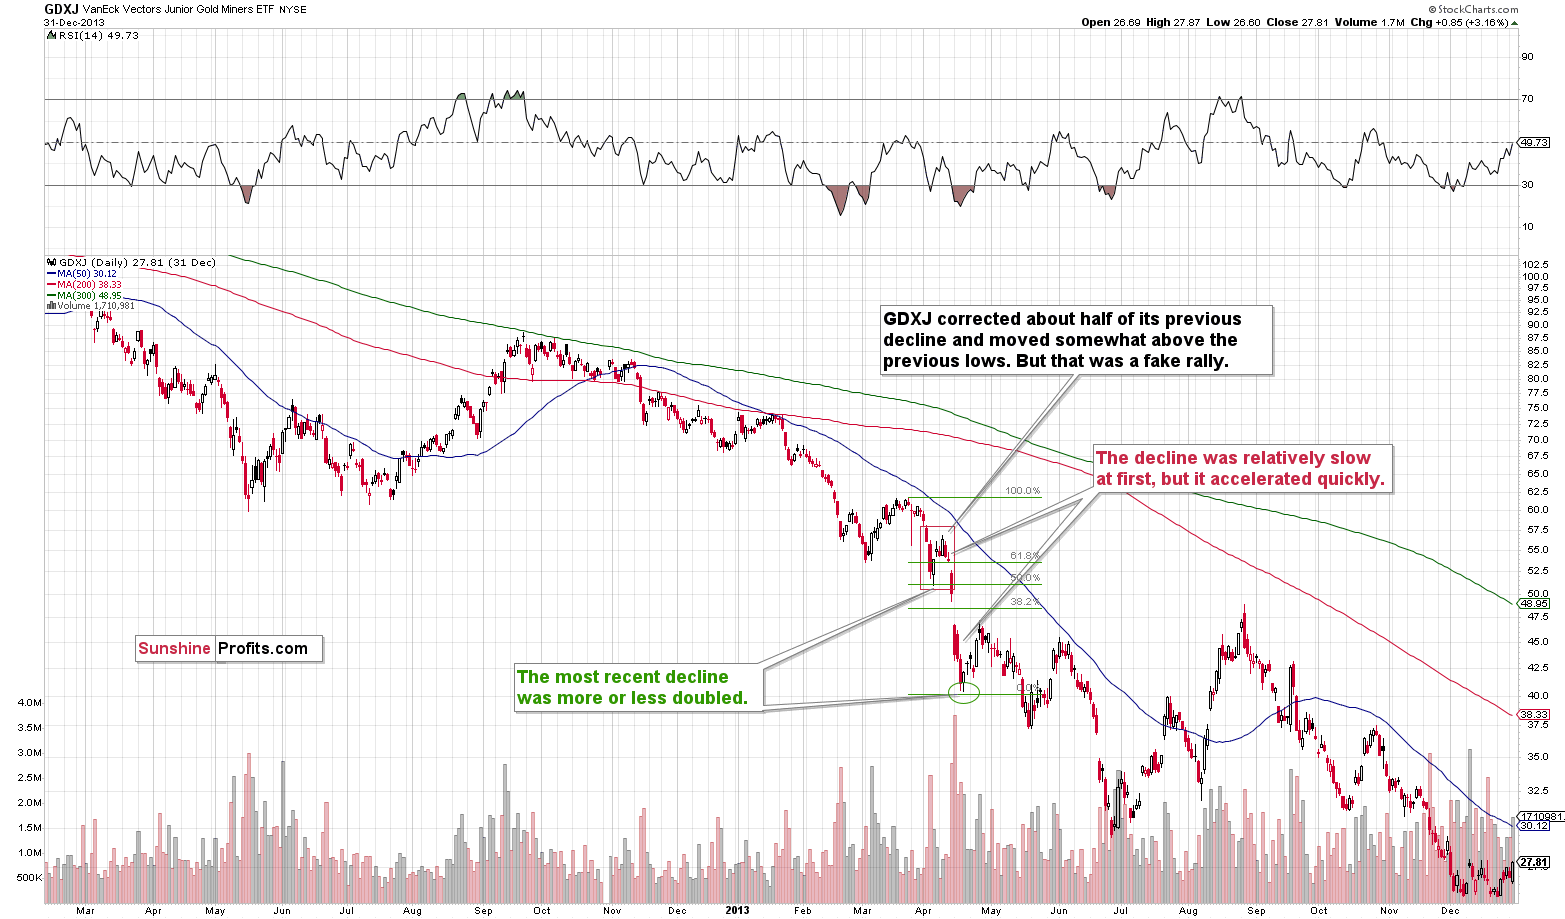
It’s even more interesting to compare the rally to the previous price movement. In both bases, the GDXJ corrected about half of the preceding short-term rally, and it moved above the most recent short-term low. This is exactly what we saw recently.
This is yet another indication that what we’re seeing right now is a part of a bigger pattern that’s very bearish.
One might focus on the last few days on a stand-alone basis and claim that “the rally is bullish,” but in my opinion, this narrow focus might be very costly.
Indeed, the GDXJ declined shortly thereafter.
What does it mean? It means that if the analogy is to continue (and it’s likely), then we are now likely to see a big decline without visible corrections. That’s how GDXJ declined back in April 2013.
As the GDXJ doubled its initial decline in 2013, it’s quite likely to do something similar again this time. I marked this with green lines, and this technique currently points to a target below $21.
Yes, in my view, the GDXJ has some sizable decline ahead of it, and (also, just my opinion), a very profitable one, too – at least to those who are positioned correctly.
Having said that, let’s take a look at the markets from a more fundamental angle.
Crisis of Confidence
With another dismal day of news battering risk assets on Sep. 26, gold, silver, mining stocks and the S&P 500 all ended the day in the red. Moreover, like a broken record, the GDXJ ETF closed at a new 2022 low, while the USD Index and the U.S. 10-Year real yield hit new 2022 highs. As a result, the bearish technical and fundamental developments that I warned about have come to fruition.
Furthermore, with the bond market continuing its epic sell-off, U.S. Treasury yields soared once again. Therefore, with inflation and prospective rate hikes depressing Treasuries’ appeal, higher interest rates are profoundly bearish for the PMs.
Please see below:
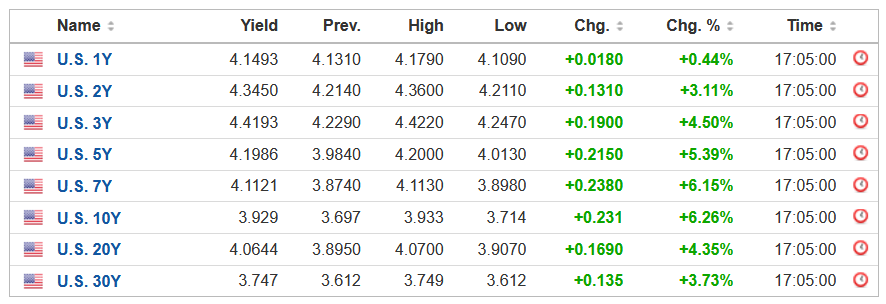 Source: Investing.com
Likewise, I warned perpetually throughout 2021 and 2022 that the U.S. federal funds rate (FFR) needed to go much higher than the consensus expected. For context, we project the FFR will hit 4.5% to 5.5% in 2023.
However, while it was roughly two months ago that rate cuts were being priced in by futures traders, expectations have materially shifted. Now, the consensus is pricing in a peak FFR of ~4.70% in June, July, and August 2023. As such, the crowd has come around to our way of thinking.
Please see below:
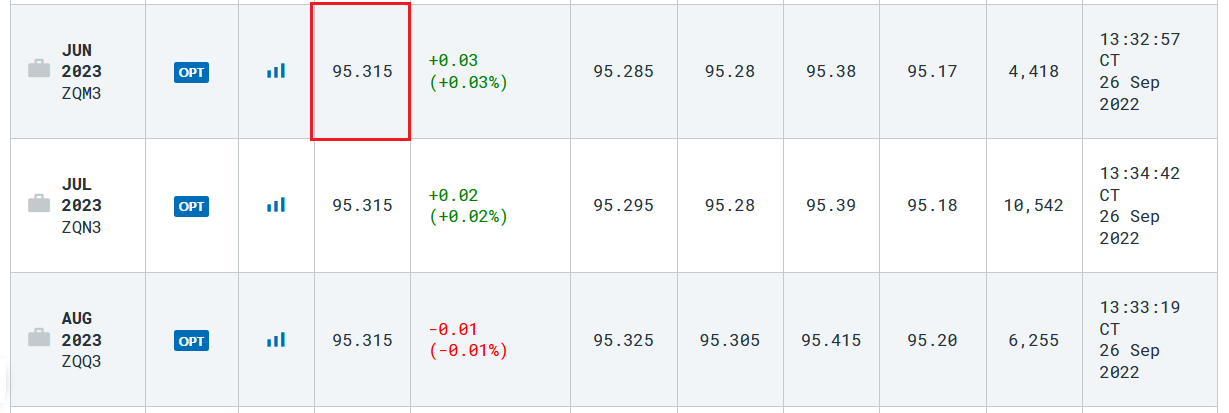 Source: CME Group
To explain, the implied FFR is calculated by subtracting the last price from 100, and the recent move pegs current expectations at 4.685% (100-95.315). Thus, the bond, futures, and FX markets align with the Fed, and risk assets like the GDXJ ETF and the S&P 500 have become sacrificial lambs.
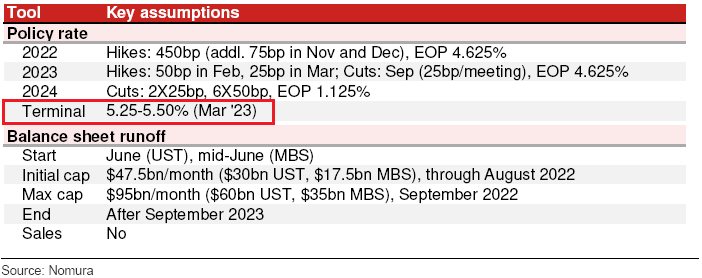
In addition, Nomura’s U.S. Economic Research Team increased its FFR projection on Sep. 23. The strategists wrote:
“Growing evidence that the short-term ‘Neutral Rate’ has increased on 1) looser than expected financial conditions, 2) resilient labor markets and 3) still-elevated inflation suggesting that the Nominal ‘Neutral Rate’ is likely higher than 2%-2.5%, implying any given level of Fed policy will thus be more accommodative than previously believed.
“Consequently, we have revised up our ‘Terminal Rate’ forecast by 75bps to 5.25%-5.50% and now expect rate hikes of 75bps in Nov and Dec ‘22, followed by 50bps in Feb and 25bps in Mar ‘23.”
Please see below:
So, with investment banks coming around to the hawkish realities that I warned about for months, suddenly, a 5% FFR isn’t so outrageous. As further evidence, Bank of America increased its FFR projection to 4.75% to 5% by March 2023, up from a previous expectation of 4% to 4.25%.
Please see below:
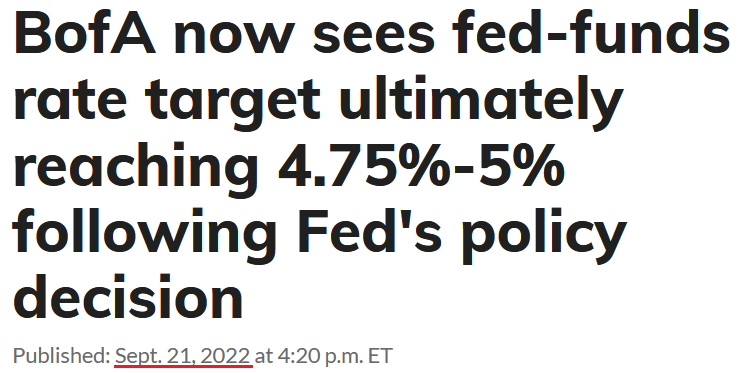 Source: MarketWatch
On top of that, while the crowd is starting to smell blood in the water, a 5% FFR is still in the minority. Thus, while gold, silver, mining stocks and the S&P 500 have suffered mightily in 2022, there is still more room for further re-pricing when a higher FFR becomes the consensus.
Please see below:
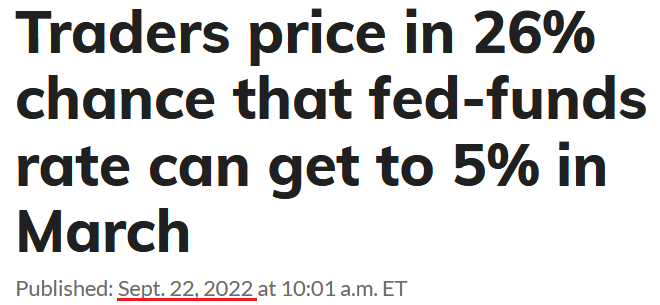 Source: MarketWatch
Also, it’s important to remember that the Fed’s mishandling of inflation in 2021 left the central bank with two choices: let inflation rage and endure a hyperinflationary collapse or raise interest rates and engineer a rate-hike-induced recession. For context, every inflation fight since 1954 has ended with a recession. Therefore, while the latter is much less damaging to the U.S. economy than the former, investors are unlikely to celebrate the realities that often occur alongside a higher FFR.
Please see below:
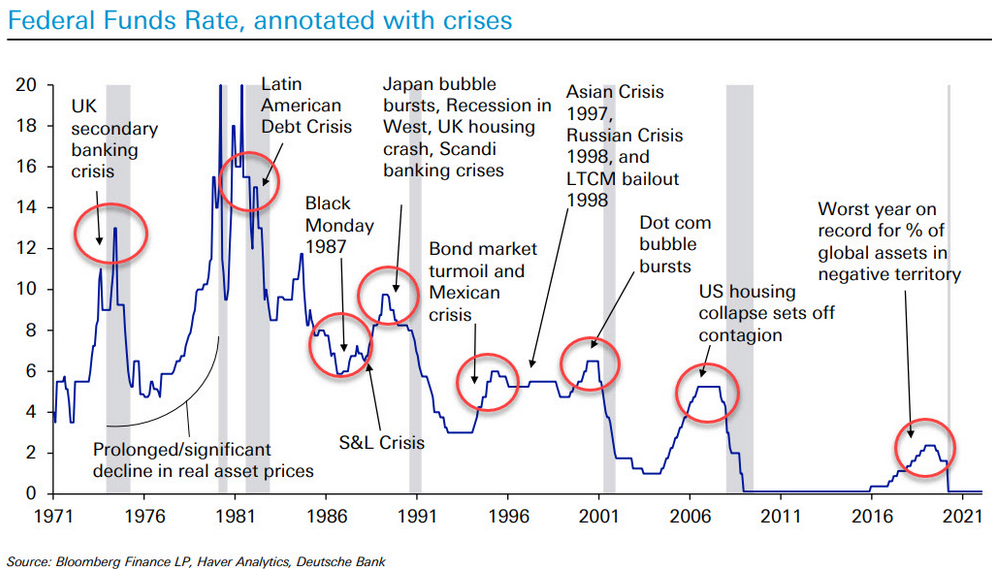
To explain, the blue line above tracks the FFR, while the vertical gray bars represent historical recessions. Likewise, the red circles and annotations highlight the crises that emerged alongside the Fed's historical rate hike cycles. As you can see, plenty of drama unfolds when the Fed increases the hawkish temperature.
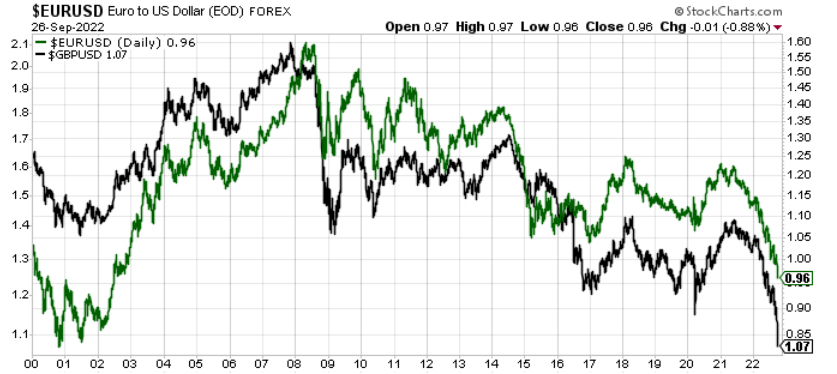
Furthermore, with the GBP/USD and the EUR/USD sinking into the FX abyss, record or near-record low currency values are destabilizing forces that create economic imbalances. As a result, if something breaks in the U.K. or the Eurozone, the fallout could intensify the ferocity of the PMs' medium-term drawdowns.
Please see below:
Overall, the PMs continue to suffer from the ominous technical and fundamental issues that I warned about for months. Moreover, while the ‘buy the dip’ crowd will likely make their presence felt at some point since asset prices don’t move in a straight line, the PMs and the S&P 500 are likely far from their medium-term bottoms. As such, the fall and winter months should bring more pain for risky assets.
Another Hawkish PMI
The Dallas Fed released its Texas Manufacturing Outlook Survey on Sep. 26. Moreover, while the headline index declined from -12.9 in August to -17.2 in September, the report revealed:
“Labor market measures continued to indicate robust employment growth and longer workweeks. The employment index was largely unchanged at 15.0, a reading significantly above its series average of 7.8. Twenty-four percent of firms noted net hiring, while 9 percent noted net layoffs. The hours worked index remained slightly elevated but moved down six points to 8.0.”
Also:
“Prices and wages continued to increase at an elevated pace. The raw materials prices index ticked up from 34.4 to 37.1, ending a three-month trend of easing price pressures. The finished goods prices index, however, continued its downward trend and fell nine points to 18.1, a reading still well above average. The wages and benefits index fell nine points, coming in at 36.6.”
In addition, this month’s special questions consolidated responses from Texas’ manufacturing, service sector and retail companies; and with nearly 85% of respondents citing little trouble obtaining short-term financing or that it’s not needed, the Fed’s actions have not led to a credit freeze.
Please see below:
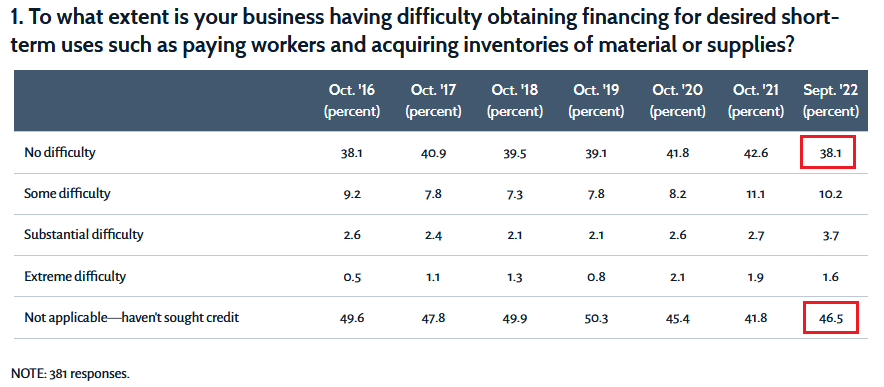 Source: Dallas Fed
More importantly, when asked about their most-pressing business concerns over the next six months, the majority cited labor shortages, wages and inflation.
Please see below:
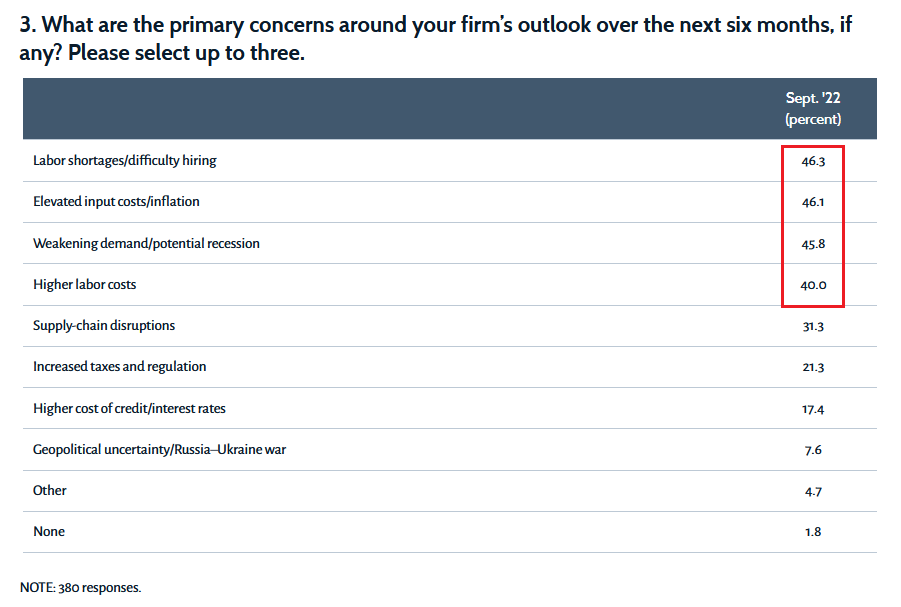 Source: Dallas Fed
To explain, while fears about weak demand and a potential recession made it into the top four, the main concerns among Texas’ manufacturing, service sector and retail companies are labor and inflation. Therefore, with the Fed’s 2022 rate hikes not having the desired impact, the FFR needs to rise substantially to normalize supply and demand. Also, with employment still rising, competition for workers should keep wage inflation elevated for the foreseeable future.
Speaking of the U.S. labor market, Boston Fed President Susan Collins said on Sep. 26 that “I do anticipate that accomplishing price stability will require slower employment growth and a somewhat higher unemployment rate.”
She added:
“A significant economic or geopolitical event could push our economy into a recession as policy tightens further. Moreover, calibrating policy in these circumstances will be complicated by the fact that some effects of monetary policy do work with a lag.”
So while Collins mentioned “slower employment growth and a somewhat higher unemployment rate,” progress is occurring at a snail’s pace. Furthermore, given the number of job openings relative to Americans unemployed, the labor force participation rate needs to rise substantially or employment needs to contract.
In this absence, employees will stay in the driver’s seat, and wage inflation will reign. As a result, the FFR is much too low, and further rate hikes only enhance the bullish outlook for the USD Index and real yields.
The Bottom Line
The PMs were crushed once again on Sep. 26, though many assets are at or near oversold conditions. Therefore, while a short-term sentiment rally may materialize, the fundamentals continue to worsen. With major currencies under immense pressure, U.S. nominal and real interest rates at decade highs and the USD index on fire, the PMs’ confront a treacherous medium-term backdrop. As such, we still expect their final lows to materialize in the months ahead.
In conclusion, the PMs declined on Sep. 26, as the GDX ETF, the GDXJ ETF and gold closed at new 2022 lows. Moreover, with the USD Index and the U.S. 10-Year real yield continuing their rapid ascents, the cross-asset price action continues to unfold as expected. Thus, our short position has produced profound profits, and we expect more gains in Q4 2022.
Overview of the Upcoming Part of the Decline
- It seems to me that the corrective upswing is over, and that the next big move lower is already underway.
- If we see a situation where miners slide in a meaningful and volatile way while silver doesn’t (it just declines moderately), I plan to – once again – switch from short positions in miners to short positions in silver. At this time, it’s too early to say at what price levels this could take place and if we get this kind of opportunity at all – perhaps with gold prices close to $1,600.
- I plan to switch from the short positions in junior mining stocks or silver (whichever I’ll have at that moment) to long positions in junior mining stocks when gold / mining stocks move to their 2020 lows (approximately). While I’m probably not going to write about it at this stage yet, this is when some investors might consider getting back in with their long-term investing capital (or perhaps 1/3 or 1/2 thereof).
- I plan to return to short positions in junior mining stocks after a rebound – and the rebound could take gold from about $1,450 to about $1,550, and it could take the GDXJ from about $20 to about $24.
- I plan to exit all remaining short positions once gold shows substantial strength relative to the USD Index while the latter is still rallying. This may be the case with gold prices close to $1,400 and GDXJ close to $15 . This moment (when gold performs very strongly against the rallying USD and miners are strong relative to gold after its substantial decline) is likely to be the best entry point for long-term investments, in my view. This can also happen with gold close to $1,400, but at the moment it’s too early to say with certainty.
- The above is based on the information available today, and it might change in the following days/weeks.
You will find my general overview of the outlook for gold on the chart below:
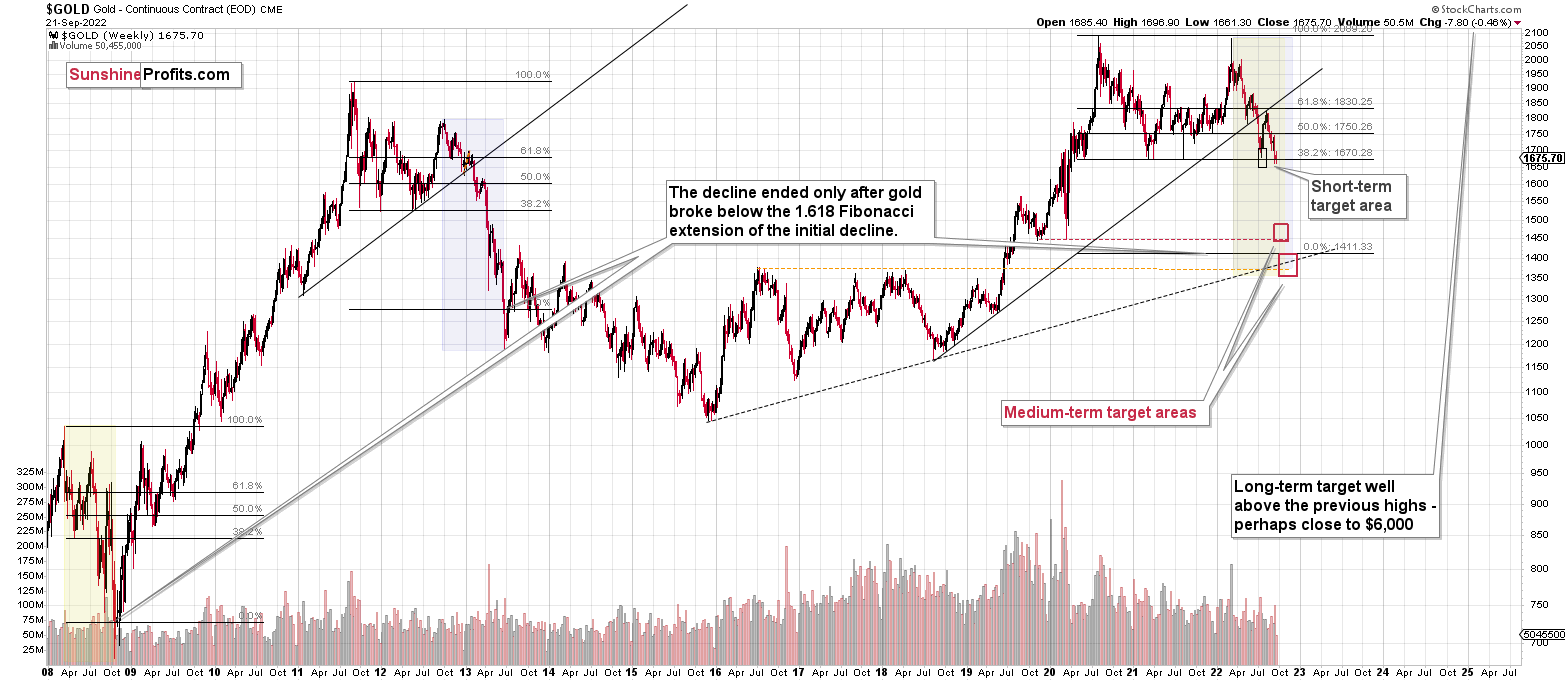
Please note that the above timing details are relatively broad and “for general overview only” – so that you know more or less what I think and how volatile I think the moves are likely to be – on an approximate basis. These time targets are not binding nor clear enough for me to think that they should be used for purchasing options, warrants, or similar instruments.
Letters to the Editor
Q: Thank you so much for such a great service! My question is, why is there such a big difference in price between the spot price of silver in comparison to silver bars or coins? Further, I read that governments are stockpiling gold despite the fact that the spot price is declining. Thank you so much.
A: I’m very happy to read that you’re enjoying my analyses so much, thank you! As for your questions, the prices of physical bars and coins are not as volatile as futures prices. Dealers don’t want to immediately discount prices after the underlying spot value moves lower, as it might come back quite soon (at least that’s what it might look like from their point of view).
There might also be the issue of the availability of a specific bar size / coin type. If it’s currently in high demand, the premium for it will go up.
Anyway, those premiums tend to rise significantly when silver prices drop in a volatile manner, and they then decline when silver either moves back up, or when silver stays lower for longer (and dealers accept the “new normal”). That’s usually the case, and – contrary to popular belief – is not proof of market manipulation (which doesn’t mean that there aren’t many manipulations out there – I’m just saying that the above doesn’t prove it).
As for your second question, please note that governments are historically one of the worst investors – they buy close to the top and sell close to the bottom. Ever heard of the Brown Bottom?
Most gold that’s bought or sold is not due to the purchases and sales of the official sector – it doesn’t dictate prices.
Summary
Summing up, it seems that the biggest part of the 2013-like decline is taking place right now, and – while I can’t make any promises regarding performance - it seems likely to me that our big profits are about to become huge, and then ridiculously big in the relatively near future.
Things might happen very fast in the coming days, and if I plan to make any adjustments, I’ll keep you informed. Still, if the targets that I’m mentioning in the “Trading” part of the summary are reached, I think that profits should be taken off the table without an additional confirmation from me. I will probably get on the long side of the market at that time, but I’ll send a confirmation if I decide to do so.
After the final sell-off (that takes gold to about $1,350-$1,500), I expect the precious metals to rally significantly. The final part of the decline might take as little as 1-5 weeks, so it's important to stay alert to any changes.
As always, we'll keep you – our subscribers – informed.
To summarize:
Trading capital (supplementary part of the portfolio; our opinion): Full speculative short positions (300% of the full position) in junior mining stocks are justified from the risk to reward point of view with the following binding exit profit-take price levels:
Mining stocks (price levels for the GDXJ ETF): binding profit-take exit price: $20.32; stop-loss: none (the volatility is too big to justify a stop-loss order in case of this particular trade)
Alternatively, if one seeks leverage, we’re providing the binding profit-take levels for the JDST (2x leveraged). The binding profit-take level for the JDST: $29.87; stop-loss for the JDST: none (the volatility is too big to justify a SL order in case of this particular trade).
For-your-information targets (our opinion; we continue to think that mining stocks are the preferred way of taking advantage of the upcoming price move, but if for whatever reason one wants / has to use silver or gold for this trade, we are providing the details anyway.):
Silver futures downside profit-take exit price: $12.32
SLV profit-take exit price: $11.32
ZSL profit-take exit price: $79.87
Gold futures downside profit-take exit price: $1,504
HGD.TO – alternative (Canadian) 2x inverse leveraged gold stocks ETF – the upside profit-take exit price: $19.87
HZD.TO – alternative (Canadian) 2x inverse leveraged silver ETF – the upside profit-take exit price: $49.87
Long-term capital (core part of the portfolio; our opinion): No positions (in other words: cash)
Insurance capital (core part of the portfolio; our opinion): Full position
Whether you’ve already subscribed or not, we encourage you to find out how to make the most of our alerts and read our replies to the most common alert-and-gold-trading-related-questions.
Please note that we describe the situation for the day that the alert is posted in the trading section. In other words, if we are writing about a speculative position, it means that it is up-to-date on the day it was posted. We are also featuring the initial target prices to decide whether keeping a position on a given day is in tune with your approach (some moves are too small for medium-term traders, and some might appear too big for day-traders).
Additionally, you might want to read why our stop-loss orders are usually relatively far from the current price.
Please note that a full position doesn't mean using all of the capital for a given trade. You will find details on our thoughts on gold portfolio structuring in the Key Insights section on our website.
As a reminder - "initial target price" means exactly that - an "initial" one. It's not a price level at which we suggest closing positions. If this becomes the case (as it did in the previous trade), we will refer to these levels as levels of exit orders (exactly as we've done previously). Stop-loss levels, however, are naturally not "initial", but something that, in our opinion, might be entered as an order.
Since it is impossible to synchronize target prices and stop-loss levels for all the ETFs and ETNs with the main markets that we provide these levels for (gold, silver and mining stocks - the GDX ETF), the stop-loss levels and target prices for other ETNs and ETF (among other: UGL, GLL, AGQ, ZSL, NUGT, DUST, JNUG, JDST) are provided as supplementary, and not as "final". This means that if a stop-loss or a target level is reached for any of the "additional instruments" (GLL for instance), but not for the "main instrument" (gold in this case), we will view positions in both gold and GLL as still open and the stop-loss for GLL would have to be moved lower. On the other hand, if gold moves to a stop-loss level but GLL doesn't, then we will view both positions (in gold and GLL) as closed. In other words, since it's not possible to be 100% certain that each related instrument moves to a given level when the underlying instrument does, we can't provide levels that would be binding. The levels that we do provide are our best estimate of the levels that will correspond to the levels in the underlying assets, but it will be the underlying assets that one will need to focus on regarding the signs pointing to closing a given position or keeping it open. We might adjust the levels in the "additional instruments" without adjusting the levels in the "main instruments", which will simply mean that we have improved our estimation of these levels, not that we changed our outlook on the markets. We are already working on a tool that would update these levels daily for the most popular ETFs, ETNs and individual mining stocks.
Our preferred ways to invest in and to trade gold along with the reasoning can be found in the how to buy gold section. Furthermore, our preferred ETFs and ETNs can be found in our Gold & Silver ETF Ranking.
As a reminder, Gold & Silver Trading Alerts are posted before or on each trading day (we usually post them before the opening bell, but we don't promise doing that each day). If there's anything urgent, we will send you an additional small alert before posting the main one.
Thank you.
Przemyslaw Radomski, CFA
Founder, Editor-in-chief

