

Briefly: in our opinion, full (300% of the regular position size) speculative short positions in mining stocks are justified from the risk/reward point of view at the moment of publishing this Alert.
Briefly: in our opinion, full (300% of the regular position size) speculative short positions in mining stocks are justified from the risk/reward point of view at the moment of publishing this Alert.
Welcome to this week's flagship Gold & Silver Trading Alert. As we’ve promised you previously, in our flagship Alerts, we will be providing you with much comprehensive and complex analyses (approximately once per week), which will usually take place on Monday.
Predicated on last week’s price moves, our most recently featured outlook remains unchanged as the price moves align with our expectations. On that account, there are parts of the previous analysis that didn’t change at all in the earlier days, which will be written in italics.
Before discussing the technical point of view, we’d like to say a few words on the upcoming US elections, the Covid-19 situation, and the stimulus package(s) related to the latter.
Trump and Biden debated for the second and last time in this campaign. So, who will win – and why gold will benefit the most?
President Donald Trump and Democratic challenger Joe Biden met for the second and last debate before the elections. Thankfully, this time things were less chaotic with fewer interruptions and insults. Perhaps Trump acknowledged that his aggressive mode was instead a liability and decided to change his approach– especially that it was his final opportunity to alter the presidential campaign dynamics.
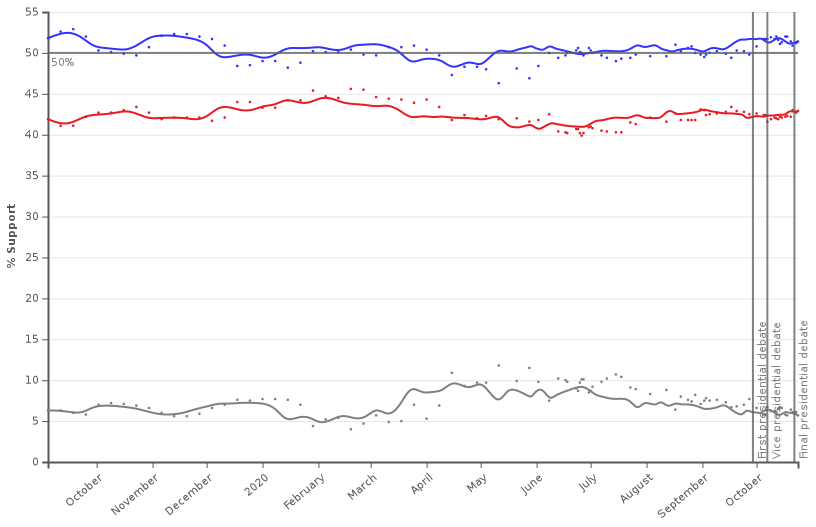
However, it might be too late now. According to both: nation-wide and state-by-state polls, and market bets, Biden still significantly leads in the race (as the chart below shows). Additionally, because of the postal voting, many votes are already locked in, as a record 47 million Americans have already cast their ballots.
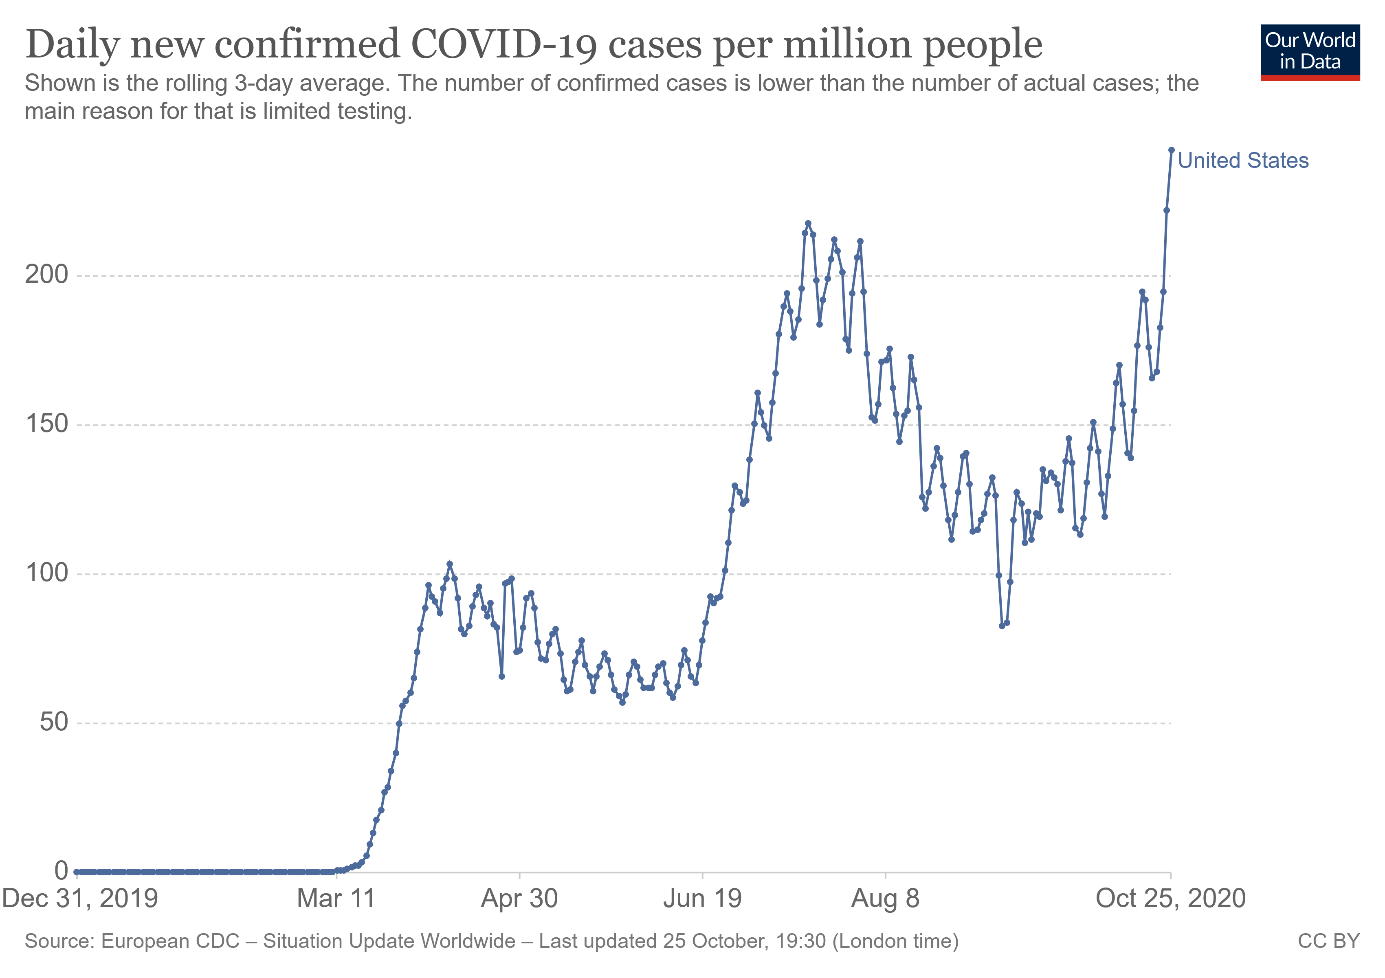
Moreover, the epidemiological situation does not help Trump at all. U.S. citizens believe that he dealt with the epidemic poorly – which is why the nationwide resurgence in the number of Covid-19 cases across the United States (and other countries as well) happens, as the chart below shows. As a matter of fact, this is not only a resurgence, it’s a new black record for the number of cases!
Thus, the pandemic is hitting even harder now than it did in the spring. This also means that the economic recovery will remain fragile, which is bad news for Trump, but excellent for gold prices. Indeed, the latest Beige Book showed that the economic activity in most parts of the country was “slight to modest”. The leading economic index rose only by 0.7 percent in September, following the increases of 1.4 percent in August and 2 percent in July.
However, although mainstream pollsters have corrected some of the mistakes made in 2016, it's safe to assume that Trump has better reelection chances than it is widely believed and reflected in the mainstream polls. As you might’ve noticed, Biden spurs less enthusiasm than Trump and even less enthusiasm than Clinton for that matter. He is mainly an anti-Trump choice, so some of his voters may not show up on a ballot day.
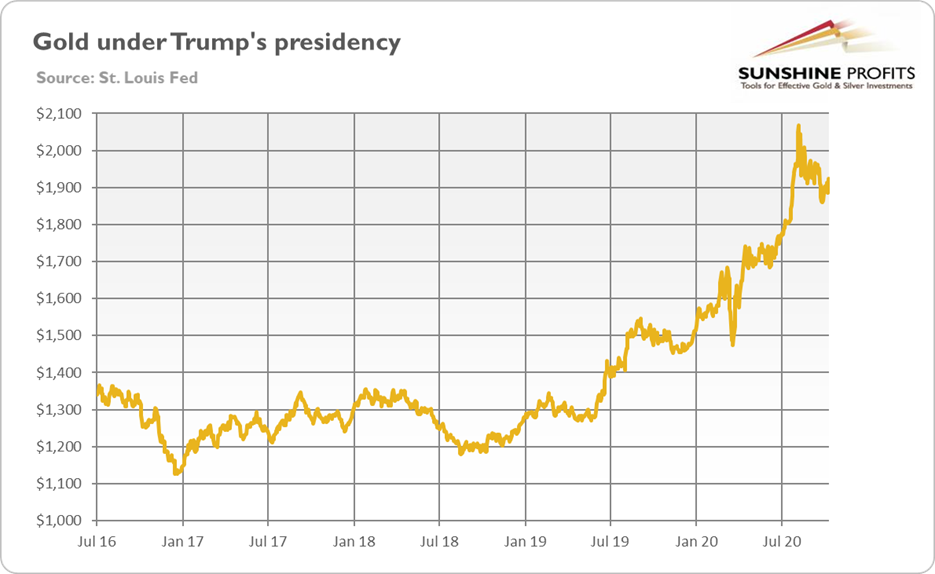
So, what does all the above mean for the gold market? Well, it depends on the election results. The best scenario for gold would be a Democratic sweep, as it would imply more chances of higher taxes, increased regulation, and significant fiscal stimulus. Trump’s victory should be good for gold, as it would continue the trade wars, budget deficits, and geopolitical uncertainty. After all, throughout Trump’s presidency, gold saw about 50-percent in gain, as the chart below shows.
The worst scenario (but not necessarily significantly bad in absolute terms) could be Biden’s victory, with Republicans retaining the Senate. In such a case, we would get more White House predictability in the domestic and foreign policy, while Republicans would block the most disastrous ideas of the new president.
Another issue is that the election results will probably be contested. Some analysts claim that it would be bad for the gold prices, as contested outcomes would delay the fiscal stimulus. However, the conflicts about the results should also drive political uncertainty and support the save-haven demand for gold.
Last but not least, we will reiterate what we said many times earlier. The relevance of the presidential election for the gold prices may be overstated. After all, gold’s fundamentals are still positive: the real interest rates remain in the negative territory, while the US dollar has recently weakened compared to the spring movements (which might change relatively soon).
Moreover, the fiscal stimulus will take place, no matter the election’s result. The only difference is that Democrats are willing to spend more. The new government spending that will increase the fiscal deficit and public debt, even more, should be positive for gold. Notably, the Covid-19 cases' resurgence increases the chances for higher stimulus or additional package after some time. And of course, the Fed will buy most of these newly issued Treasuries, which means a further quantitative easing and a larger Fed balance sheet, which should also support the gold prices.
All in all, there are multiple fundamental reasons why gold is likely to soar in the upcoming years. However, even the most profound bull markets can’t move up in a straight line, and some corrections will likely take place. After the big rallies, we will probably witness significant corrections, and in the case of the precious metals market, one is long overdue.
Much like in March, it seems that the evident economic decline might trigger a sell-off.
At this point, we would like to quote what we wrote about the aspects of the virus scare and how the market reacts to them. In short, gold (and other markets) reacted when people started to strongly consider the pandemic's economic implications, a topic that was ubiquitous in the media.
Undoubtedly, the most important factor for gold will be the economic implications of the second Covid-19 wave. How do we know that? Because we compared what people were searching for (online) with how the gold prices were shaped. There's a lot more data available on https://searchingcovid19.com/, but we'll focus on the chart that shows us exactly when people were getting interested in each aspect of the pandemic, and we'll compare that to gold.
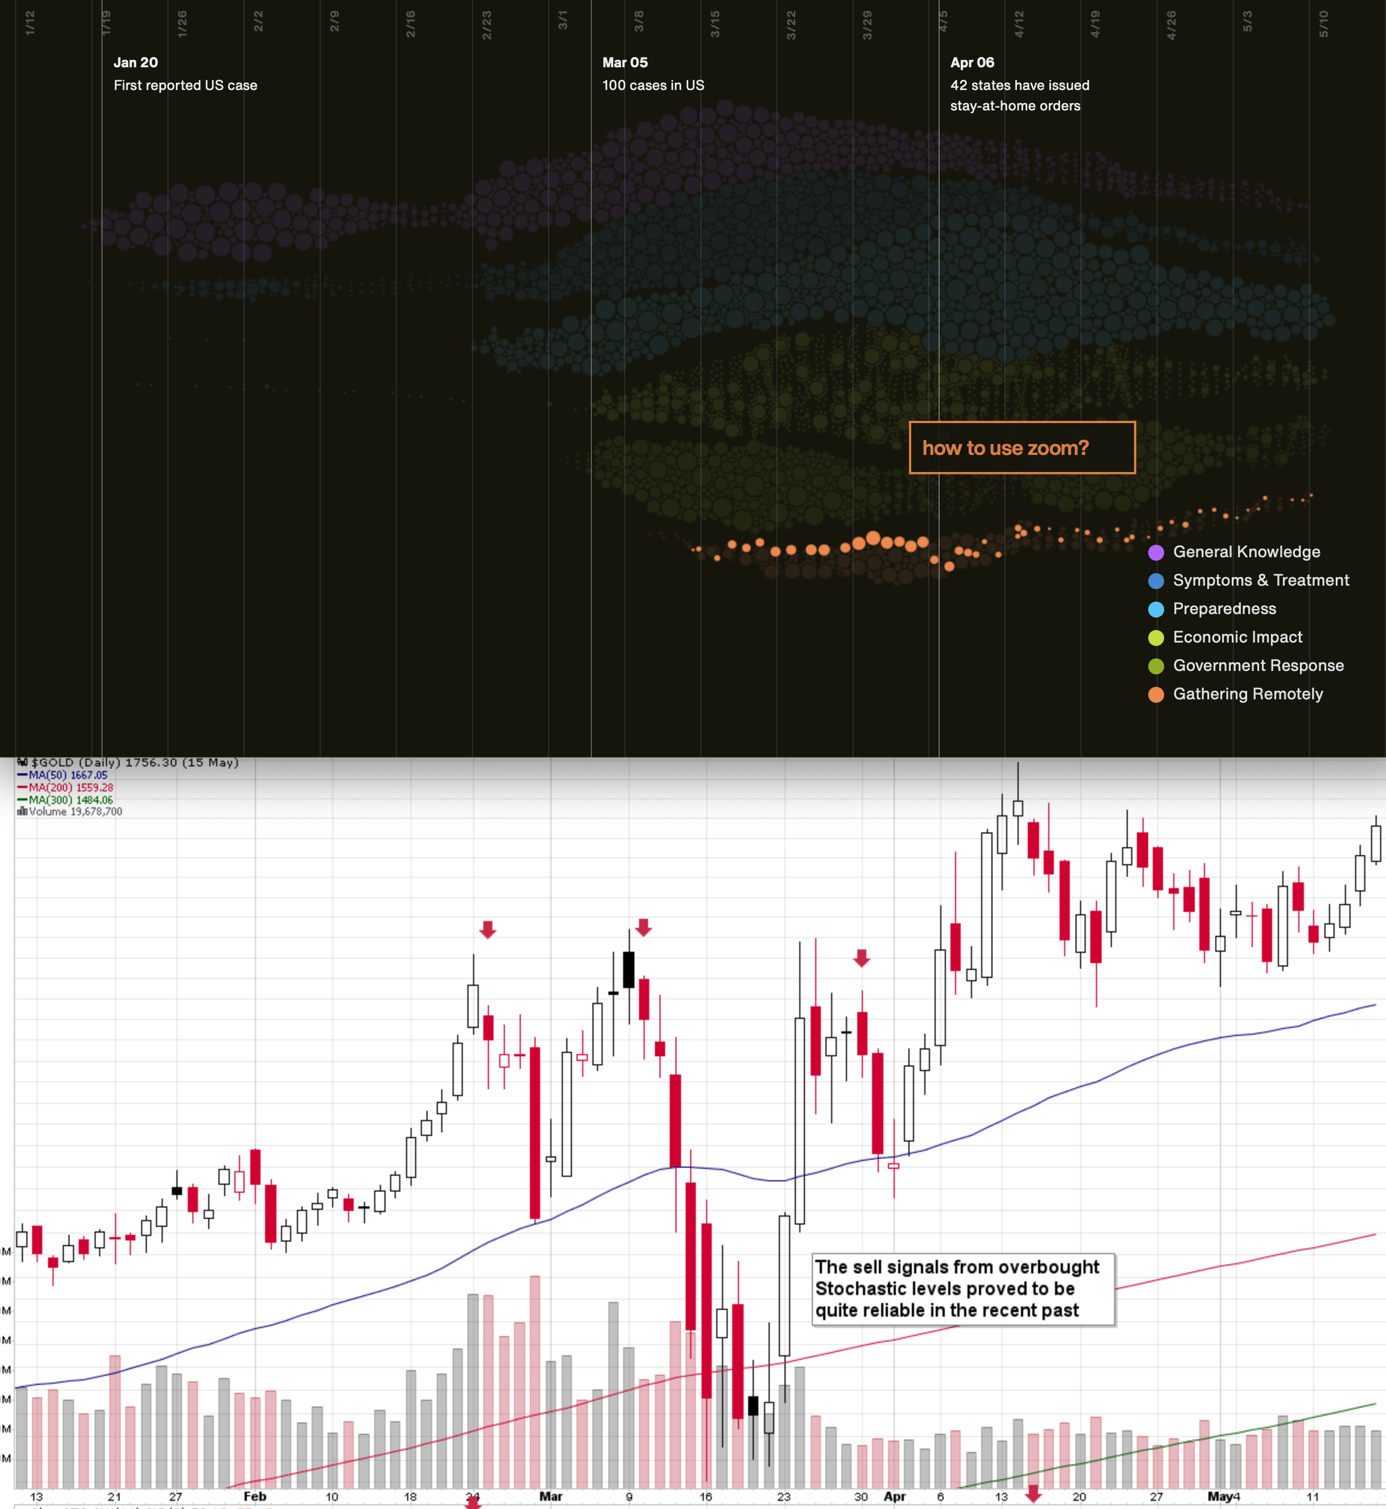
We aligned both charts with regard to time. The chart on the bottom is from Stockcharts.com and it features gold's continuous futures contract. The gold price (and the USD Index value) really started to move once people got particularly interested in the economic impact of the pandemic and in the government's response.
In recent days (and weeks) the news is dominated by other issues. Once people start considering the economic implications of the second wave of this coronavirus, the prices would be likely to move.
The news coming from the Fed is positive for gold in the long run, but in the short term, they continue to indicate risk for the economy. This risk is likely to translate into lower stock values and initially gold is likely to slide given the above - just like it did in March.
All in all, gold is likely to rally far in the long run, but in the short run it’s vulnerable to a sizable decline, when the economic implications of the pandemic’s continuation become obvious to investors.
Stocks and the Dollar Weigh In
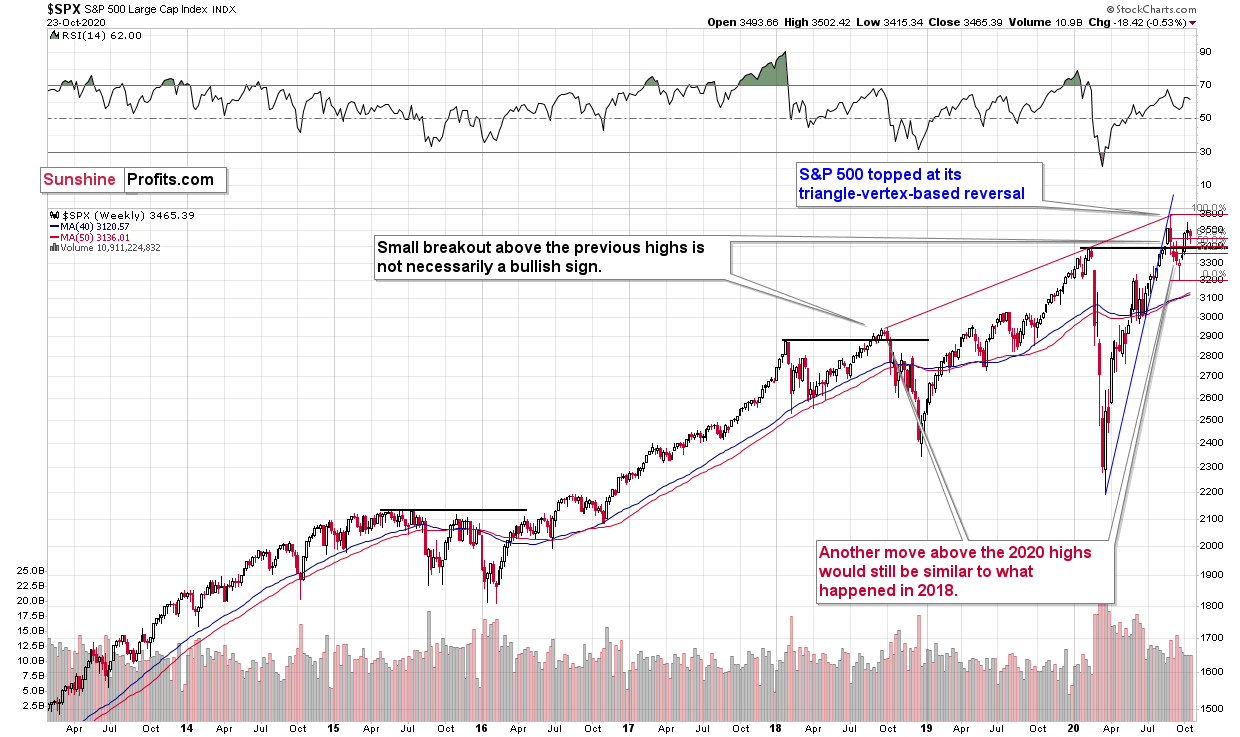
The big news of the previous weeks was that the general stock market managed to move higher, despite the invalidation of the early-2020 high. This is something unusual for any market, as commonly invalidations of breakouts or breakouts are strong indications that the market is going to move in the opposite way. The invalidation of the breakout was therefore a strongly bearish sign.
So, what happened? Well, it could have been the case that the nothing-bad-will-happen-before-the-elections rule applied, and the rally was more orchestrated than natural. By that we mean that some powerful investors bought enough to trigger the rebound. And let’s keep in mind that the Fed pledged to play an active role right now – even more so than it did in 2008.
What does it mean going forward? It means that the slide could be delayed, but I don’t expect it to be averted entirely. After all, no market can be “triggered artificially”, “supported”, “set”, or “manipulated” for longer periods (of course, except the interest rates), and despite the massive money printing, the economy is not doing great. And that’s an obvious understatement.
From the technical point of view, we would like to point out three things:
- Stocks have corrected more than 61.8% of the recent decline, so they could move higher in the short term. That’s not something certain, though.
- In 2018 we saw a tiny invalidation of the breakout, then another move higher (slightly above the previous highs), and stocks plunged shortly thereafter.
- In early 2020, the very initial decline was relatively small, and it was followed by another move higher (slightly above the previous high). Stocks plunged shortly thereafter.
Consequently, in analogy to two most similar situations to the current one from the recent past, it wouldn’t be surprising to see stocks move to or even slightly above the previous highs, before they turn south in a spectacular way. It is especially true that it's just before the U.S. elections – the "plunge protection team" might prevent any severe declines for the next week.
This could mean a delay in precious metals’ and miners’ decline as well. Again, a decline, not its absence. Especially that the situation continues to be excessive on the forex market.
Remember when in early 2018 we wrote that the USD Index was bottoming due to a very powerful combination of support levels? Practically nobody wanted to read that as everyone “knew” that the USD Index is going to fall below 80. We were notified that people were hating on us in some blog comments for disclosing our opinion - that the USD Index was bottoming, and gold was topping. People were very unhappy with us writing that day after day, even though the USD Index refused to soar, and gold was not declining.
Well, it’s exactly the same right now.
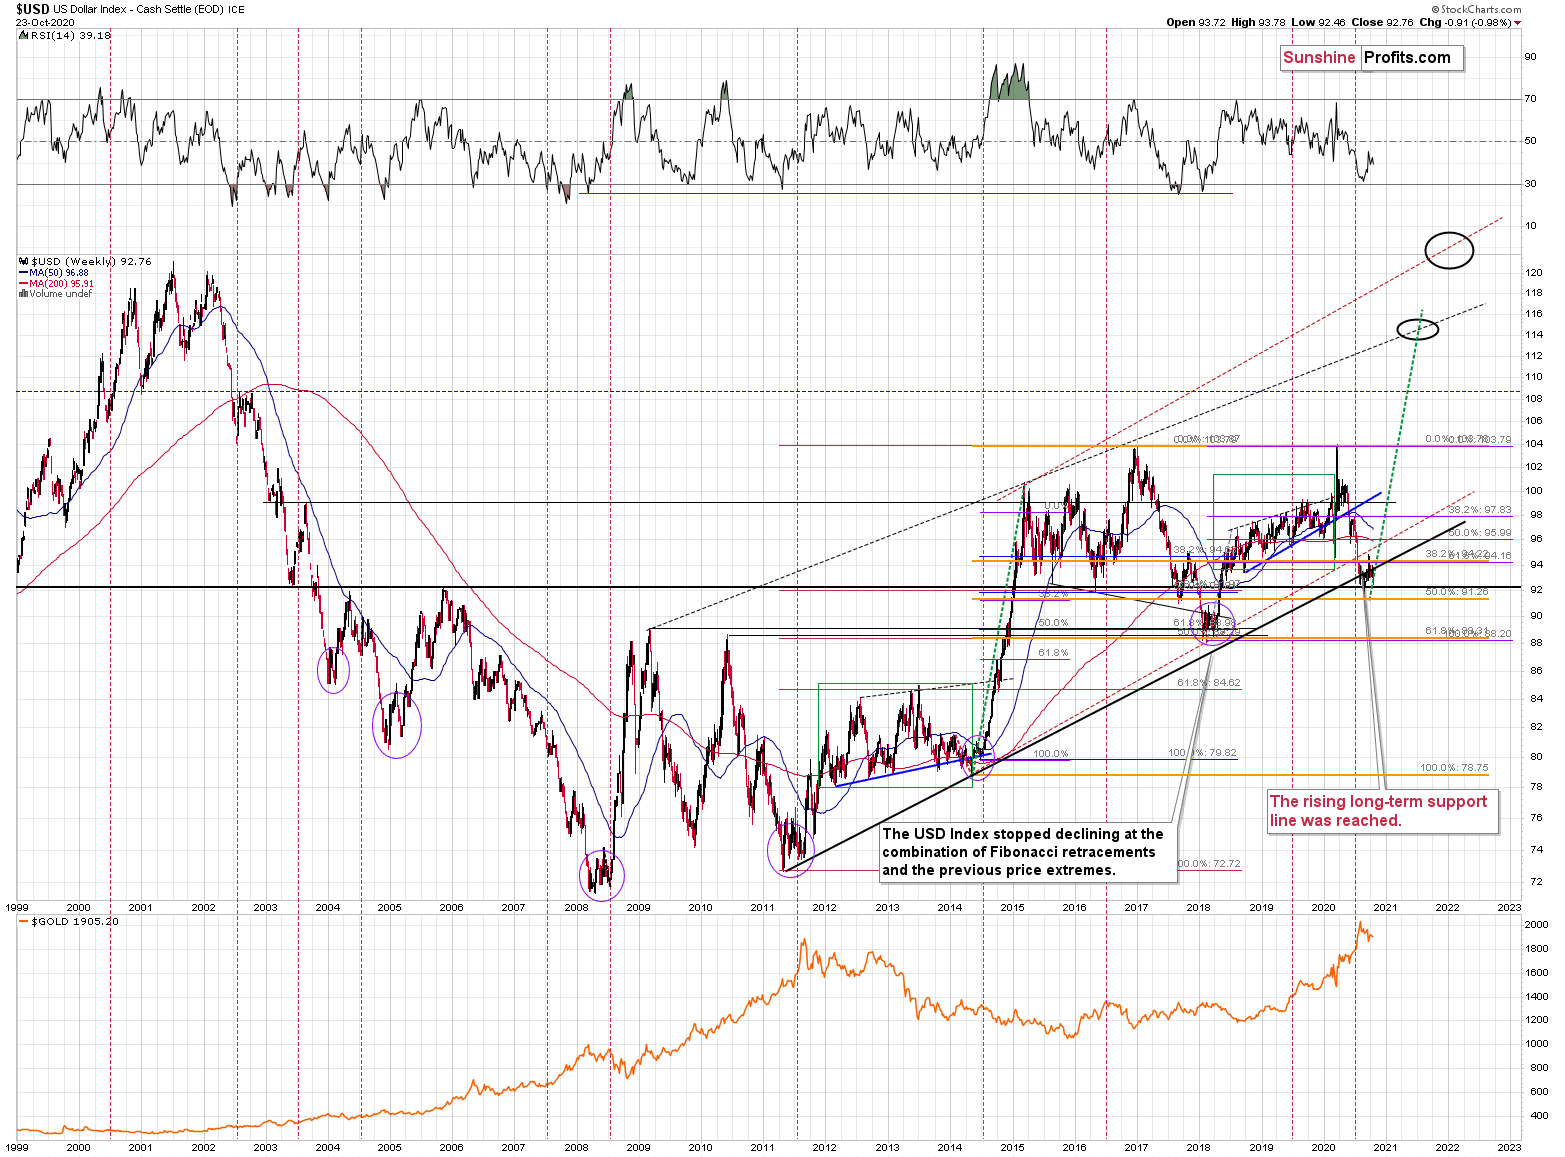
The USD Index was at a powerful combination of support levels. One of them is the rising, long-term, black support line based on the 2011 and 2014 bottoms. The other major support level and a long-term factor is the proximity to the 92 level – that’s when gold topped in 2004, 2005, and where it – approximately – bottomed in 2015, and 2016.
The USDX just moved to these profound support levels, broke slightly below them, and now it has clearly invalidated this breakdown. For many weeks, we’ve been warning about the likely USD Index rally, and we finally saw it.
Quoting my previous comments:
USD Index moved briefly below the long-term, black support line and then it invalidated this breakdown before the end of the week. This is a very bullish indication for the next few weeks.
Based on the most recent price moves, the USDX is once again below the above-mentioned strong rising support line, but we doubt that this breakdown would hold. We expect to see an invalidation thereof that is followed by a rally.
Before moving to the short-term chart, please note that the major bottoms in the USD Index that formed in the middle of the previous years often took the form of broad bottoms.
Consequently, the current back and forth trading is not that surprising. This includes the 2008, 2011, and 2018 bottoms.
A crucial aspect is that the rally that we’ve witnessed so far is just the tip of the bullish iceberg. The breakdown below the key support levels was invalidated, which is a strong bullish indicator. Since it happened on a long-term chart and the temporarily broken lines were critical, the implications are incredibly important as well– and they should be visible from the long-term perspective.
So, how high could the USD Index rally now? At least to the 100 level (approximately). This way, the upcoming rally would almost match the rally that started after the previous major invalidation – the 2018 one.
Still, we wouldn’t rule out a scenario in which the USD Index rallies above its 2020 highs before another major top. After all, the USD Index is after a very long-term breakout that was already verified several times.
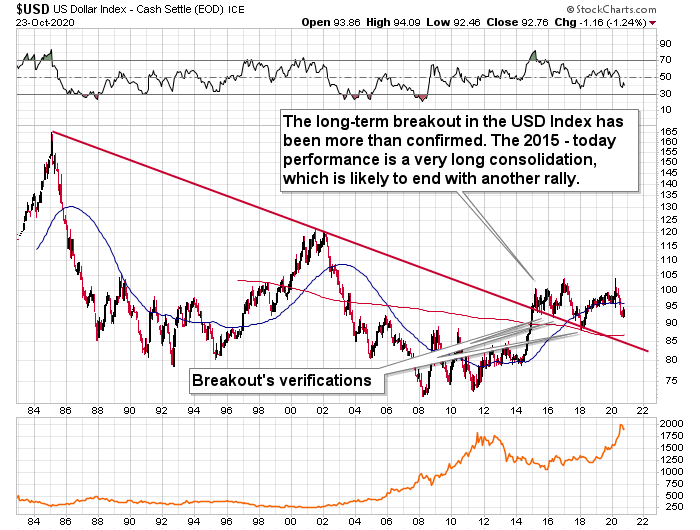
Taking into account USDX’s lengthy breakout, its several breakout verifications, and the 5-year consolidation, it seems that the USD Index is ready to rally much higher – perhaps to approximately to the 120 level.
Please note that the consolidation that preceded the previous rally to 120 that took place between 1997 and 2000 happened when the USD index was trading at relatively similar price levels – approximately between 90 and 105.
The short or medium-term target for the USDX is relatively unclear right now, and it’s very oversold on a short-term basis. It all happened in the middle of the year, which is when on many occasions, the USDX formed major bottoms. This makes a short-term rally here very likely.
The short-term USD Index chart is not as important as the long-term one, but let’s take a look at it anyway.
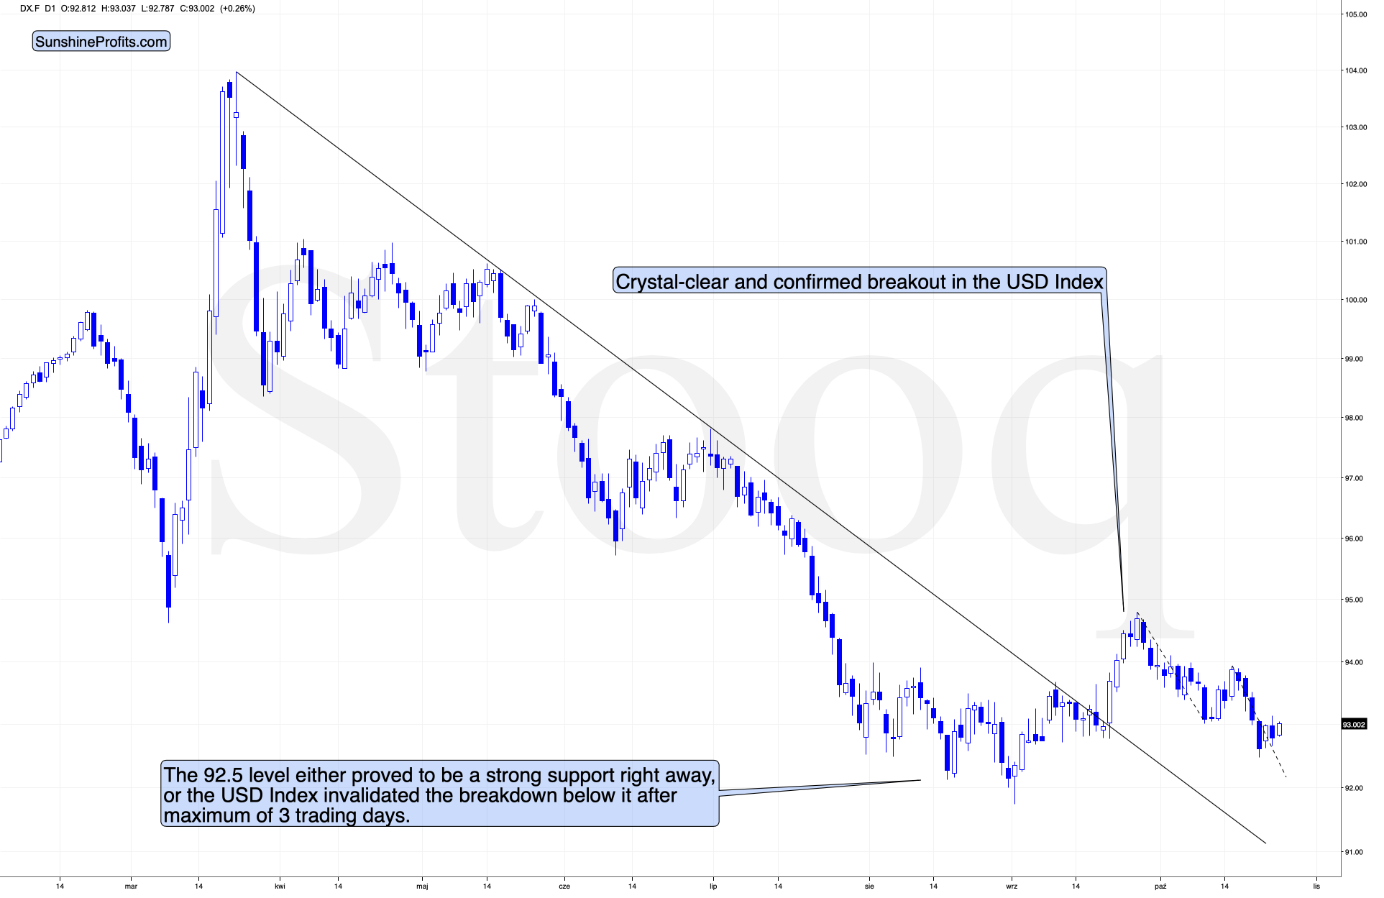
On Thursday, we commented on the above chart in the following manner:
The USD Index might have already bottomed, or it might not have bottomed at all. Before dismissing the above sentence as non-informative, let us add that even if it didn’t bottom yet, it’s likely that it will bottom and reverse its course pretty soon.
And why is that? It’s because of the price level that it reached yesterday. Namely, it moved to about 92.5. Why would this be of any significance? Because earlier this year, the 92.5 level either proved to be robust support right away or the USD Index invalidated the breakdown below it after a maximum of 3 trading days.
The above remains up-to-date, except that based on the follow-up action (including today’s pre-market upswing), it’s a bit more likely that the bottom is already in (again, it’s not a sure bet).
At first sight, the USDX’s move higher in today’s pre-market trading is not that important. However, when one notices that this move higher also means invalidation of the breakdown below the previous October low, it suddenly does become important and bullish. When the situation is getting more bullish for the USDX, it means that it’s betting more bearish for the PMs as a result.
In short, what we just saw on a bigger scale is now visible on a smaller scale as well, and while the outlook for the USD Index is relatively unclear for the next few days, it remains bullish for the following weeks and months.
As the outlook remains bullish for the USD Index, it remains bearish for the precious metals sector. It is particularly the case if we consider that recently, the Gold Miners Bullish Percent Index showed the highest possible overbought reading.
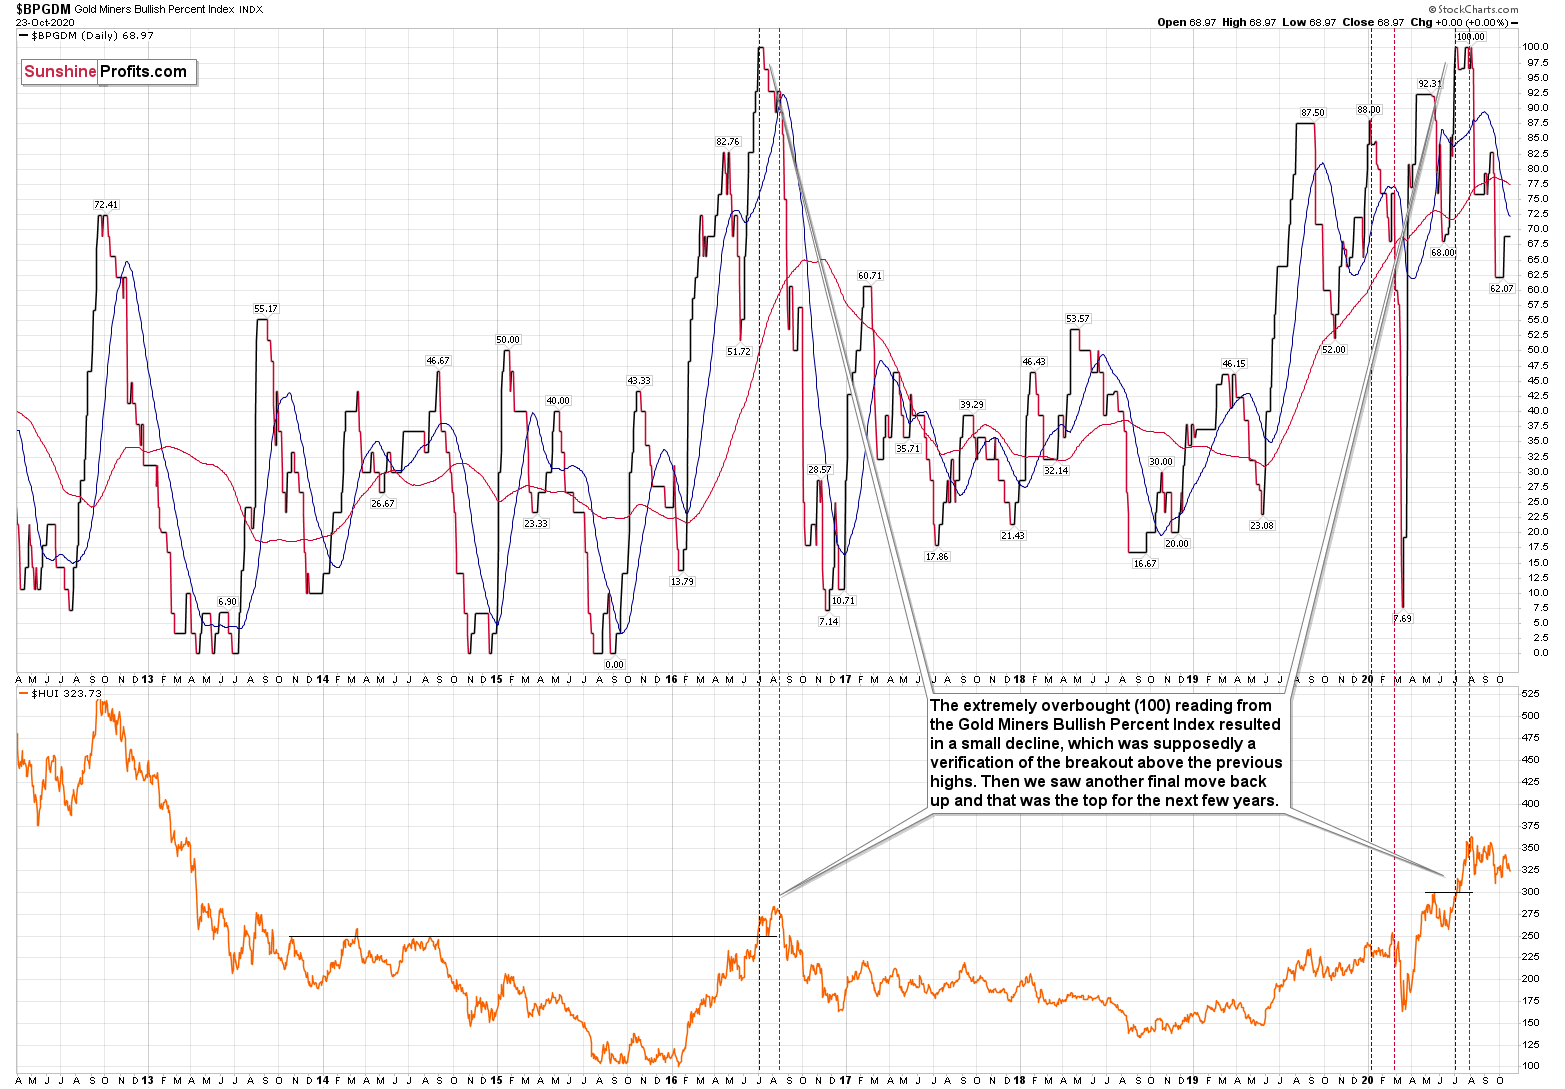
The excessive bullishness was present at the 2016 top as well and it didn’t cause the situation to be any less bearish in reality. All markets periodically get ahead of themselves regardless of how bullish the long-term outlook really is. Then, they correct. If the upswing was significant, the correction is also quite often significant.
Please note that back in 2016, there was an additional quick upswing before the slide and this additional upswing has caused the Gold Miners Bullish Percent Index to move up once again for a few days. It then declined once again. We saw something similar also this time. In this case, this move up took the index once again to the 100 level, while in 2016 this wasn’t the case. But still, the similarity remains present.
Back in 2016, when we saw this phenomenon, it was already after the top, and right before the big decline. Given the situation in the USD Index, it seems that we’re seeing the same thing also this time.
Please note that back in 2016, after the top, the buying opportunity didn’t present itself until the Gold Miners Bullish Percent Index was below 10. Currently, it’s above 60, so it seems that miners have a long way to go before they bottom (perhaps a few months – in analogy to how gold declined in 2016).
Nine weeks ago, we’ve commented on the chart above in the following manner:
Now, since the general stock market moved above the previous highs and continues to rally, we might or might not see a sizable decline early this week. Back in March, the slide in miners corresponded to the decline in the general stock market, and this could be repeated, or we could see some sideways trading after the slide resumes, once stocks finally decline.
That’s exactly what happened. The general stock market continued to move higher, and mining stocks have been trading sideways instead of declining – or rallying. Before miners’ pause (and S&P’s breakout) miners were repeating their late-February and early-March performance. The implications of the self-similar pattern were bearish, and they continue to be bearish, only the timing changed.
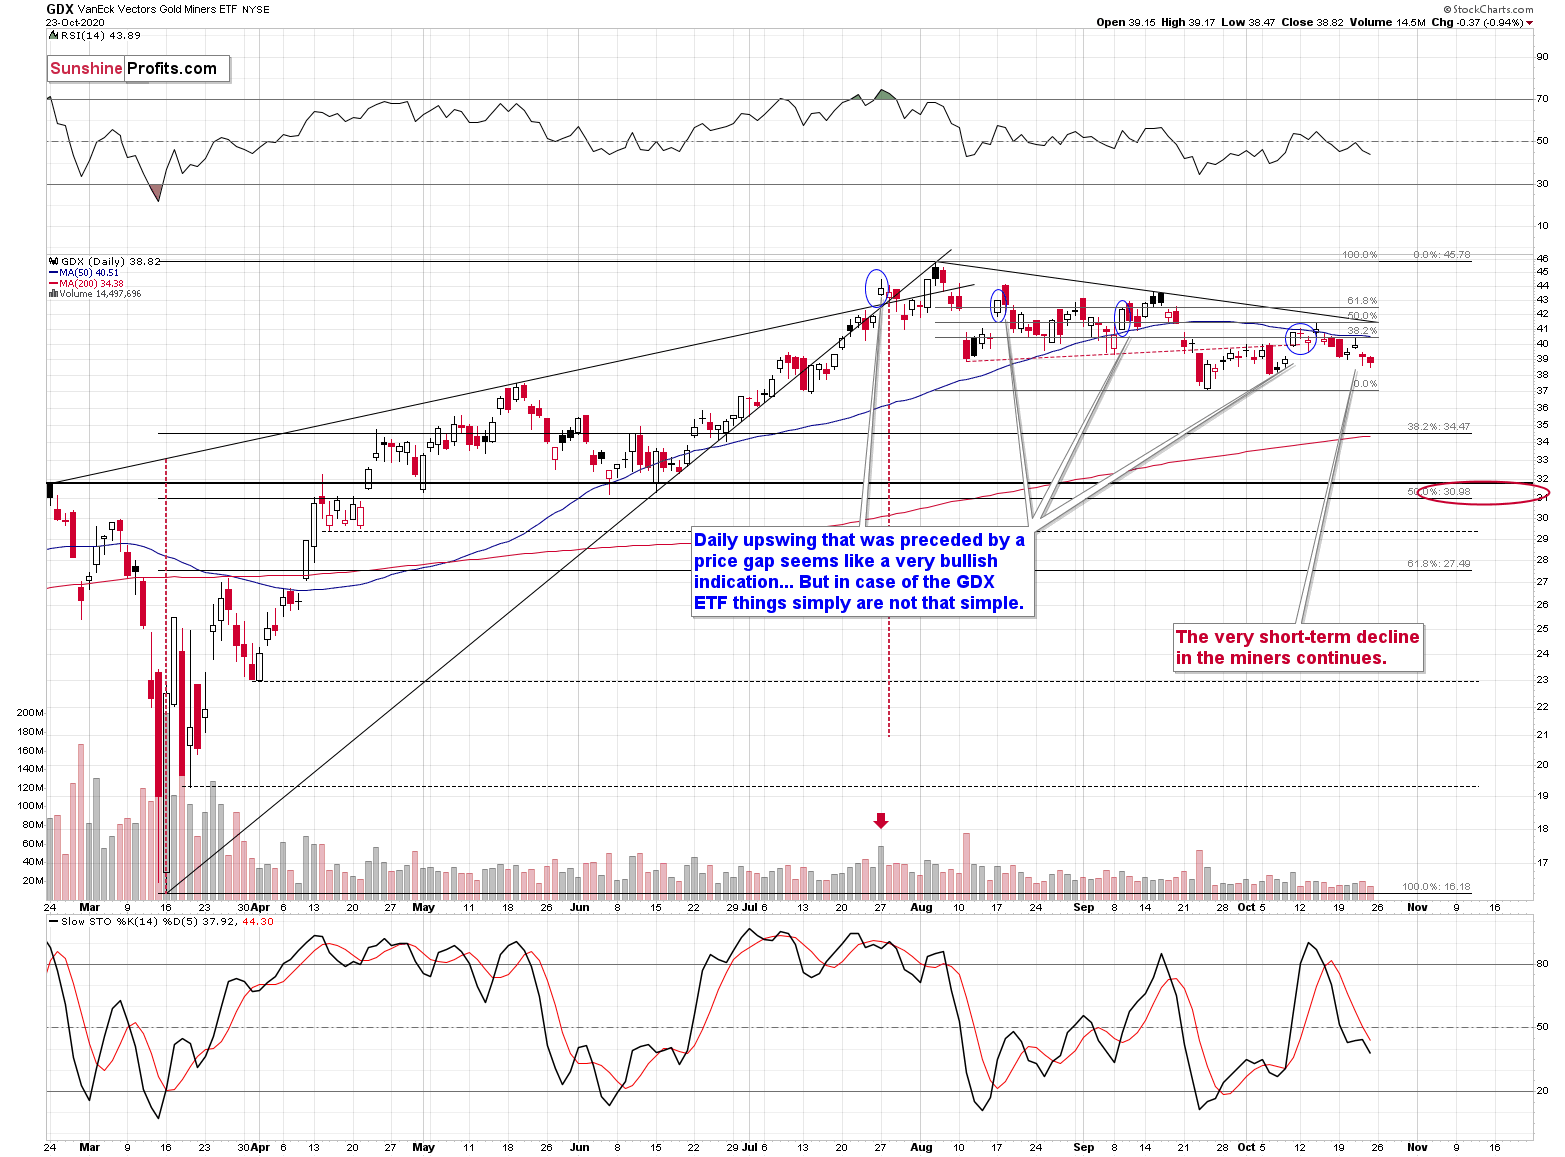
Last week, the GDX ended visibly below the previous Friday’s close. It is in perfect tune with what happened after the earlier situations we’ve marked with blue ellipses.
Exactly two weeks ago, we’ve emphasized the following:
“The GDX moved higher on Friday, invalidating the breakdown below the red resistance line. Naturally, this is a bullish sign, but before saying that the situation become bullish, let’s consider what followed similar – seemingly very bullish – price moves that we saw recently (July 27, August 17, September 9). That was either the end of the rally or it meant that the vast majority of the rally was already over. Consequently, it was not the time to be going long, but rather to be going short. In fact, Friday’s closing price was below all above-mentioned sessions’ closing prices. Interestingly, each case had a lower daily close than the preceding case.
Moreover, please note that while stocks corrected more than 61.8% of their recent decline, the GDX ETF corrected only a bit more than 38.2% of the move. So, even if the general stock market moves to or slightly above its previous 2020 highs, it doesn’t mean that the same would be likely for gold miners. The decline of the latter would likely be delayed in this case, though.”
Indeed, it seems that as of September 9th, most of the rally was already over. What we witnessed in the days that followed that session, was a relatively insignificant move higher that was then followed by a decline. The situation seems much like what happened in early August and mid-September – the GDX ETF moved slightly higher, only to stop there.
At the same time, miners moved slightly above their 50-day moving average, and then declined back below it. Back in March, miners moved slightly above their 50-day moving average only to plunge shortly after that.
Moreover, if the situation wasn’t bearish enough due to the above, the Stochastic indicator based on the GDX ETF is still on a sell signal.
Also, let’s not forget that the GDX ETF has recently invalidated the breakout above the 61.8% Fibonacci retracement based on the 2011 – 2016 decline.
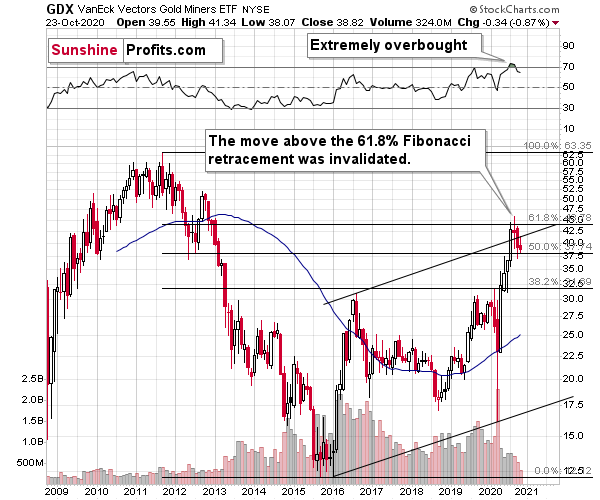
When GDX approached its 38.2% Fibonacci retracement, it declined sharply – it was right after the 2016 top. Are we seeing the 2020 top right now? This is quite possible – PMs are likely to decline after the sharp upswing, and since there are only several months left before the year ends, it might be the case that they move north of the recent highs only in 2021.
Either way, miners’ inability to move above the 61.8% Fibonacci retracement level and their invalidation of the tiny breakout is a bearish sign.
The same goes for miners’ inability to stay above the rising support line – the line that’s parallel to the line based on the 2016 and 2020 lows.
Let’s proceed to metals themselves.
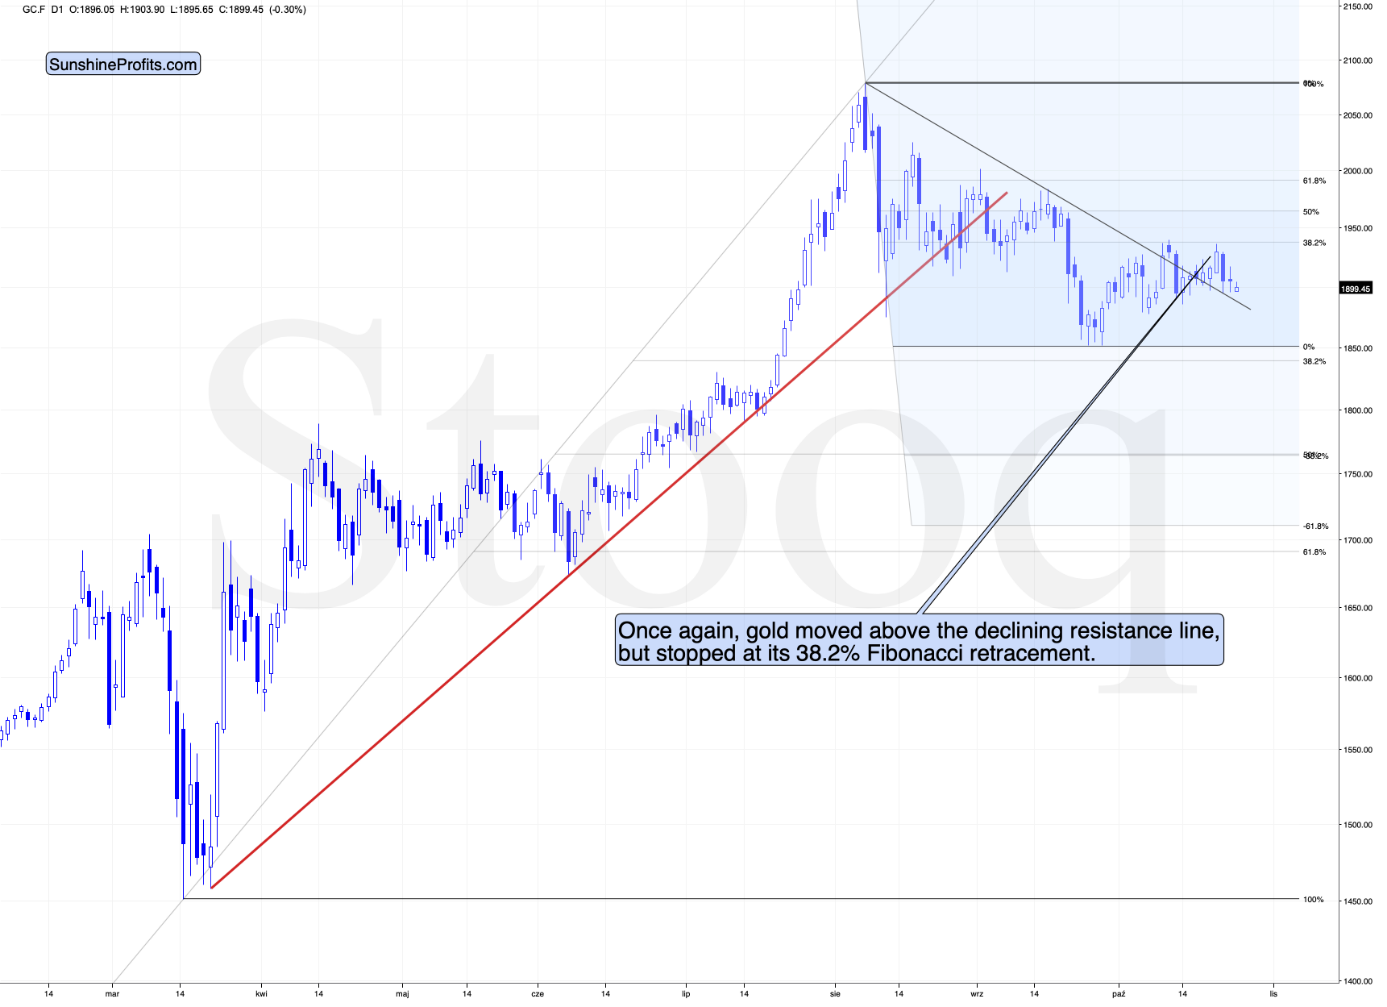
I previously wrote that gold moved above the declining resistance line but stopped at its 38.2% Fibonacci retracement. Consequently, I have emphasized that the move above the declining resistance line hasn’t been that significant to require confirmation.
But we did actually see this confirmation. Gold broke above the declining resistance line, and it then stopped at it during the decline. This seems bullish. But, as I explained previously, due to miners’ weakness, that is not precisely bullish, which accompanied the gold breakout.
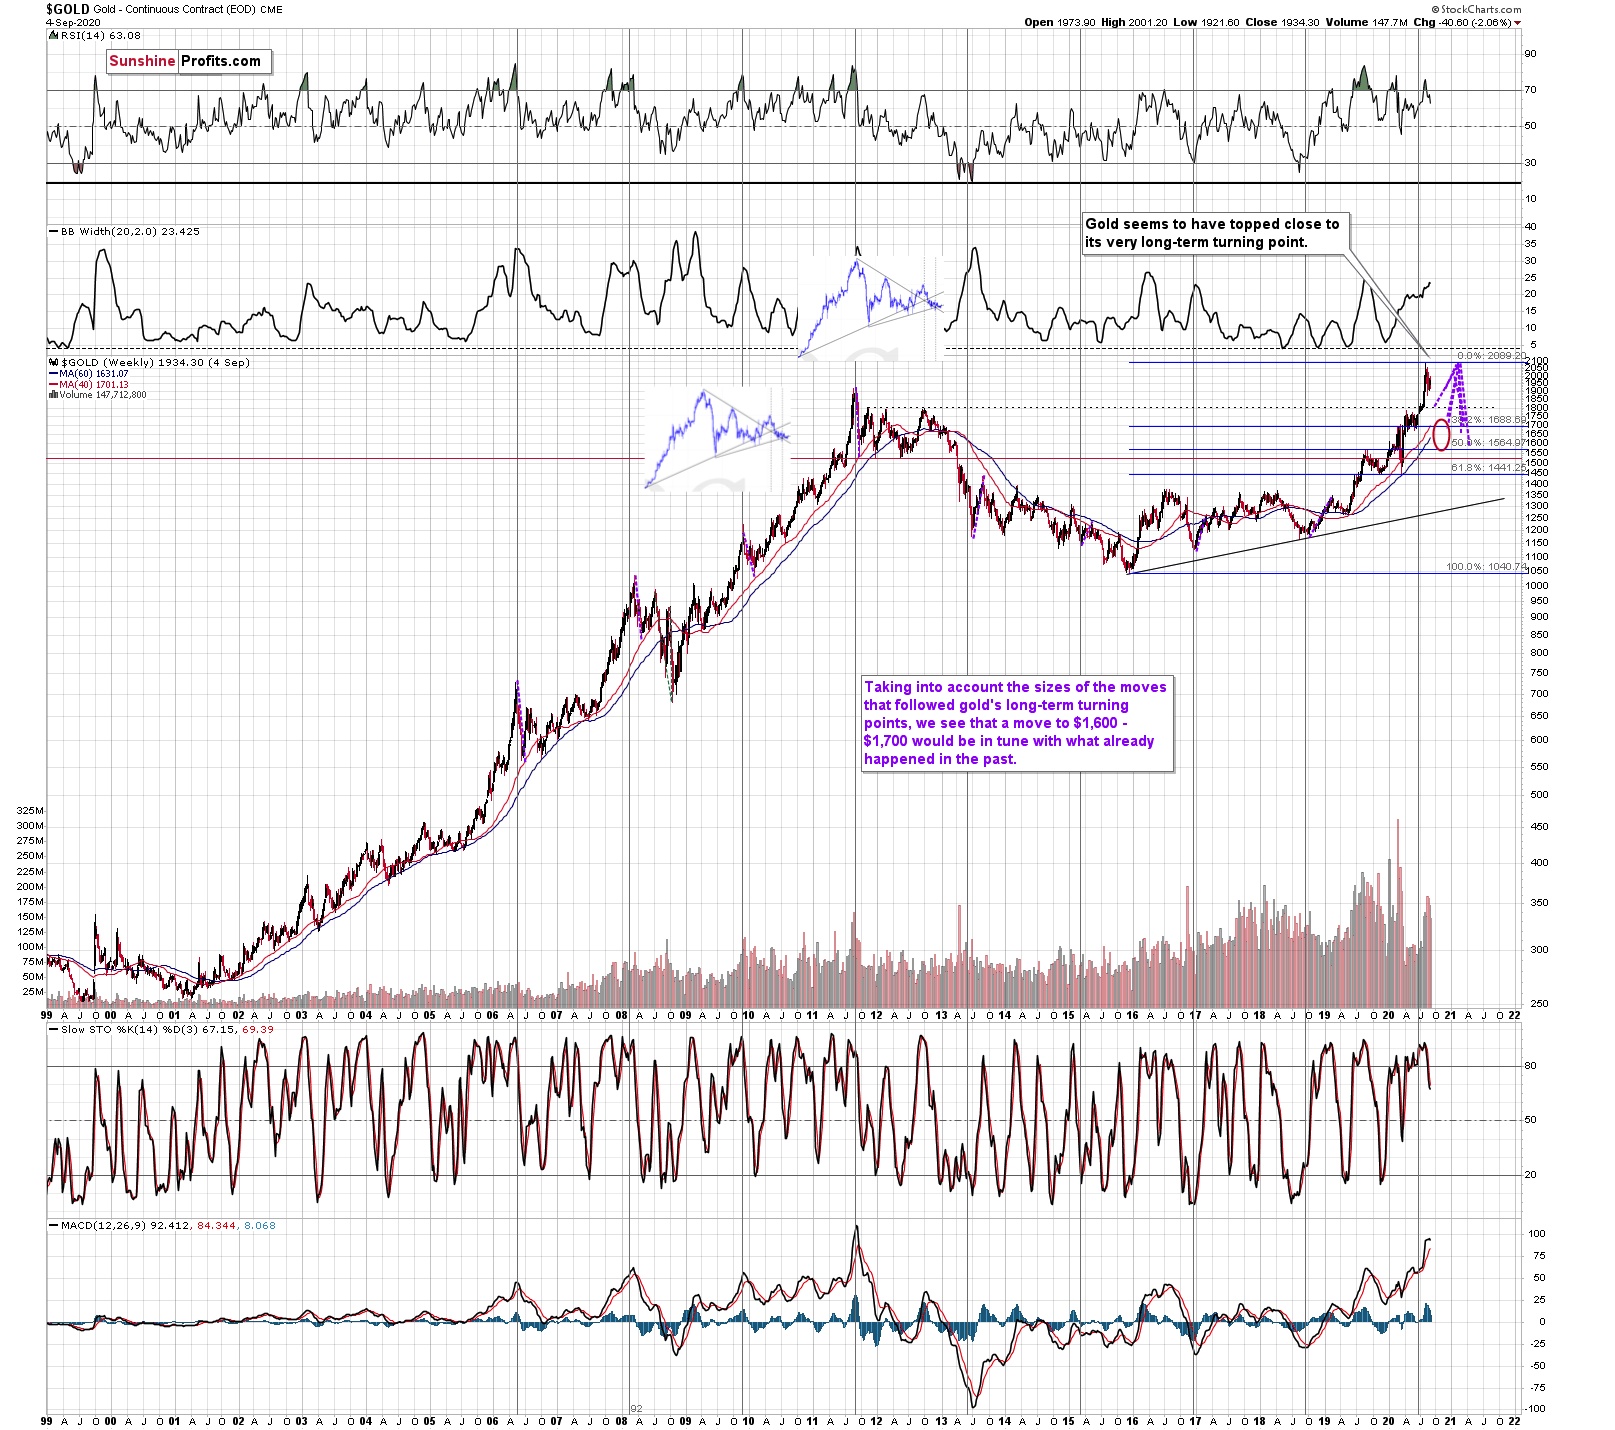
Before bringing your attention toward the GLD ETF chart, we would like to stress that according to the chart above, the likely downside target for gold is at about $1,700, predicated on the previous lows and the 61.8% Fibonacci retracement, based on the recent 2020 rally.
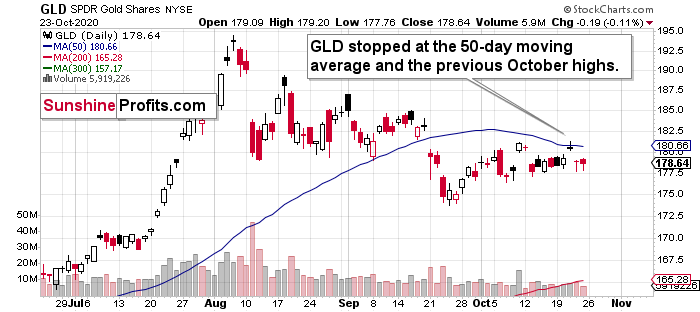
Having said that, please note that the chart above shows us that another proxy for gold - the GLD ETF - has just tested its October highs and its 50-day moving average, proving to be a strong resistance. Back in early September, this MA served as a support, and when it was finally breaking in mid-September, it was then followed by a quite visible decline. Right now, this makes it quite a potent resistance, and it’s not surprising that gold declined after reaching it.
Additionally, please also take into account that the GLD bounces off relatively similar price levels. In August and early September, the 180-level and its surrounding served as support, and subsequently – in October – it served as resistance. There’s a good reason why that’s the case.
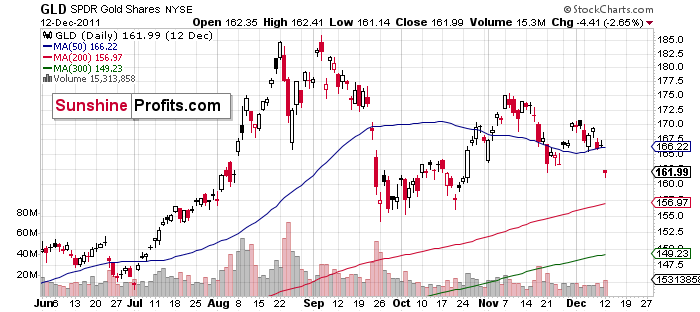
Namely, these are the levels that stopped GLD’s rally back in 2011. This is where we saw the ultimate top. It formed a bit north of $180, but the overall area remains the same.
And what are the implications for the current situation because of it? That the resistance that gold and GLD just reached is stronger than it appears at first sight.
Currently, gold is trying to climb back above its 2011 highs, and the attempt is not a successful one for now. Even at the moment of writing these words, gold futures are trading below their 2011 high.
So, gold just tried to move above its previous long-term high, failing to do so. Since history tends to repeat itself, it’s only natural to expect gold to behave as it did during its previous attempt to break above its major long-term high.
And the only similar case is from late 1978 when gold rallied above the previous 1974 high. Let’s take a look at the chart below for details (courtesy of chartsrus.com)
As you can see above, in late 1978, gold declined severely right after it moved above the late-1974 high. This time, gold invalidated the breakout, which makes the subsequent decline more likely. And how far did gold decline back in 1978? It declined by about $50, which is about 20% of the starting price. If gold was to drop 20% from its 2020 high, it would slide from $2,089 to about $1,671.
This is in perfect tune with what we described previously as the downside target while describing gold’s long-term charts:
The chart above shows exactly why the $1,700 level is even more likely to trigger a rebound in gold, at the very minimum.
The $1,700 level is additionally confirmed by the 38.2% Fibonacci retracement based on the entire 2015 – 2020 rally.
There’s also possibility that gold would decline to the $1,500 - $1,600 area or so (50% Fibonacci retracement and the price level to which gold declined initially in 2011), but based on the size of the recent upswing, we no longer think that this scenario is the most likely one.
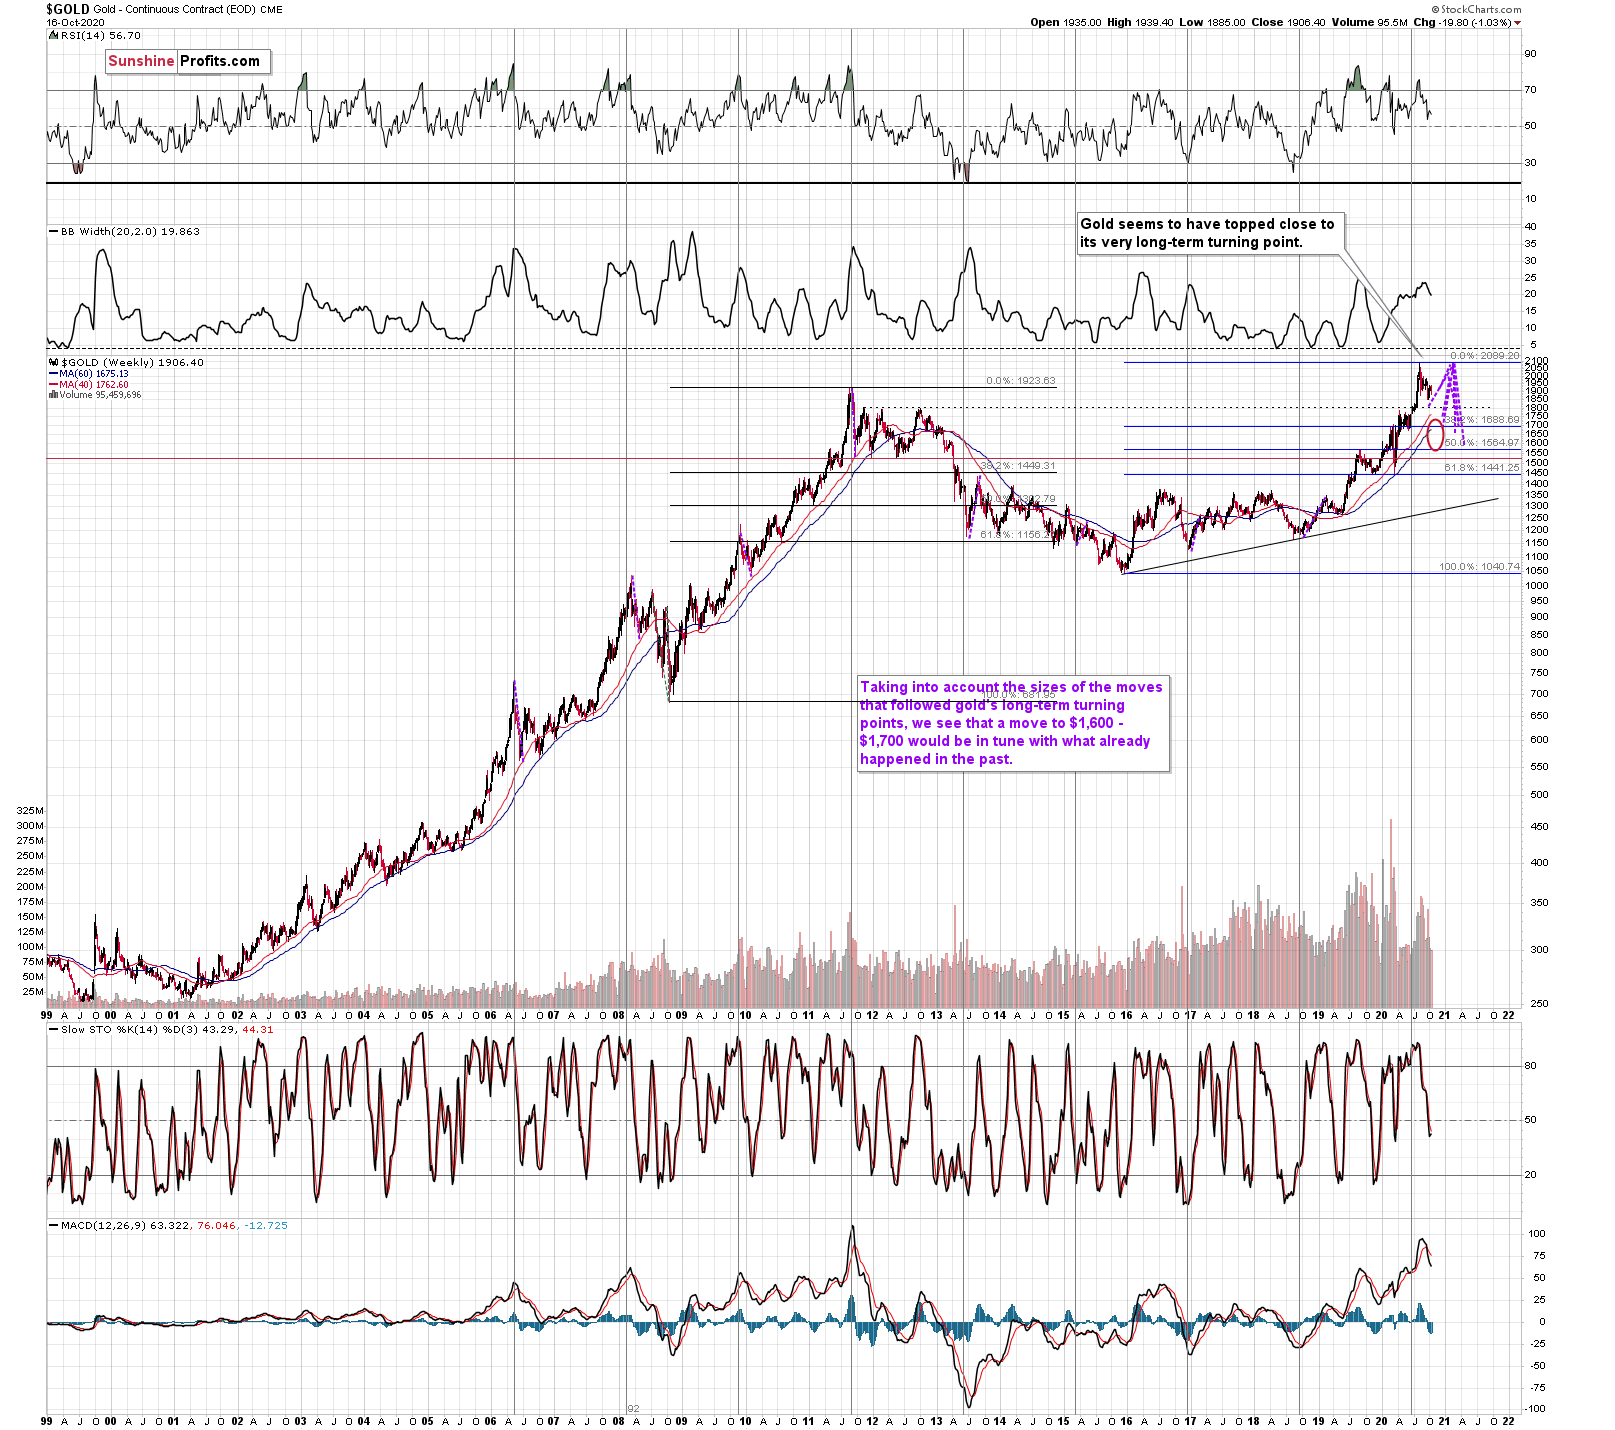
Gold’s is (from the long-term point of view) after its very long-term turning point, and since the most recent move has been to the upside, its implications are bearish.
We used the purple lines to mark the previous price moves that followed gold's long-term turning points, and we copied them to the current situation. We copied both the rallies and declines, which is why it seems that some moves would suggest that gold moves back in time - the point is to show how important the turning point is in general.
Based on the information that we have available right now, it seems likely that gold will bottom close to the $1,700 level. That’s very much in tune with how much gold moved after the previous long-term turning points.
Speaking of upside targets, eight weeks ago, we wrote:
Based on gold's Fibonacci extensions and the previous major highs and lows (the 2018 high and late-2019 low along with the 2020 low), we get a nearby upside target of $2085. At the moment of writing these words, gold is trading at $2044. Given this week's volatility, it could even be a matter of hours before gold reaches the above-mentioned target and reverses. Taking closing prices into account, gold is up by $35, so if it reverses significantly, we would be likely to see a powerful weekly reversal candlestick and one that causes gold to decline in the following weeks.
That’s more or less what happened. Gold topped at $2,089.20. It then declined quite visibly and closed last week at about $1,950.
Do you get the feeling that you have already seen gold perform this way before? Because you did.
The history rhymes, but this time, the similarity is quite shocking.
We copied the short-term chart and pasted it on the long-term chart above and next to the 2011 top. We pasted it twice, so that you can easily compare gold’s performance in both cases in terms of both: price and time.
They are very similar to say the least. Yes, these patterns happened over different periods, but this doesn’t matter. Markets are self-similar, which is why you can see similar short-term trends and long-term trends (with regard to their shapes). Consequently, comparing patterns of similar shape makes sense even if they form over different timeframes.
After a sharp rally, gold declined quickly. Then we saw a rebound, and a move back to the previous low. Then, after a bit longer time, gold moved close to the most recent high and started its final decline. This decline was less volatile than the initial slide. That’s what happened when gold topped in 2011 (and in the following years), and that’s what happened also this year. Ok, after the initial decline from the 2011 top, we saw two initial reactive rallies and in 2020 there was just one, but it didn’t change the similarity with regard to time.
The patterns of this level of similarity are rare, and when they do finally take place, they tend to be remarkably precise with regard to the follow-up action.
What is likely to follow based on this pattern, is that we’re likely to see the end of the slower decline, which will be followed by a big and sharp decline – similarly to what we saw in 2013.
How low could gold slide based on this similarity? Back in 2013, gold declined approximately to the 61.8% Fibonacci retracement based on the preceding rally (the one that started in 2008), so that’s the natural target also this time.
And we already wrote about this particular retracement – it’s approximately at the $1,700 level. This has been our downside target for weeks, and it was just confirmed by this precise self-similar technique.
Another interesting point is that gold made an interim low close to the 50% retracement and the previous lows. Applying this to the current situation suggests that we could see a smaller rebound when gold moves to about $1,760 - $1,800.
This might be the moment to switch from short positions in the miners to short positions in silver. It’s too early to say for sure at this time, though.
As far as the white metal is concerned, on September 24th, we have warned you about the possible temporary rebound:
Silver is also after a major breakdown and it just moved slightly below the recent intraday lows, which could serve as short-term support. This support is not significant enough to trigger any major rally, but it could be enough to trigger a dead-cat bounce, especially if gold does the same thing.
That’s exactly what happened.
So, is the counter-trend rally over? That’s quite possible, particularly if we consider the USDX breakouts. However, given the possibility of a higher stock market moves, silver could move somewhat higher before it slides once again.
In early March, silver moved higher before truly plunging, so the current move up doesn’t invalidate this similarity, especially that the coronavirus cases are rising in a quite similar way (this similarity is most visible in Europe).
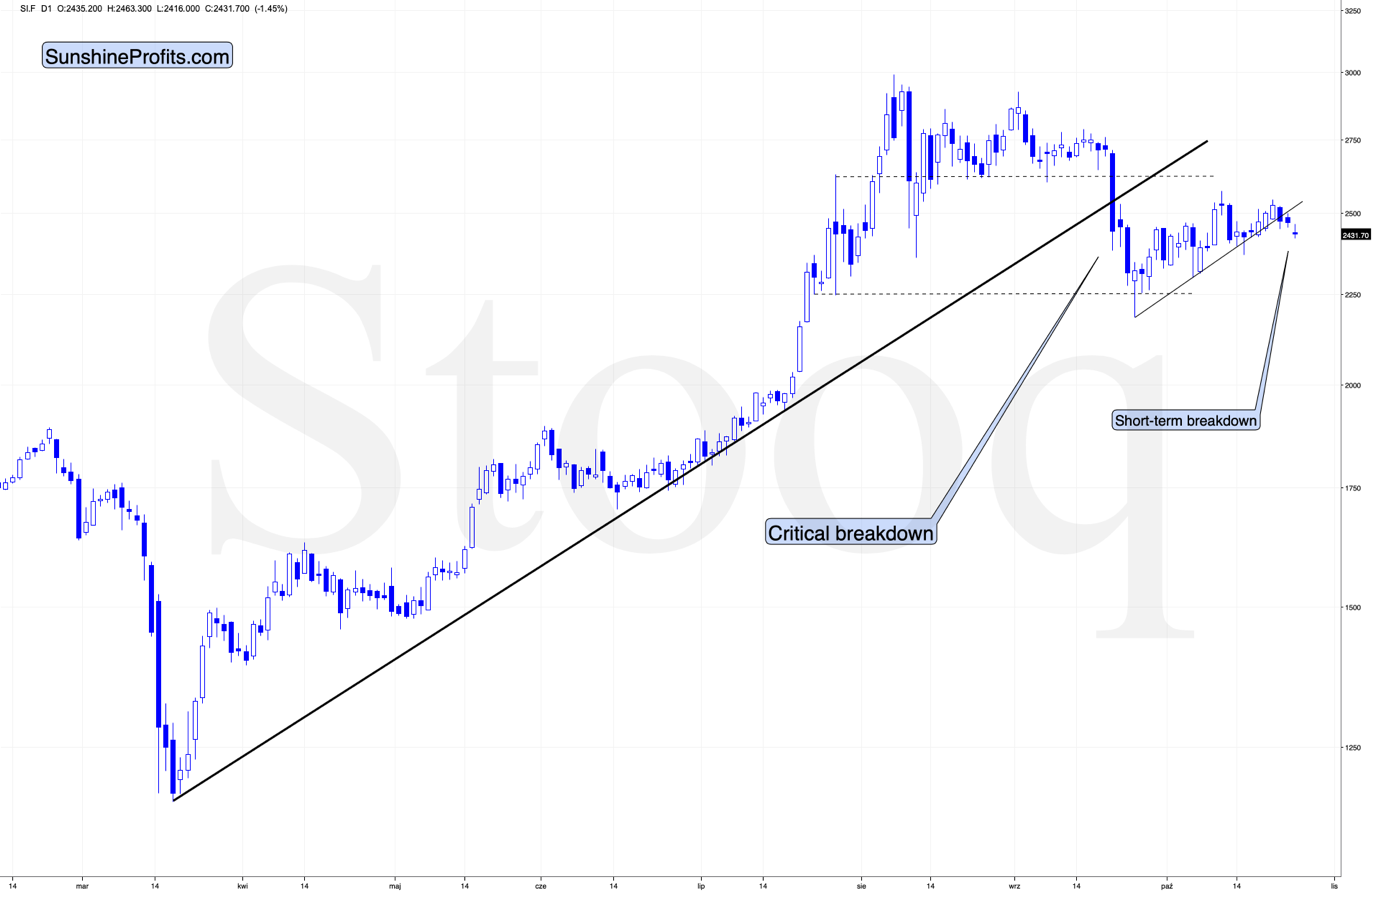
Technically, silver moved as high as it did on July 28th, on an intraday basis. The corrective rally is not as bit as one might think, while focused on just Friday's upswing. But that’s not the key thing here. The key thing is that the breakdown below the rising support line was more than confirmed.
At this point one might ask how do we know if that really just a dead-cat bounce, and not a beginning of a new strong upleg in the precious metals sector. The reply would be that while nobody can say anything for sure in any market, the dead-cat-bounce scenario is very likely because of multiple factors, and the clearest of them are the confirmed breakdowns in gold and silver, and – most importantly – the confirmed breakout in the USD Index.
Now, since silver has already broken below its rising short-term support line, the corrective upswing might already be over.
Moreover, please note that from the long-term point of view, silver is not that strong.
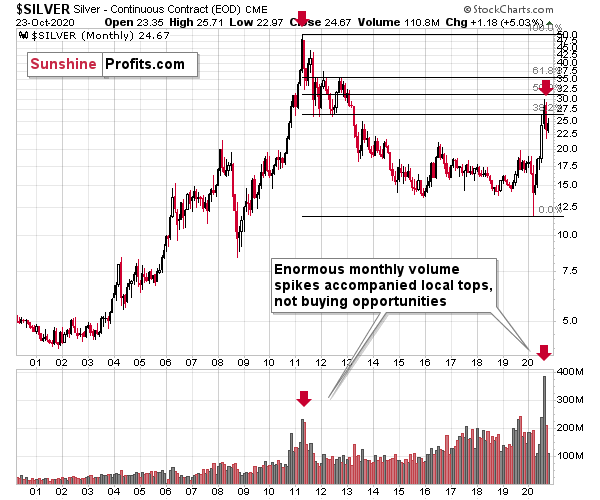
While gold moved to new highs, silver – despite its powerful short-term upswing – didn’t manage to correct more than half of its 2011 – 2020 decline.
In fact, silver has already invalidated its move above the lowest of the classic Fibonacci retracement levels (38.2%), which is not something that characterizes extraordinarily strong markets.
Silver is likely to move well above its 2011 highs, but it’s unlikely to do it without another sizable downswing first.
If you look at the monthly silver volume levels, it seems likely that the next sizable downswing has already begun. The previous substantial monthly volume in silver accompanied the 2011 top. The analogy doesn’t get more bearish than this. Ok, it would, if there were multiple key tops confirmed by huge monthly volume. But the 2011 top was so significant that other tops are not comparable, except for the most recent one. Thus, the implications are bearish.
We are witnessing something similar in the HUI Index as well. The latter corrected half of its 2011 – 2016 decline and nothing more, while gold moved well above its 2011 high.
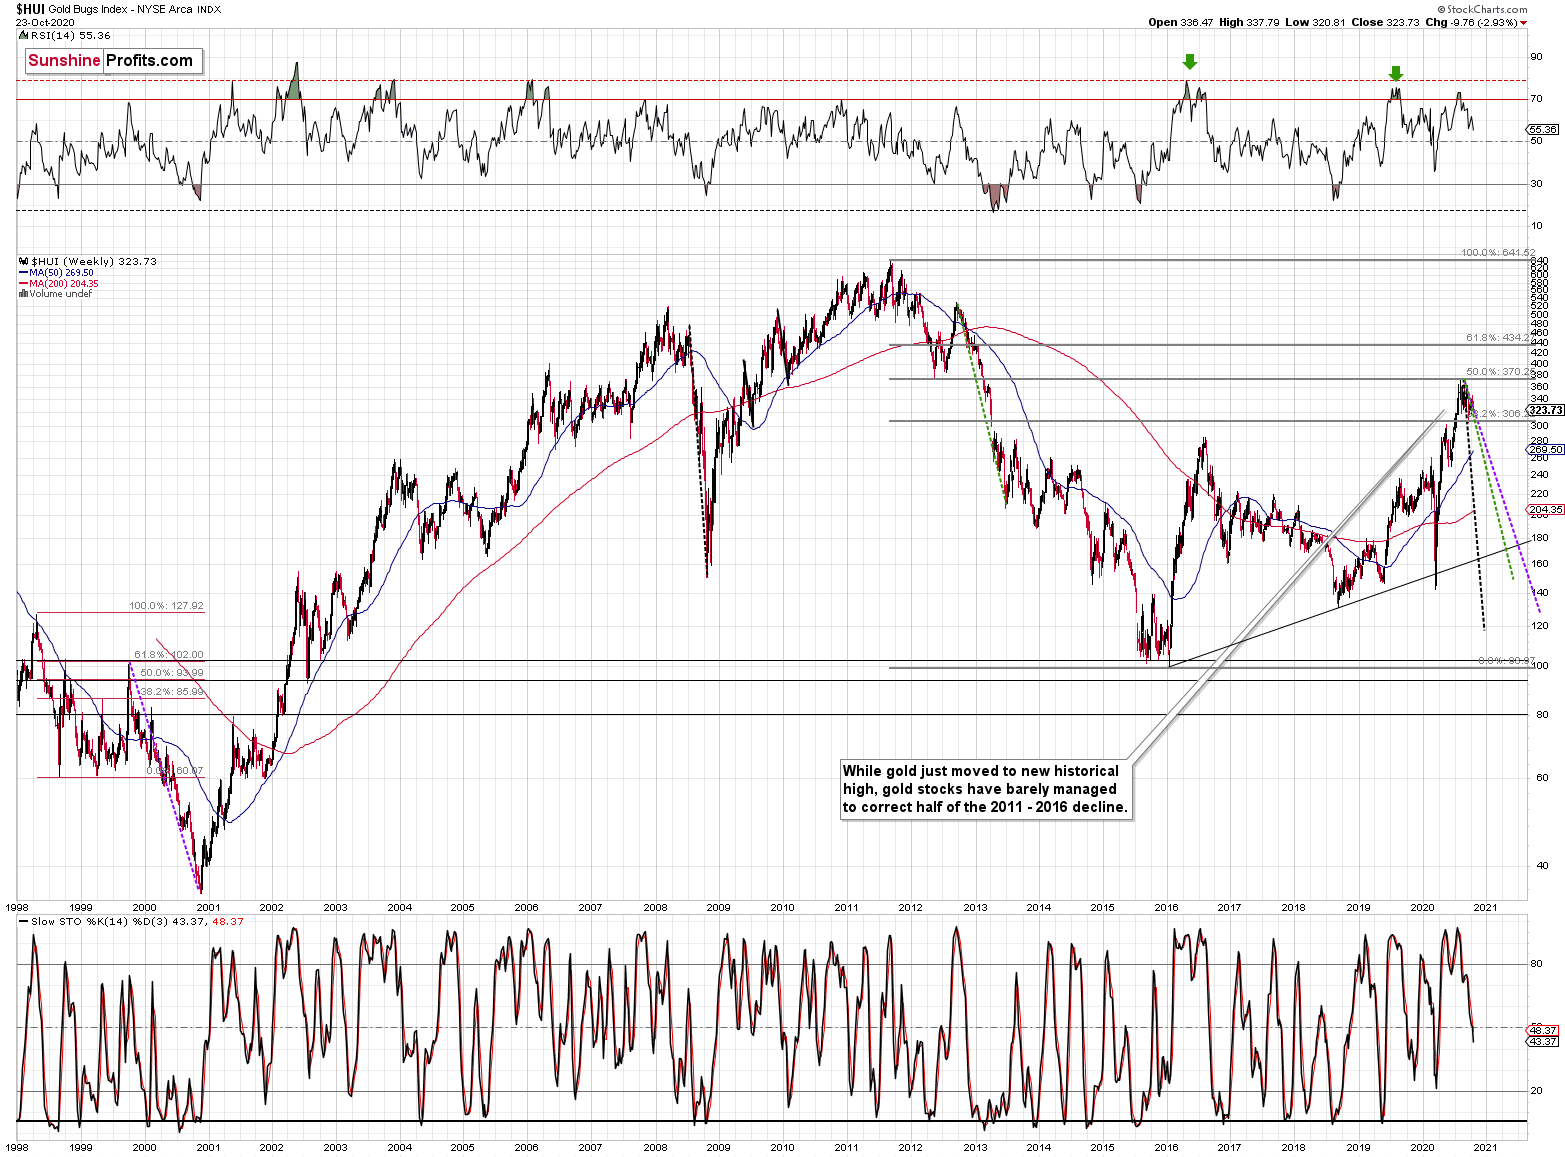
All in all, it’s mostly gold that is making the major gains – not the entire precious metals sector.
So, how can one determine the end of the gold price decline? At $1,700, it seems that it can go either up or down. Where does gold need to go to complete the pattern?
In reality, gold could rebound from $1,700, but it could just as well slide further, perhaps once again to the previous 2020 lows, especially if the USDX rallies to its 2020 highs.
So, how do we determine whether we see the buying opportunity or not?
We will view the price target levels as guidelines, and the same goes for the Gold Miners Bullish Percent Index (below 10), but the final confirmation will likely be something else. Something that we already saw in March when gold bottomed.
We will be on a special lookout for gold’s strength against the ongoing USDX rally. At many vital bottoms in gold, that’s exactly what happened, including what was the March bottom.
So far, the link between gold and the USD Index is strongly negative.
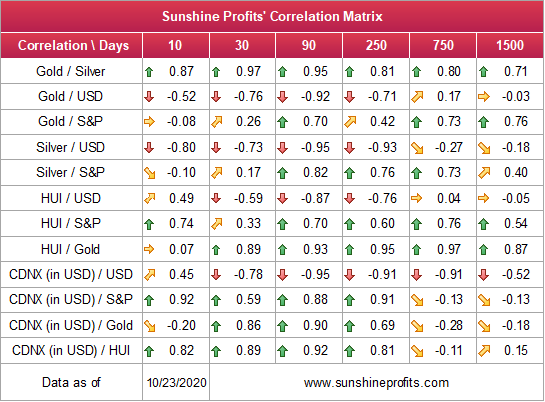
Since gold, silver, and mining stocks have been strongly negatively correlated with the USD Index in the short (30-day column) and medium term (90-day column), it seems likely that will continue to be negatively affected by the USDX upswing.
…Until we see the day where gold reverses or soars despite the U.S. currency’s rally.
If that happens with gold at about $1,700, we’ll have a very good chance that this was the final bottom. If it doesn’t happen at that time, or gold continues to slide despite USD’s pause or decline, we’ll know that gold has further to fall.
Naturally we’ll keep you – our subscribers – informed.
To move forward, how does the GDX downside target compare to the gold’s downside target? If, at the same time, gold moves to about $1,800 and miners are already after a ridiculously big drop (to $31-$32 in the GDX ETF, or lower), the binding profit-take exit price of your GDX ETF will become $32.02.
However, since gold is only at $1,800, with a GDX of $32, there’s more decline to be expected. Perhaps that exiting GDX is only for changing to shorts in silver? Is that the only instance when that’s the case, or could it also be with a GDX of $32 and a gold price of $1,700. What would be a GDX target for gold at a gold price of $1700 be?
It’s also not entirely clear whether you have up to six weeks until the lows arrive, instead of the end of the year.
Yes, we plan to exit the short positions in the mining stocks (GDX) and enter short position in silver. We don’t have an exact price at which we’ll do it (and it’s unclear if we’ll do it at all). We’re just describing what we’re going to do if a certain set of circumstances is met. If miners decline very profoundly, but silver declines only “normally”, then it would create a specific opportunity for one to switch from miners (that would be after most of their decline) to silver (that would not be after most of its decline). Our estimation is that it might happen with GDX at about $31 - $32, and/or with gold at about $1,800. However, it would be the specific relative performance of miners to silver that would determine if we would make the switch or not.
We expect the above – a local bottom with miners at about $31 - $32 – to form within the next 5 weeks. However, this will likely not be the final bottom, especially if gold doesn’t slide to $1,700 at that time. We expect to see bigger declines to follow then, after a pause or a rebound. This means that miners could rally a bit from $31 - $32, and then decline below this area afterward.
At this time, the final GDX target (the one that would correspond to gold at $1,700 or lower) is still unclear. The $17 - $23 area seems probable, especially if the general stock market slides once again. It’s too early to say with any significant level of certainty. Gold is providing us with a clearer final target, so that’s what we’ll focus on. And most importantly – we’ll focus on gold’s performance relative to the USD Index.
Overview of the Upcoming Decline
As far as the current overview of the upcoming decline is concerned, I think it has already begun.
During the final part of the slide (which could end later than in 6 weeks, perhaps near the end of the year – just like it happened in 2015), we expect silver to decline more than miners. That would align with how the markets initially reacted to the Covid-19 threat.
The impact of all the new rounds of money printing in the U.S. and Europe on the precious metals prices is incredibly positive in the long run, which does not make the short-term decline improbable. Markets can and will get ahead of themselves and decline afterward – sometimes very profoundly – before continuing with their upward climb.
The plan is to exit the current positions in miners after they decline far and fast, but at the same time, silver drops just “significantly” (we expect this to happen in 0 – 5 weeks). In other words, the decline in silver should be severe, but the decline in the miners should look “ridiculous”. That’s what we did in March when we bought practically right at the bottom. It is a soft, but at the same time, a broad instruction, so additional confirmations are necessary.
I expect this confirmation to come from gold, reaching about $1,800. If – at the same time – gold moves to about $1,800 and miners are already after a ridiculously big drop (say, to $31 - $32 in the GDX ETF – or lower), we will probably exit the short positions in the miners and at the same time enter short positions in silver. It will be tempting to wait with opening the short position in silver until the entire sector rebounds, but such a rebound could last only a couple of hours, so it would be challenging to successfully execute such a strategy.
The precious metals market's final bottom is likely to take shape when gold shows significant strength relative to the USD Index. It could take the form of a gold’s rally or a bullish reversal, despite the ongoing USD Index rally.
Summary
Summing up, given the recent move higher in the general stock market, it could be the case that the decline is delayed (especially during the pre-election week), but there also signs pointing to the corrective upswing being already over, just like the weakness in the miners, the short-term breakdown in silver, not to mention the verification of the breakout in the USD Index.
Considering gold's breakout invalidation above the 2011 highs, it's evident that the big rally (that ended $4 above our upside target) is entirely over. Given this invalidation and the confirmed USD Index breakout, gold will probably slide much lower over the next few weeks. There are indications that the corrective upswing in the precious metals market and the pullback in the USDX are close to being over, so the decline could resume any day – or hour – now.
Naturally, everyone's trading is their responsibility. But in our opinion, if there ever was a time to either enter a short position in the miners or increase its size if it was not already sizable, it's now. We made money on the March decline, and on the March rebound, with another massive slide already underway.
After the sell-off (that takes gold to about $1,700 or lower), we expect the precious metals to rally significantly. The final decline might take as little as 1-6 weeks, so it's important to stay alert to any changes.
Most importantly, please stay healthy and safe. We made a lot of money on the March decline and the subsequent rebound (its initial part) price moves (and we'll likely earn much more in the following weeks and months), but you have to be healthy to enjoy the results.
As always, we'll keep you - our subscribers - informed.
To summarize:
Trading capital (supplementary part of the portfolio; our opinion): Full speculative short positions (300% of the full position) in mining stocks is justified from the risk to reward point of view with the following binding exit profit-take price levels:
Senior mining stocks (price levels for the GDX ETF): binding profit-take exit price: $32.02; stop-loss: none (the volatility is too big to justify a SL order in case of this particular trade); binding profit-take level for the DUST ETF: $28.73; stop-loss for the DUST ETF: none (the volatility is too big to justify a SL order in case of this particular trade)
Junior mining stocks (price levels for the GDXJ ETF): binding profit-take exit price: $42.72; stop-loss: none (the volatility is too big to justify a SL order in case of this particular trade); binding profit-take level for the JDST ETF: $21.22; stop-loss for the JDST ETF: none (the volatility is too big to justify a SL order in case of this particular trade)
For-your-information targets (our opinion; we continue to think that mining stocks are the preferred way of taking advantage of the upcoming price move, but if for whatever reason one wants / has to use silver or gold for this trade, we are providing the details anyway. In our view, silver has greater potential than gold does):
Silver futures downside profit-take exit price: unclear at this time - initially, it might be a good idea to exit, when gold moves to $1,703.
Gold futures downside profit-take exit price: $1,703
Long-term capital (core part of the portfolio; our opinion): No positions (in other words: cash
Insurance capital (core part of the portfolio; our opinion): Full position
Whether you already subscribed or not, we encourage you to find out how to make the most of our alerts and read our replies to the most common alert-and-gold-trading-related-questions.
Please note that we describe the situation for the day that the alert is posted in the trading section. In other words, if we are writing about a speculative position, it means that it is up-to-date on the day it was posted. We are also featuring the initial target prices to decide whether keeping a position on a given day is in tune with your approach (some moves are too small for medium-term traders, and some might appear too big for day-traders).
Additionally, you might want to read why our stop-loss orders are usually relatively far from the current price.
Please note that a full position doesn't mean using all of the capital for a given trade. You will find details on our thoughts on gold portfolio structuring in the Key Insights section on our website.
As a reminder - "initial target price" means exactly that - an "initial" one. It's not a price level at which we suggest closing positions. If this becomes the case (like it did in the previous trade), we will refer to these levels as levels of exit orders (exactly as we've done previously). Stop-loss levels, however, are naturally not "initial", but something that, in our opinion, might be entered as an order.
Since it is impossible to synchronize target prices and stop-loss levels for all the ETFs and ETNs with the main markets that we provide these levels for (gold, silver and mining stocks - the GDX ETF), the stop-loss levels and target prices for other ETNs and ETF (among other: UGLD, DGLD, USLV, DSLV, NUGT, DUST, JNUG, JDST) are provided as supplementary, and not as "final". This means that if a stop-loss or a target level is reached for any of the "additional instruments" (DGLD for instance), but not for the "main instrument" (gold in this case), we will view positions in both gold and DGLD as still open and the stop-loss for DGLD would have to be moved lower. On the other hand, if gold moves to a stop-loss level but DGLD doesn't, then we will view both positions (in gold and DGLD) as closed. In other words, since it's not possible to be 100% certain that each related instrument moves to a given level when the underlying instrument does, we can't provide levels that would be binding. The levels that we do provide are our best estimate of the levels that will correspond to the levels in the underlying assets, but it will be the underlying assets that one will need to focus on regarding the signs pointing to closing a given position or keeping it open. We might adjust the levels in the "additional instruments" without adjusting the levels in the "main instruments", which will simply mean that we have improved our estimation of these levels, not that we changed our outlook on the markets. We are already working on a tool that would update these levels daily for the most popular ETFs, ETNs and individual mining stocks.
Our preferred ways to invest in and to trade gold along with the reasoning can be found in the how to buy gold section. Furthermore, our preferred ETFs and ETNs can be found in our Gold & Silver ETF Ranking.
As a reminder, Gold & Silver Trading Alerts are posted before or on each trading day (we usually post them before the opening bell, but we don't promise doing that each day). If there's anything urgent, we will send you an additional small alert before posting the main one.
Thank you.
Sincerely,
Przemyslaw Radomski, CFA
Editor-in-chief, Gold & Silver Fund Manager

