

Briefly: in our opinion, full (300% of the regular position size) speculative short positions in mining stocks are justified from the risk/reward point of view at the moment of publishing this Alert.
Remember when I told you yesterday that the “strength” of gold stocks was likely more or less random and not a true sign of strength? Yesterday’s lack thereof confirmed it. Gold moved higher, but gold stocks almost didn’t. Implications? That was just a tiny, inconsequential, counter-trend upswing within a bigger decline.
Let’s take a look at what senior miners and junior mining stocks did yesterday.
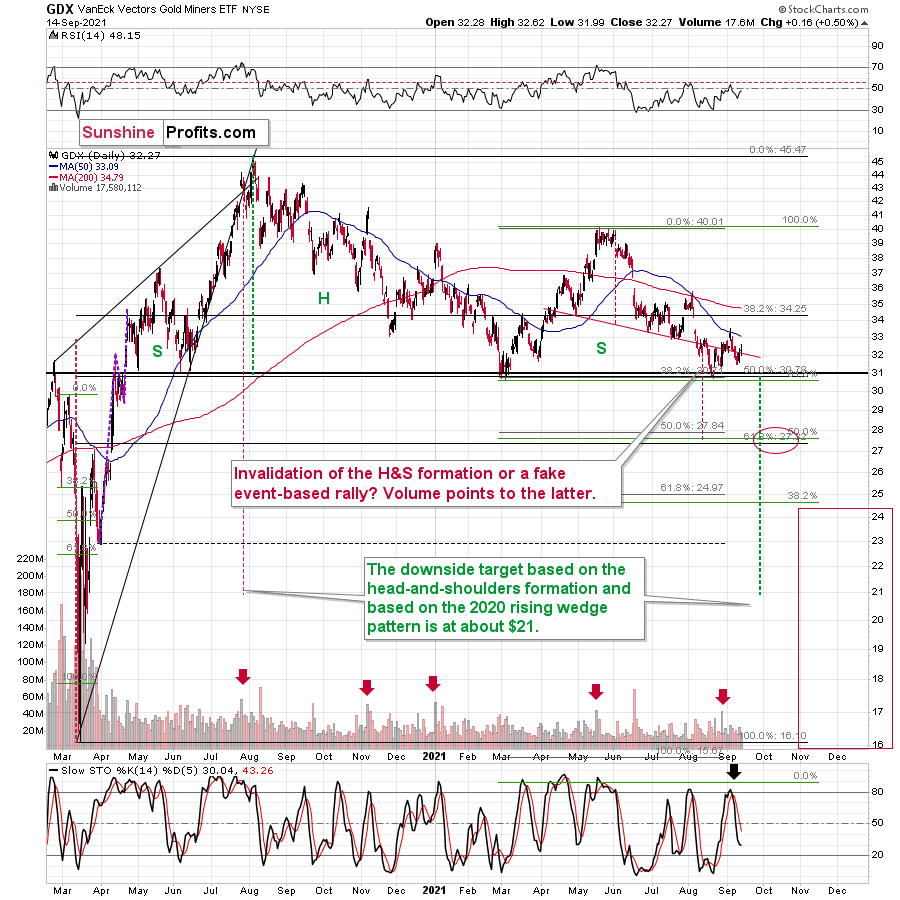
The GDX ETF was up by a mere $0.16 and it closed the day very close to where it had closed on Aug. 23 – just a day after it rallied from its recent lows. In other words, the current GDX ETF price is practically just a single-day rally above the yearly lows. At the same time, gold is trading over $130 above its yearly lows. Are senior gold stocks really showing strength? Absolutely not.
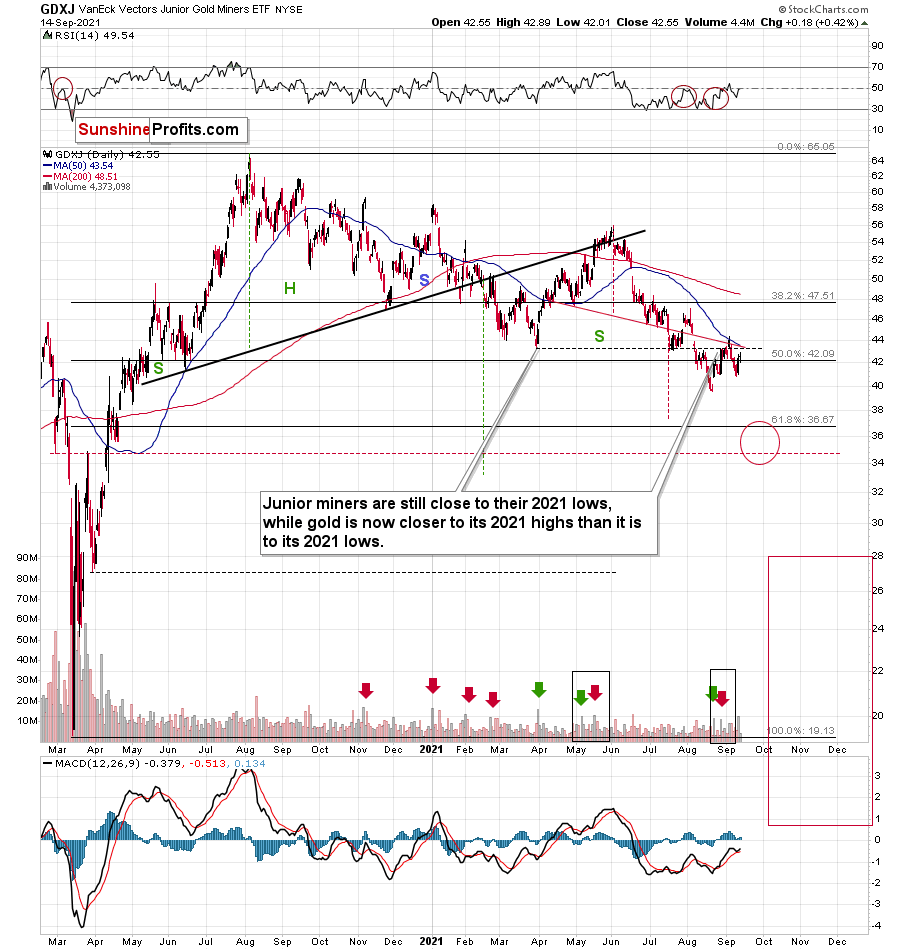
As far as junior miners are concerned, the situation is similar, but even more bearish. In GDXJ, we have another sell signal coming from volume. It spiked, and the last time we saw the volume this high, was in mid-May. And what happened in mid-May? It was not the exact top, but it was very close to it, and shortly before a $15+ decline started. It was a perfect time to enter a short position in the junior miners, or one could use this indication as reassurance that this position is justified from the risk to reward point of view. (Of course, there are many more factors that point to this direction, not just the volume spike in the GDXJ ETF.)
Overall, juniors are verifying their previous breakdown to new yearly lows, and they are successful in this verification. This opens the door to huge declines wide open.
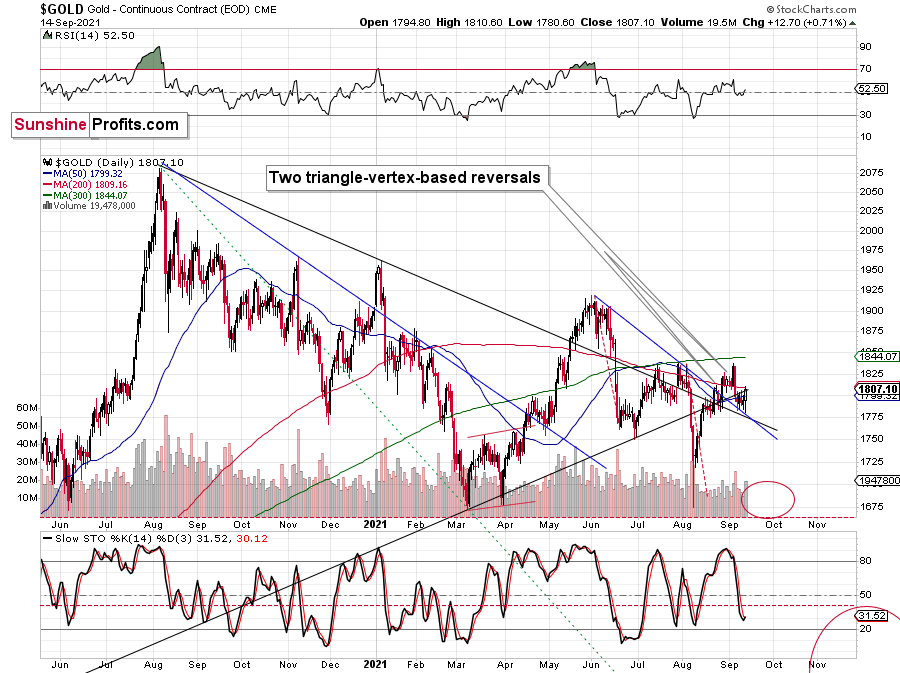
Just like I wrote earlier today, gold moved higher yesterday (it’s down in today’s pre-market trading, though), but it didn’t break any important resistance level, so this move was rather inconsequential. The outlook for gold and gold stocks remains bearish.
By the way, do you recall when I wrote that gold was likely to reverse in the second half of September or in the middle thereof, but that we’ll know more when we get closer to this date? Well, it’s the middle of the month today, and it’s obvious that we didn’t see a major decline in the recent days, just a relatively small one.
Consequently, it seems that the reversal that I mentioned previously will not be an important bottom, but an important top. This makes sense in light of the upcoming FOMC (in one week), which is likely to trigger some short-term volatility. Will the PMs and miners rally until the Fed speaks? It’s unclear, and not that likely. They could decline beforehand, or they could do nothing. The very near term is unclear, but that doesn’t matter that much, as the medium-term is very clear – the gold, silver, and mining stocks are going down.
One of the reasons is the more-than-confirmed breakout above the neck level in the USD Index’s inverse head and shoulders pattern.
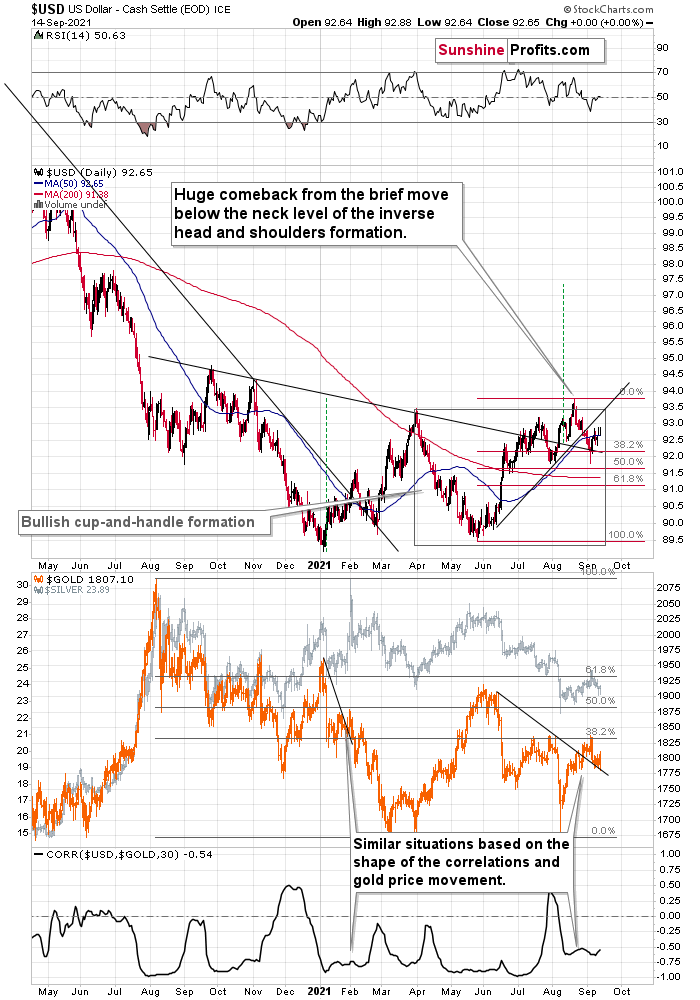
It took about a year for this bullish pattern to form, so it’s likely that its consequences will also be of medium-term nature. So far, the USDX has been moving back and forth, but when it finally moves, it’s likely to rally above 97, as the targets based on this formation are based on the size of its “head” (marked with green, dashed lines).
As the USD Index rallies, gold is likely to move lower. And as gold moves lower, gold stocks are likely to move lower faster, as they’ve been underperforming gold for months. And as senior gold miners move lower faster, junior miners are likely to move lower even faster.
Having said that, let’s take a look at the markets from a more fundamental point of view.
Goldilocks and the Three Bears
While it may seem counterintuitive, I’ve been warning for months that lower inflation is actually bullish for the PMs. Contrary to popular opinion, the PMs’ fundamental story is akin to Goldilocks: when inflation is too hot, the reaction from the bond market and the response from the Fed hurts their performance. Conversely, when inflation is too cold, economic weakness often uplifts the U.S. dollar (safe-haven bid) and the PMs’ fundamental attractiveness dwindles. But wedged right in the middle, the PMs felt that Tuesday’s (Sep. 14) inflation print was ‘just right.’
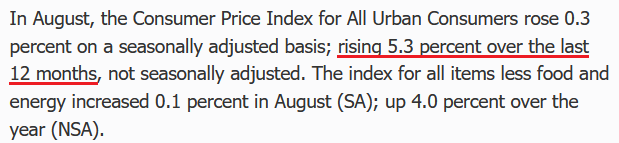
However, the optimism is fraught with peril. To explain, I warned on Aug. 17 that the commodity Producer Price Index (PPI) implies a headline Consumer Price Index (CPI) print of roughly 5.25% to 5.75% when the data is released on Sep. 14. And after inflation jumped by 5.3% year-over-year (YoY), it’s still tracking more than 2.5x the Fed’s annual target.
Please see below:
 Source: U.S. Bureau of Labor Statistics (BLS)
Furthermore, while the PMs celebrated the release, overzealous investors may regret trying to catch the falling knife. For example, I’ve mentioned on several occasions that the month-over-month (MoM) percentage change in the commodity PPI will likely determine when/if the inflationary momentum subsides. And after economically-sensitive commodities were slaughtered in mid-August, the S&P GSCI (commodity index) ended the month down ~2.5%. But despite all of that, the commodity PPI still increased by 0.74% MoM and surged by 19.87% YoY (a new 2021 high and the most since 1974). As a result, another headline CPI print of roughly 5.25% to 5.75% should hit the wire when the data is released on Oct. 13.
Please see below:
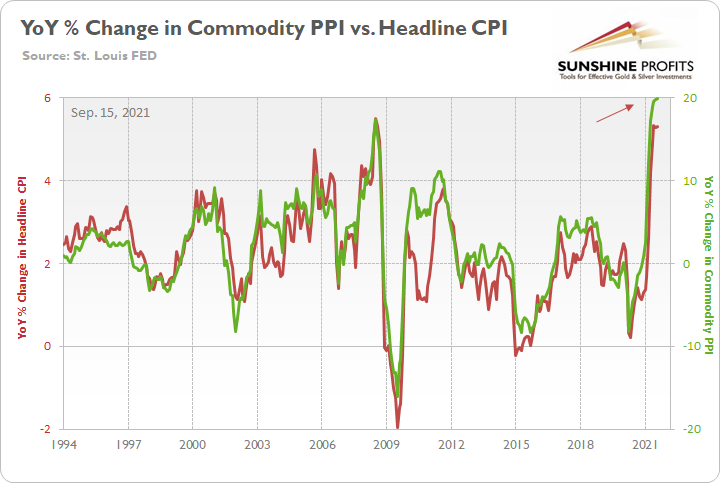
To explain, the green line above tracks the YoY percentage change in the commodity PPI, while the red line above tracks the YoY percentage change in the headline CPI. If you analyze the relationship, you can see that the pair have a close connection.
What’s more, while the incremental increases in inflation are bound to decrease in magnitude over time, investors are all in on the Fed’s “transitory” narrative.
Please see below:
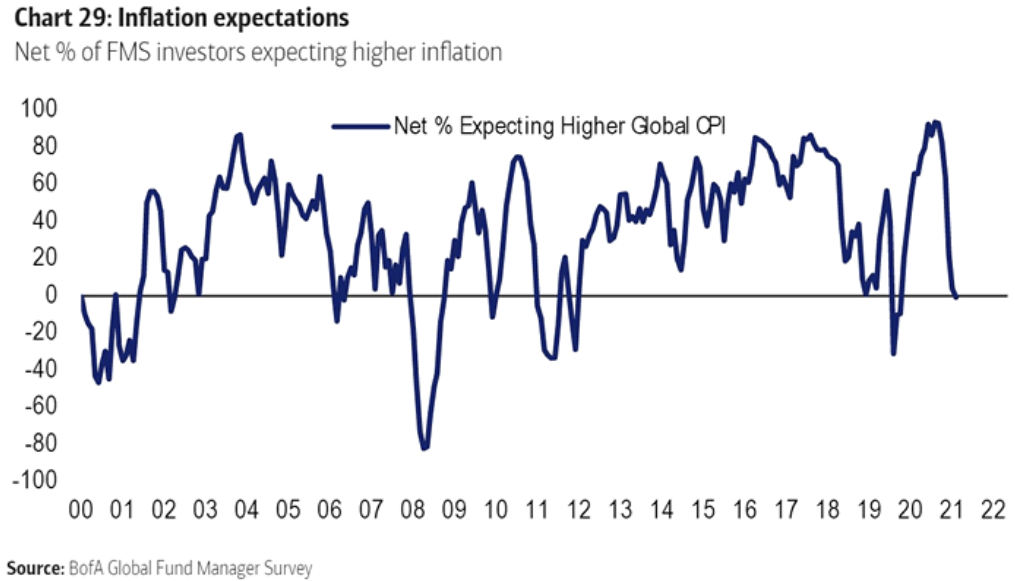
To explain, the blue line above tracks the net-percentage of institutional investors in Bank of America’s Global Fund Manager Survey that expect a higher global CPI. If you analyze the sharp decline on the right side of the chart, you can see that inflation expectations have fallen off a cliff.
However, with the “transitory” goal post first pegged at a few months, then all of 2021, and now mid-2022 (for context, all inflation is transitory), “base effects” was the first narrative to suffer a painful death. More importantly, though what investors miss now is that peak inflation doesn’t mean declining inflation. Think about it: if we recommended a short position in the GDXJ ETF, would you be satisfied if the price peaked but didn’t move lower? And while quite humorous, this is the Fed’s conundrum.
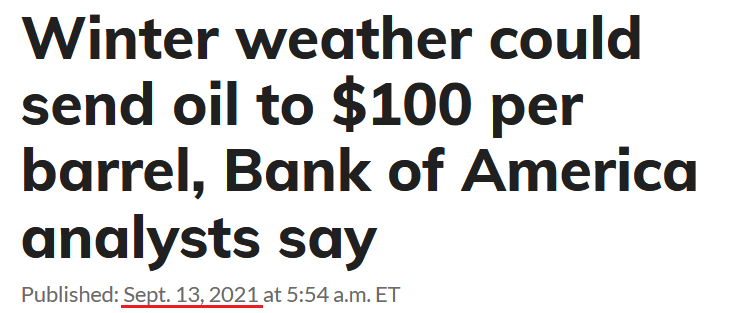
To explain, while the magnitude of new highs may slow (obviously, prices can’t surge in perpetuity), the commodity PPI is still increasing MoM and calls for $100 oil are making the rounds on CNBC and Bloomberg. Thus, does it make sense for inflation to subside while commodity prices keep rising?
See for yourself:
 Source: MarketWatch
And:
 Source: Bloomberg
For a detailed breakdown, the commodity PPI exhibits a correlation of 0.87 with the headline CPI. As a result, with 5%+ inflation already on the books, do you think that the Fed can tolerate $100 oil?
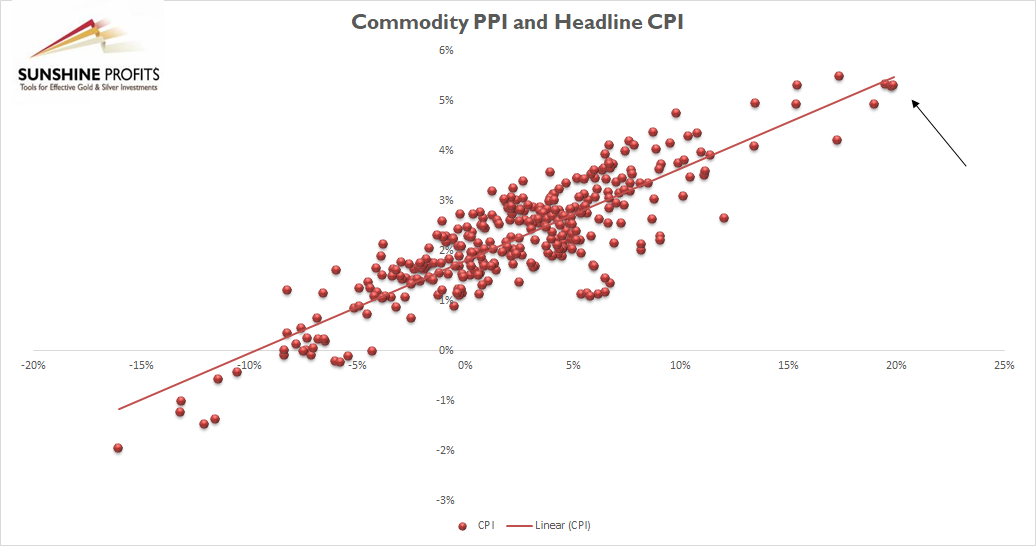
To explain, the scatterplot above depicts the relationship between the headline CPI and the commodity PPI (since 1994). For context, the headline CPI is plotted on the vertical axis, while the commodity PPI is plotted on the horizontal axis. If you analyze their movement, you can see that the pair have a strong linear relationship. Moreover, if you focus your attention on the right side of the chart (the black arrow), you can see that the PPI/CPI relationship remains right on trend.
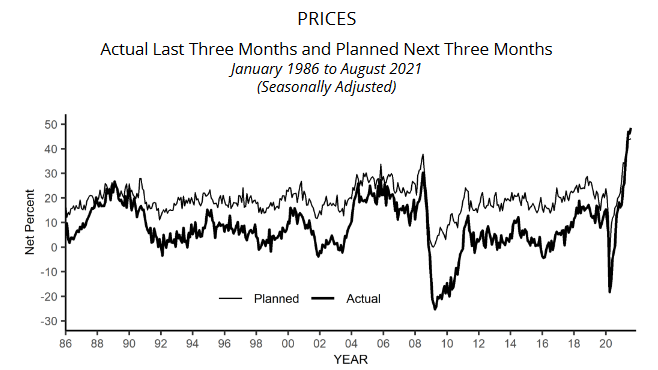
If that wasn’t enough, the NFIB released is Small Business Optimism Index on Sep. 14. And while the headline index increased from 99.7 in July to 100.1 in August, the report revealed:
“The net percent of owners raising average selling prices increased three points to a net 49% [a new all-time high and]… a net 44% of owners plan price hikes [matching the all-time high set in July].”
Please see below:
 Source: NFIB
Continuing the theme:
“Seasonally adjusted, a net 41 percent reported raising compensation, up 3 points from July and a 48-year record high reading. A net 26 percent plan to raise compensation in the next three months, down 1 point from July’s record high reading.”
Please see below:
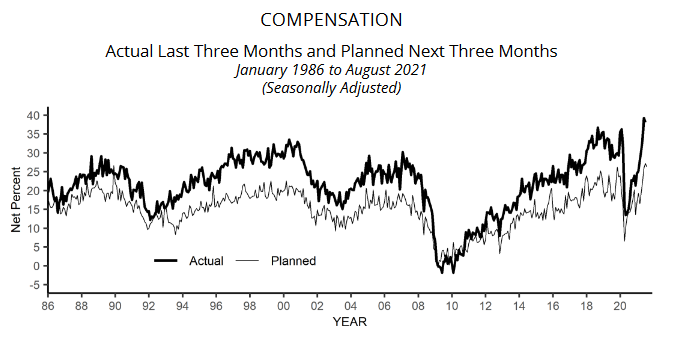 Source: NFIB
And speaking of wage inflation, Sam’s Club announced on Sep. 14 that it will raise its minimum wage from $11 per hour to $15 per hour on Sep. 25. For context, Sam’s Club operates nearly 600 stores and has roughly 100,000 employees. And while ~95% of its employees already make $15 per hour, the new policy includes step-up pay and associates can now make as much as $34 per hour (up from $29.70 previously).
Please see below:
 Source: CNBC
Finally, 3M CFO Monish Patowala said the following during a Morgan Stanley conference on Sep. 13. For context, 3M manufactures products for all kinds of businesses, including those within the automotive, health care and consumer industries.
“I think the inflation is unprecedented. We are seeing inflation in the same areas I talked about earlier jobs, raw material, labor and logistics, raw materials again you go down to polypropylene, talk about resins, that inflation remains…. So, we've seen inflation in the resins work, we've seen it with poly propylene, ethylene, wood, pulp. You're seeing inflation in all those areas. We are also seeing labor inflation. You're seeing labor inflation, whether it's outsource manufacturing goods, plus in some cases, even in our own factories.
“The future will depend on when inflation starts tempering down and, my belief - and I may be wrong - is until we see demand and supply parity somewhere, we can continue to see inflation in raw materials and in logistics. And I think port congestion, as well as port shutdowns.”
The bottom line? While investors seem to think that commodity prices will go to the moon, inflation will slow down and the Fed will remain patient all at the same time (Goldilocks), the narrative lacks common sense. And since bullish bets in the commodities market only increases the inflationary fervor, the Fed will likely turn that narrative upside down in the coming weeks/months.
In conclusion, the PMs benefited from the peak inflation narrative on Sep. 14, as weaker-than-expected data helps elongate investors’ perceived taper timeline. However, more indicative of reality, the USD Index barely flinched. And with the greenback’s fundamental strength underpinned by the belief that a major taper announcement will commence on Sep. 21/22 or on Nov. 2/3, the competing narratives will likely come to a head in the near future.
Letters to the Editor
(two questions on a similar topic)
Q1: Would it be possible for you to post a more detailed graph with a shorter timeframe for the price of gold, or the GDX or GDXJ prices? It’s difficult to get a handle on the timing of any moves when what appears imminent on the graphs may in fact be two or three weeks away, at least. I enjoy your analyses. They reflect a lot of hard work and thought by you and your staff.
Q2: Love the new format, seeing you in the bottom corner and having you blow up the chart you are talking about at the moment seemed to work very well. Easy to follow and understand. Once sound is worked out, it'll be excellent!
I'm always curious on timing. Of course, I'd like you to predict the moves down to the day or week but know that's wishful thinking. However, if you could talk in terms of next two weeks, or next 30 days, or look for this is 30 to 60 days, etc., anything that would help tighten this down would be great. I know I'm asking for the world. If you could give me tomorrow's wall street journal today, that would be great too.
Love your work!
A: Thank you for the kind words and for the feedback. I’m working on the sound with regard to videos, and it seems that it should be much better before next week. I’ll experiment with the format some more, stay tuned.
I would love to tell you what the market does in a few hours, what it does tomorrow, in 5 days, in 10 days, in 20 days, in 40 days, in 90 days, and so on.
But what I can and will do is provide you with my thoughts on what I think is likely to happen based on the data that I have, based on all my financial expertise, and based on more than a decade of specialization in the precious metals market.
The thing is: I don’t know what is likely to happen in the precious metals sector in a few hours, tomorrow, and even the next five days are quite unclear. These are not the time frames that I specialize in, and these are not the time frames where the tools that I have most experience in using work best. For day traders, other techniques would be best than they are for me. And I can’t ethically tell you that something is very likely to happen, when I don’t know if its very likely or just somewhat likely. And I don’t have this clarity with regard to very short-term moves. I know that this kind of honesty is not popular among the all-knowing professionals (and especially among journalists, who “know” what caused gold’s $1 move on each day… - and yes, it’s a mean (?) joke on my end, as nobody knows why gold moved by $1 on any given day, such tiny moves are just price noise), but that’s just me – if I don’t know, I’m going to tell you exactly that. This way, you know that when I tell you that something is very likely to happen, then you know that I mean exactly that, and not that I’m writing this because I always “need” to show you that I have all the answers. I don’t, and neither does anyone else in the investment business.
A few weeks ago, I added a chart to the “Overview of the Upcoming Part of the Decline” section, and I’m updating it, when something changes. What you see there, are rectangles that cover both: price AND time. This is to show you where I think gold is headed and when it’s headed there. The ranges are relatively broad, because it’s not clear to me when these levels are going to be reached, but I have an educated guesstimate.
If something gets clearer for the very near term, I’m writing about that in the analysis, but in general, you can assume that I don’t know (or care that much) what’s going to happen in the very near term, because that’s not the time frame where I know myself to be at my best. I’m not going to “play the game” where I don’t think I’m at my best, and instead I’m going to focus on time-frames / approaches, when I do think so. This way, I’m delivering you only my best at all times. And at times, it means that I will tell you that a given situation is unclear for the very near term. If I don’t mention the very near term, it means exactly that.
Q: Thanks for the providing such a previous information regarding gold mining. Since I am a new subscriber of Sunshine Profits, I’m unable to judge the range of downfall of gold. In this connection, can you provide the specific range on where I should short and at what exit point. In India, we get the mining information given as MCX GOLD OCT SELL AT CMP 46905 ADD MORE AT 47030 STOP 47210 TGT 46650/46370. These kind of messages give us specific information on buying or selling. Kindly look into the matter, and if possible, please provide the gold mining information as above. Thanks in advance.
A: The range of the downfall depends on what kind of perspective one is interested in. I’m providing the details regarding the “when” question in the chart present in the “Overview of the Upcoming Part of the Decline” section, and I’m describing the trading positions in the “Trading” section below the summary. I’m not using gold for this trade, I’m not using stop-loss order for this trade (as I don’t think it would fit this trade and my approach toward it) but I do have profit-take levels for junior mining stocks, and also for gold, if that is what one prefers to use. It’s below the summary. Quoting:
For-your-information targets (our opinion; we continue to think that mining stocks are the preferred way of taking advantage of the upcoming price move, but if for whatever reason one wants / has to use silver or gold for this trade, we are providing the details anyway.):
Silver futures downside profit-take exit price: unclear at this time - initially, it might be a good idea to exit, when gold moves to $1,683
Gold futures downside profit-take exit price: $1,683
As you may have noticed on the chart in the “Overview of the Upcoming Part of the Decline”, I think that after correcting, gold will then decline once again – and I plan to have short positions to profit from this decline as well. I’m not sure if I’m going to go long in the meantime as long positions during such a strong medium-term downtrend are going to be particularly risky.
Overview of the Upcoming Part of the Decline
- It seems to me that the corrective upswing in gold is over or close to being over, and the big decline seems to be already underway.
- It seems that the first stop for gold will be close to its previous 2021 lows, slightly below $1,700. Then it will likely correct a bit, but it’s unclear if I want to exit or reverse the current short position based on that – it depends on the number and the nature of the bullish indications that we get at that time.
- After the above-mentioned correction, we’re likely to see a powerful slide, perhaps close to the 2020 low ($1,450 - $1,500).
- If we see a situation where miners slide in a meaningful and volatile way while silver doesn’t (it just declines moderately), I plan to switch from short positions in miners to short positions in silver. At this time, it’s too early to say at what price levels this could take place, and if we get this kind of opportunity at all – perhaps with gold close to $1,600.
- I plan to exit all remaining short positions when gold shows substantial strength relative to the USD Index while the latter is still rallying. This might take place with gold close to $1,350 - $1,400. I expect silver to fall the hardest in the final part of the move. This moment (when gold performs very strongly against the rallying USD and miners are strong relative to gold after its substantial decline) is likely to be the best entry point for long-term investments, in my view. This might also happen with gold close to $1,375, but it’s too early to say with certainty at this time. I expect the final bottom to take place near the end of the year, perhaps in mid-December.
- As a confirmation for the above, I will use the (upcoming or perhaps we have already seen it?) top in the general stock market as the starting point for the three-month countdown. The reason is that after the 1929 top, gold miners declined for about three months after the general stock market started to slide. We also saw some confirmations of this theory based on the analogy to 2008. All in all, the precious metals sector is likely to bottom about three months after the general stock market tops.
- The above is based on the information available today, and it might change in the following days/weeks.
You will find my general overview of the outlook for gold on the chart below:
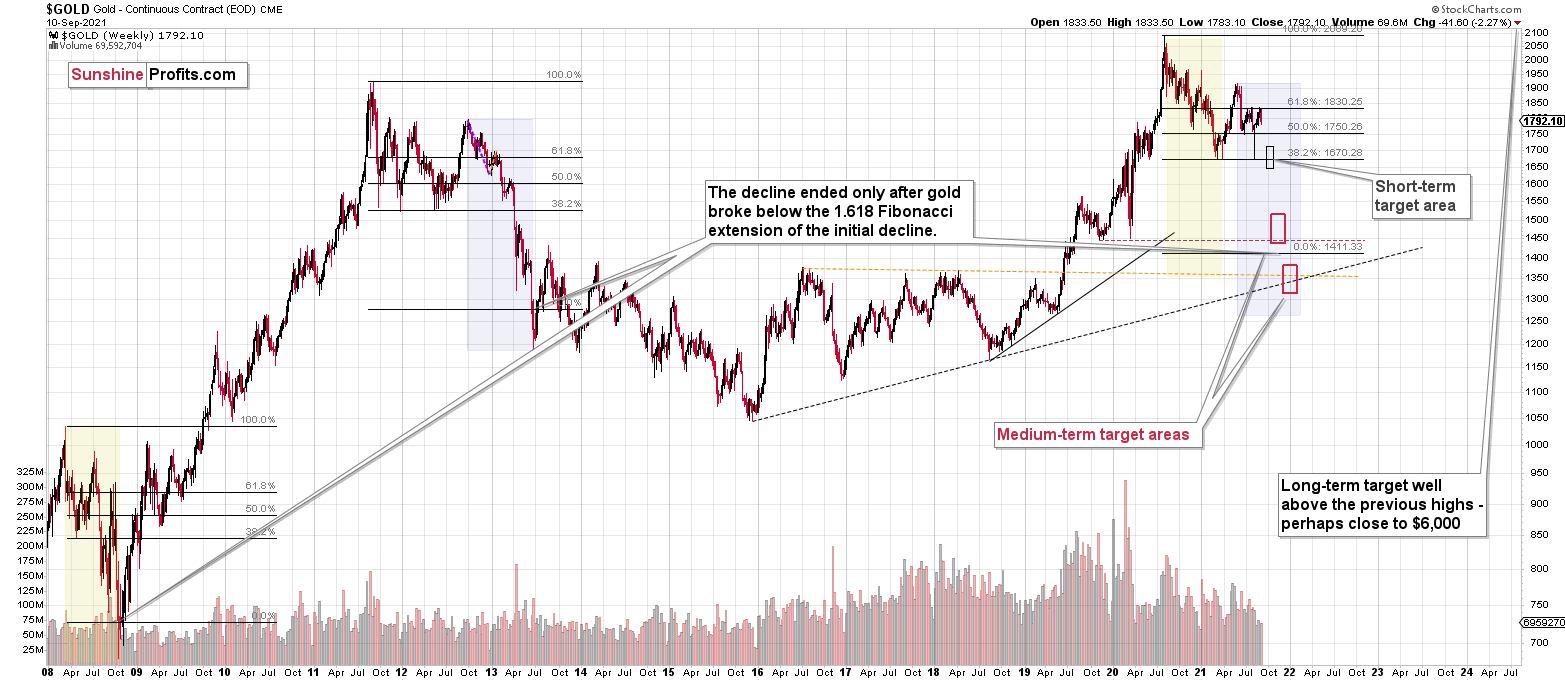
Please note that the above timing details are relatively broad and “for general overview only” – so that you know more or less what I think and how volatile I think the moves are likely to be – on an approximate basis. These time targets are not binding or clear enough for me to think that they should be used for purchasing options, warrants or similar instruments.
Summary
To summarize, the previous strength in the precious metals sector was reversed, just like it was likely to, and the most bearish thing about it is that it happened practically without a good fundamental trigger. This means that the precious metals sector simply can’t wait to decline to much lower levels.
It seems that our profits from the short positions are going to become truly epic in the following weeks.
After the sell-off (that takes gold to about $1,350 - $1,500), I expect the precious metals to rally significantly. The final part of the decline might take as little as 1-5 weeks, so it's important to stay alert to any changes.
Most importantly, please stay healthy and safe. We made a lot of money last March and this March, and it seems that we’re about to make much more on the upcoming decline, but you have to be healthy to enjoy the results.
As always, we'll keep you - our subscribers - informed.
By the way, we’re currently providing you with the possibility to extend your subscription by a year, two years or even three years with a special 20% discount. This discount can be applied right away, without the need to wait for your next renewal – if you choose to secure your premium access and complete the payment upfront. The boring time in the PMs is definitely over, and the time to pay close attention to the market is here. Naturally, it’s your capital, and the choice is up to you, but it seems that it might be a good idea to secure more premium access now while saving 20% at the same time. Our support team will be happy to assist you in the above-described upgrade at preferential terms – if you’d like to proceed, please contact us.
To summarize:
Trading capital (supplementary part of the portfolio; our opinion): Full speculative short positions (300% of the full position) in mining stocks are justified from the risk to reward point of view with the following binding exit profit-take price levels:
Mining stocks (price levels for the GDXJ ETF): binding profit-take exit price: $35.73; stop-loss: none (the volatility is too big to justify a stop-loss order in case of this particular trade)
Alternatively, if one seeks leverage, we’re providing the binding profit-take levels for the JDST (2x leveraged) and GDXD (3x leveraged – which is not suggested for most traders/investors due to the significant leverage). The binding profit-take level for the JDST: $16.96; stop-loss for the JDST: none (the volatility is too big to justify a SL order in case of this particular trade); binding profit-take level for the GDXD: $35.46; stop-loss for the GDXD: none (the volatility is too big to justify a SL order in case of this particular trade).
For-your-information targets (our opinion; we continue to think that mining stocks are the preferred way of taking advantage of the upcoming price move, but if for whatever reason one wants / has to use silver or gold for this trade, we are providing the details anyway.):
Silver futures downside profit-take exit price: unclear at this time - initially, it might be a good idea to exit, when gold moves to $1,683
Gold futures downside profit-take exit price: $1,683
HGD.TO – alternative (Canadian) inverse 2x leveraged gold stocks ETF – the upside profit-take exit price: $11.38
Long-term capital (core part of the portfolio; our opinion): No positions (in other words: cash
Insurance capital (core part of the portfolio; our opinion): Full position
Whether you already subscribed or not, we encourage you to find out how to make the most of our alerts and read our replies to the most common alert-and-gold-trading-related-questions.
Please note that we describe the situation for the day that the alert is posted in the trading section. In other words, if we are writing about a speculative position, it means that it is up-to-date on the day it was posted. We are also featuring the initial target prices to decide whether keeping a position on a given day is in tune with your approach (some moves are too small for medium-term traders, and some might appear too big for day-traders).
Additionally, you might want to read why our stop-loss orders are usually relatively far from the current price.
Please note that a full position doesn't mean using all of the capital for a given trade. You will find details on our thoughts on gold portfolio structuring in the Key Insights section on our website.
As a reminder - "initial target price" means exactly that - an "initial" one. It's not a price level at which we suggest closing positions. If this becomes the case (like it did in the previous trade), we will refer to these levels as levels of exit orders (exactly as we've done previously). Stop-loss levels, however, are naturally not "initial", but something that, in our opinion, might be entered as an order.
Since it is impossible to synchronize target prices and stop-loss levels for all the ETFs and ETNs with the main markets that we provide these levels for (gold, silver and mining stocks - the GDX ETF), the stop-loss levels and target prices for other ETNs and ETF (among other: UGL, GLL, AGQ, ZSL, NUGT, DUST, JNUG, JDST) are provided as supplementary, and not as "final". This means that if a stop-loss or a target level is reached for any of the "additional instruments" (GLL for instance), but not for the "main instrument" (gold in this case), we will view positions in both gold and GLL as still open and the stop-loss for GLL would have to be moved lower. On the other hand, if gold moves to a stop-loss level but GLL doesn't, then we will view both positions (in gold and GLL) as closed. In other words, since it's not possible to be 100% certain that each related instrument moves to a given level when the underlying instrument does, we can't provide levels that would be binding. The levels that we do provide are our best estimate of the levels that will correspond to the levels in the underlying assets, but it will be the underlying assets that one will need to focus on regarding the signs pointing to closing a given position or keeping it open. We might adjust the levels in the "additional instruments" without adjusting the levels in the "main instruments", which will simply mean that we have improved our estimation of these levels, not that we changed our outlook on the markets. We are already working on a tool that would update these levels daily for the most popular ETFs, ETNs and individual mining stocks.
Our preferred ways to invest in and to trade gold along with the reasoning can be found in the how to buy gold section. Furthermore, our preferred ETFs and ETNs can be found in our Gold & Silver ETF Ranking.
As a reminder, Gold & Silver Trading Alerts are posted before or on each trading day (we usually post them before the opening bell, but we don't promise doing that each day). If there's anything urgent, we will send you an additional small alert before posting the main one.
Thank you.
Przemyslaw Radomski, CFA
Founder, Editor-in-chief

