

Briefly: In our opinion, full (150% of the regular full position) speculative short positions in gold, silver and mining stocks are justified from the risk/reward perspective at the moment of publishing this alert.
In the previous alerts we elaborated on the underperformance of mining stocks. Miners have indeed refused to move above their 38.2% Fibonacci retracement even though gold and silver have kept pushing higher. They have also declined profoundly this week erasing more than the entire previous week of gains. However, mining stocks showed strength by not declining visibly yesterday, even though gold and silver moved lower. What can we infer from this subtle sign of strength?
In short, not much. It might be surprising and/or disappointing, but one swallow doesn’t make summer and just one session without substantial declines doesn’t prove anything (unless the volume is extreme or extremely low, but this was not the case yesterday). As we wrote above, miners declined substantially on Monday, so their breather on Tuesday is something rather natural. Let’s take a look at the details (chart courtesy of http://stockcharts.com).
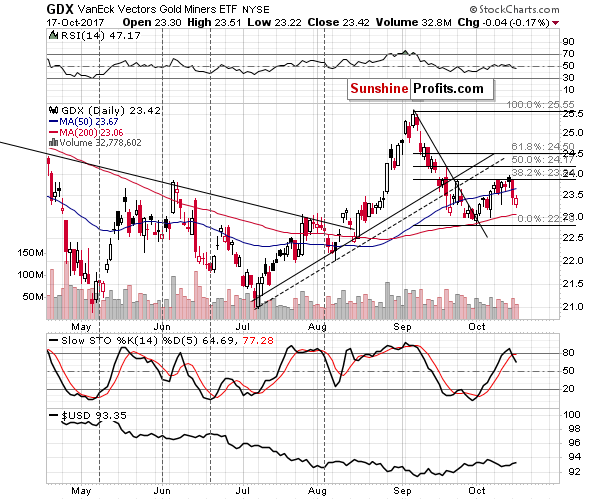
In yesterday’s alert, we commented on the above chart in the following way (and it remains up-to-date also today):
In the case of the GDX, we can also see that the volume during yesterday’s decline was relatively big, which further confirms the bearish outlook.
At this point we would like to remind you about the analogy between the current situation and what we saw in 2008 just before the slide – this analogy remains in near-perfect tune – we don’t want to quote an entire previous alert here, but we encourage you to review what we wrote 8 days ago.
The near-term implication is that we are likely to see a move back to the September low sometime this week or early in the next week and then (without another bigger correction) another slide to the 180 – 187 range in the HUI. Then – after a brief pause – the decline is likely to continue to the 2016 low (reaching them could also trigger a short-term correction).
Mining stocks didn’t move substantially lower yesterday, but they didn’t rally either, and that was enough for the daily Stochastic indicator to flash a visible sell sign. To be clear, it was already present based on Monday’s decline, but it was slightly unclear – based on what happened yesterday, this is no longer the case.
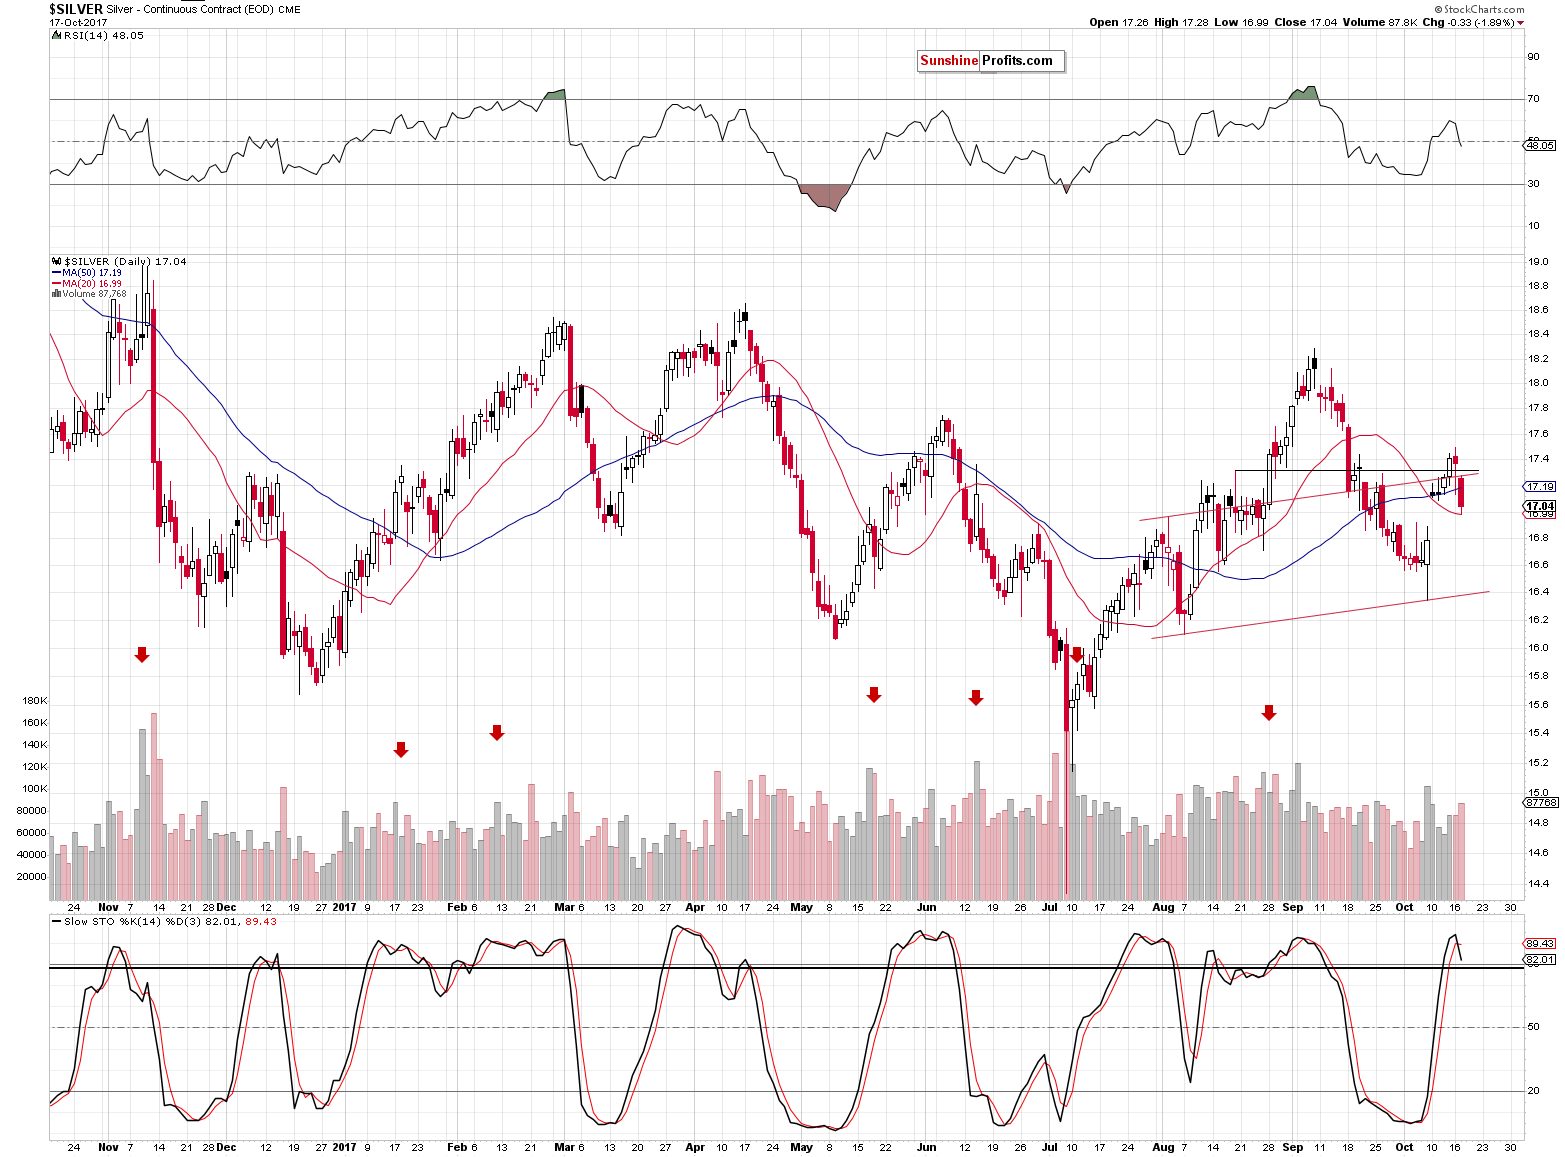
The sell signal from the same indicator is also visible in the case of silver. At the moment of writing these words, the white metal is trading a few cents below $17, so it seems that the decline continues.
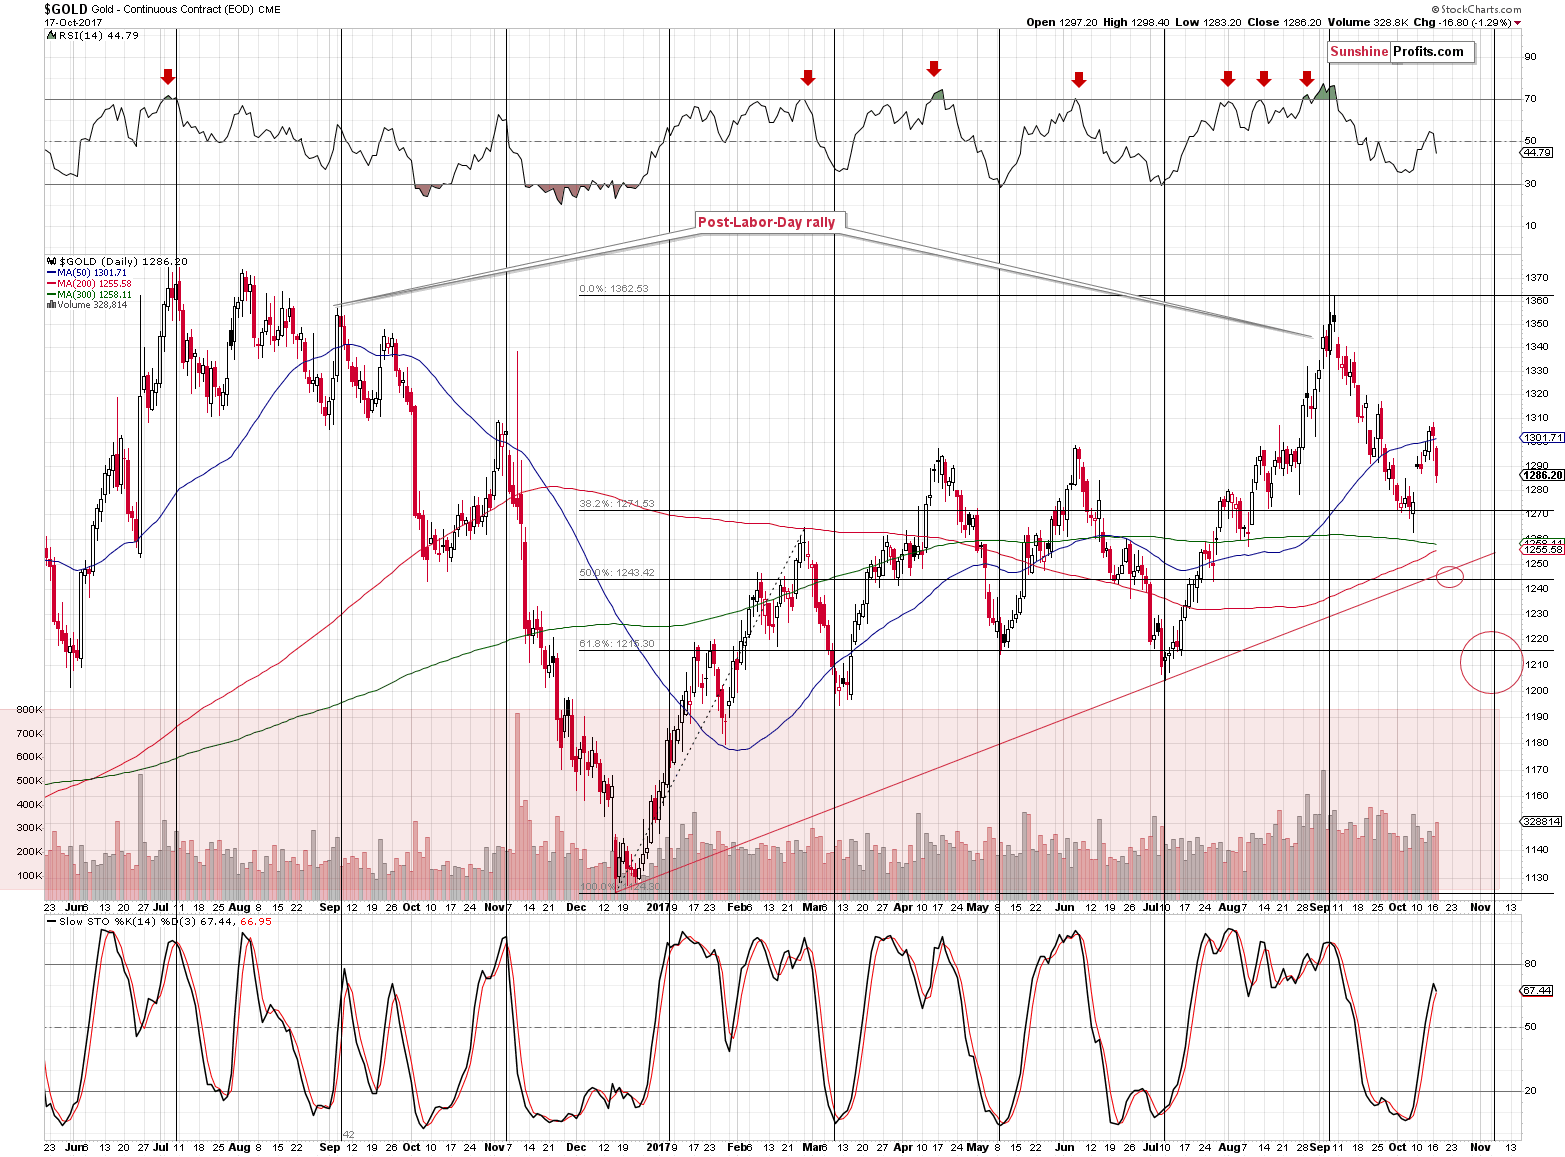
In yesterday’s alert, we wrote the following on the above chart:
The price on the above chart doesn’t seem to truly reflect yesterday’s closing price – it was about $1,295 and at the moment of writing these words gold is trading at $1,289 - well below the $1,300 level. The recent breakout (above both $1,300 per se and the 50-day moving average) was already invalidated.
The chart finally reflects the invalidation of the breakdown and since gold’s price is $1,281 at the moment of writing these words, it appears that the decline continues. The increase in the volume during yesterday’s decline confirms that this is the true direction in which the market is currently moving.
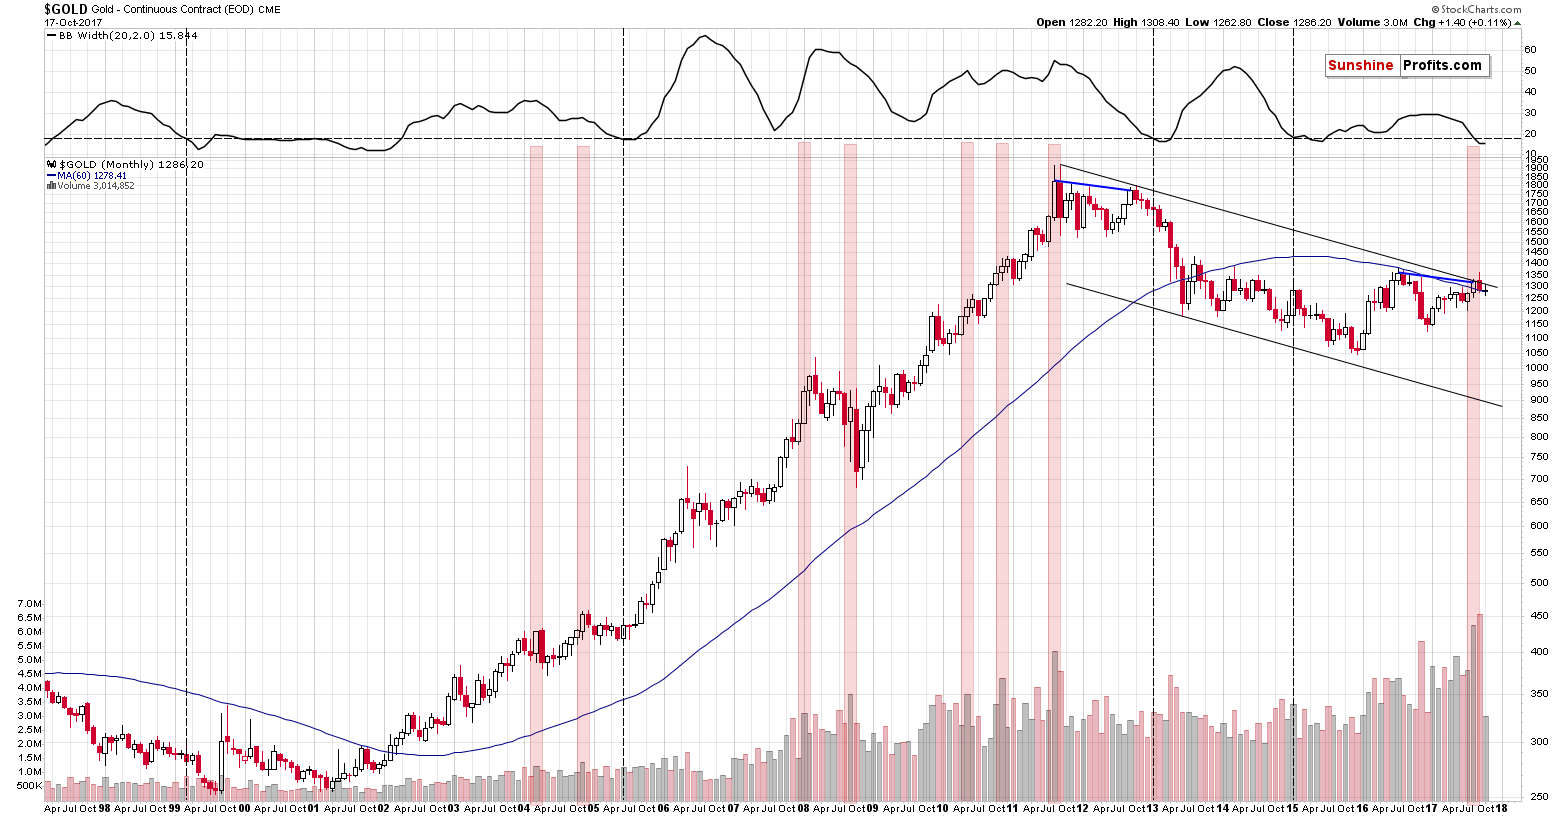
From the long-term point of view, we see that the analogy to what happened in 2012 before the big plunge remains in place.
The rally that preceded the final tops (2011 and 2016) and the pace of decline between the mentioned tops and the following ones (blue lines connect these tops with the late-2012 and 2017 tops, respectively) is very similar and the same goes for the follow-up action. In both cases there was an attempt to move above the previous high in the following month and in both cases it failed. In the next month in 2012 we saw another smaller and quicker upswing followed by another decline. Even though the current month isn’t over yet, the monthly candlestick already looks just like what we saw in 2012, before the acceleration of the decline.
The implications remain bearish.
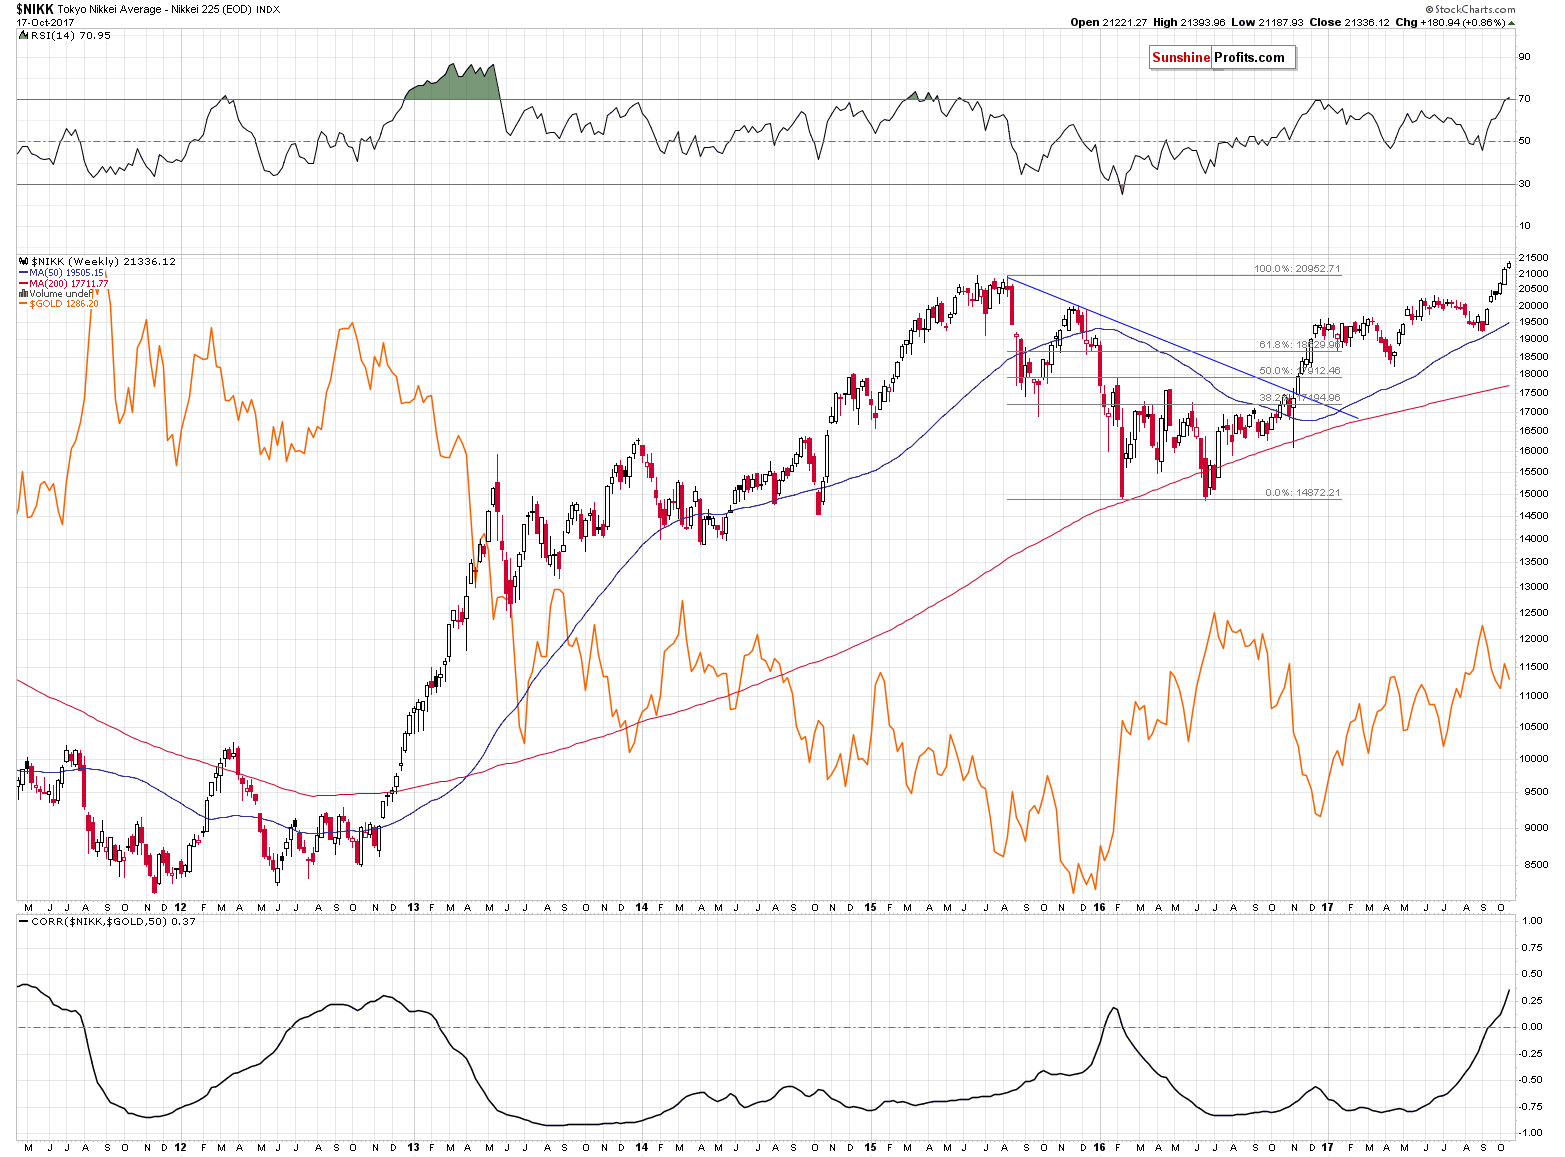
The implications of the gold-Nikkei link remain bearish as well. In Monday’s alert, we wrote the following:
The correlation between Nikkei 225 and gold moved above 0 and the RSI just moved to the 30 level. There was only one similar situation in the recent past and that is when Nikkei was breaking above its previous weekly high. Well, since the Nikkei just broke above its 2015 high in weekly terms, the situations are now very similar.
Back in 2015 it meant that a big rally was about to unfold and the same appears to be likely also this time. Why should we – gold and silver investors – bother with the above analysis? Because Japanese stocks tend to move in the opposite direction to the price of gold in the medium term (in the short-term their moves are not necessarily aligned).
In particular, we should care about the above because the only similar (in fact, very similar) situation in Nikkei was when gold was after the late-2012 top and was during a breather before the huge decline that took place in the following months. This is the same similarity that other long-term factors indicated previously, which means that this scenario is now even more likely to take place in the following weeks and months.
The thing that we would add today is that Japanese stocks continue to rally after the breakout. This means that the odds for its confirmation are high and the implications for gold are even more bearish for the following months.
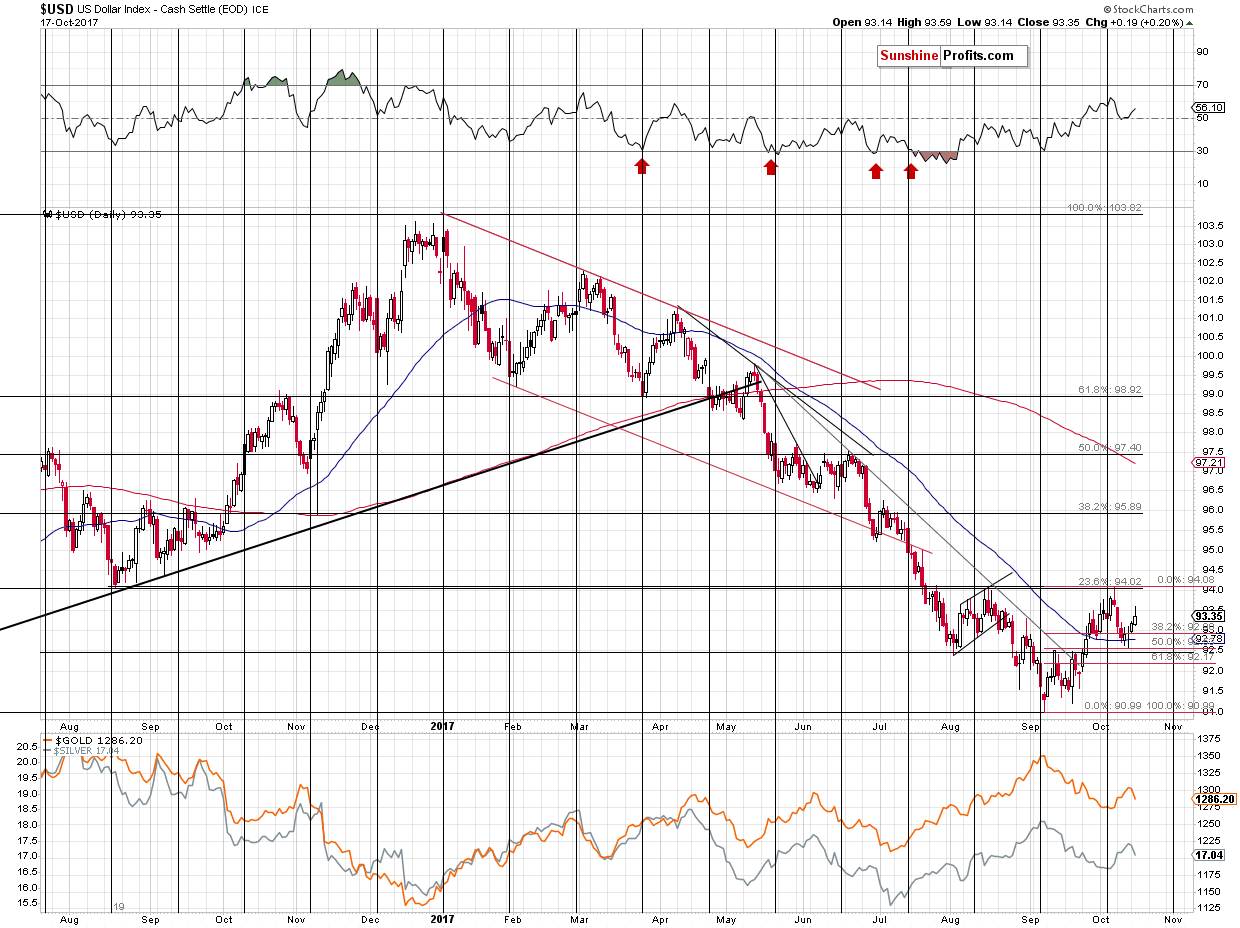
At the moment of writing these words, the USD Index is at about 93.68, which means that the rally continues beyond yesterday’s intraday high.
If the 94 level is broken and the breakout is confirmed, the USD Index will be likely to rally rather quickly based on the reverse head-and-shoulders formation (August and October lows being the shoulders) to the 96 – 97.5 area. The implications for gold would be bearish.
Summing up, it seems that the top in gold, silver and mining stocks is already in. On Friday, silver once again outperformed while miners disappointed, which was another classic bearish confirmation and the miners’ underperformance was seen also yesterday. Multiple bearish signals (i.a. gold’s huge monthly volume, the analogy in the HUI Index, the analogy between the two most recent series of interest rate hikes, and a breakout in Nikkei) point to much lower gold prices in the following months and the short-term signals also confirm the bearish outlook. Yesterday’s daily pause in mining stocks doesn’t seem to change anything as it was just a one-time event. If miners continue to show strength, the implications may become bullish, but this is not the case at this time.
As always, we will keep you – our subscribers – informed.
To summarize:
Trading capital (supplementary part of the portfolio; our opinion): Short positions (150% of the full position) in gold, silver and mining stocks are justified from the risk/reward perspective with the following stop-loss orders and initial target price levels / profit-take orders:
- Gold: initial target price level: $1,063; stop-loss: $1,366; initial target price for the DGLD ETN: $81.88; stop-loss for the DGLD ETN $38.74
- Silver: initial target price: $13.12; stop-loss: $19.22; initial target price for the DSLV ETN: $46.18; stop-loss for the DSLV ETN $17.93
- Mining stocks (price levels for the GDX ETF): initial target price: $9.34; stop-loss: $26.34; initial target price for the DUST ETF: $143.56; stop-loss for the DUST ETF $21.37
In case one wants to bet on junior mining stocks' prices (we do not suggest doing so – we think senior mining stocks are more predictable in the case of short-term trades – if one wants to do it anyway, we provide the details), here are the stop-loss details and initial target prices:
- GDXJ ETF: initial target price: $14.13; stop-loss: $45.31
- JDST ETF: initial target price: $417.04; stop-loss: $43.12
Long-term capital (core part of the portfolio; our opinion): No positions (in other words: cash)
Insurance capital (core part of the portfolio; our opinion): Full position
Important Details for New Subscribers
Whether you already subscribed or not, we encourage you to find out how to make the most of our alerts and read our replies to the most common alert-and-gold-trading-related-questions.
Please note that the in the trading section we describe the situation for the day that the alert is posted. In other words, it we are writing about a speculative position, it means that it is up-to-date on the day it was posted. We are also featuring the initial target prices, so that you can decide whether keeping a position on a given day is something that is in tune with your approach (some moves are too small for medium-term traders and some might appear too big for day-traders).
Plus, you might want to read why our stop-loss orders are usually relatively far from the current price.
Please note that a full position doesn’t mean using all of the capital for a given trade. You will find details on our thoughts on gold portfolio structuring in the Key Insights section on our website.
As a reminder – “initial target price” means exactly that – an “initial” one, it’s not a price level at which we suggest closing positions. If this becomes the case (like it did in the previous trade) we will refer to these levels as levels of exit orders (exactly as we’ve done previously). Stop-loss levels, however, are naturally not “initial”, but something that, in our opinion, might be entered as an order.
Since it is impossible to synchronize target prices and stop-loss levels for all the ETFs and ETNs with the main markets that we provide these levels for (gold, silver and mining stocks – the GDX ETF), the stop-loss levels and target prices for other ETNs and ETF (among other: UGLD, DGLD, USLV, DSLV, NUGT, DUST, JNUG, JDST) are provided as supplementary, and not as “final”. This means that if a stop-loss or a target level is reached for any of the “additional instruments” (DGLD for instance), but not for the “main instrument” (gold in this case), we will view positions in both gold and DGLD as still open and the stop-loss for DGLD would have to be moved lower. On the other hand, if gold moves to a stop-loss level but DGLD doesn’t, then we will view both positions (in gold and DGLD) as closed. In other words, since it’s not possible to be 100% certain that each related instrument moves to a given level when the underlying instrument does, we can’t provide levels that would be binding. The levels that we do provide are our best estimate of the levels that will correspond to the levels in the underlying assets, but it will be the underlying assets that one will need to focus on regarding the signs pointing to closing a given position or keeping it open. We might adjust the levels in the “additional instruments” without adjusting the levels in the “main instruments”, which will simply mean that we have improved our estimation of these levels, not that we changed our outlook on the markets. We are already working on a tool that would update these levels on a daily basis for the most popular ETFs, ETNs and individual mining stocks.
Our preferred ways to invest in and to trade gold along with the reasoning can be found in the how to buy gold section. Additionally, our preferred ETFs and ETNs can be found in our Gold & Silver ETF Ranking.
As a reminder, Gold & Silver Trading Alerts are posted before or on each trading day (we usually post them before the opening bell, but we don't promise doing that each day). If there's anything urgent, we will send you an additional small alert before posting the main one.
=====
Latest Free Trading Alerts:
On Sunday, there was a meeting of international central bankers. What does it imply for the gold market?
G30 Banking Seminar 2017 and Gold
=====
Hand-picked precious-metals-related links:
PRECIOUS-Gold slips as dollar firms on speculation over Fed chief
Gold industry sees prices rising to $1,369/oz over 12 months -LBMA
Goldman Sachs Says Gold Is Better Than Bitcoin
=====
In other news:
Higher U.S. yields push dollar up for a fifth day
There’s a Flashing Danger Sign for Germany’s DAX
Inflation is back. And this time the effects could be much worse
=====
Thank you.
Sincerely,
Przemyslaw Radomski, CFA
Founder, Editor-in-chief, Gold & Silver Fund Manager
Gold & Silver Trading Alerts
Forex Trading Alerts
Oil Investment Updates
Oil Trading Alerts

