

Briefly: in our opinion, full (300% of the regular position size) speculative short positions in mining stocks are justified from the risk/reward point of view at the moment of publishing this Alert.
Last week, mining stocks declined quite visibly, and it happened without significant help from the USD Index and from the general stock market. Silver and gold were practically flat week-over-week, so was the USD Index, and the general stock market (S&P 500) was up by 0.51%. This means that gold stocks and silver stocks should have closed the week relatively unchanged (as gold and silver did), or move somewhat higher (similarly to other stocks, as sometimes miners take their lead).
Instead, all important proxies for the mining stocks moved lower and closed the week at new daily and weekly 2021 lows. The HUI Index and the GDX ETF were down by about 3%, the silver stocks (SIL ETF) were down by 3.6%, and the GDXJ ETF (proxy for junior miners) was down by 3.83%, which means that our short position in the latter just became even more profitable.
Most importantly, it means that mining stocks continue to show weakness relative to gold, which tells us that the medium-term downtrend remains well intact. It also tells us that what I wrote previously about the medium-term link between the general stock market and mining stocks was most likely correct. Namely, that miners can decline without a decline in other stocks. A decline in the latter, will (as I still expect to see it sooner or later) simply exacerbate the decline’s volatility.
Let’s take a look at the charts, starting with the long-term HUI Index chart – the flagship proxy for gold stocks.
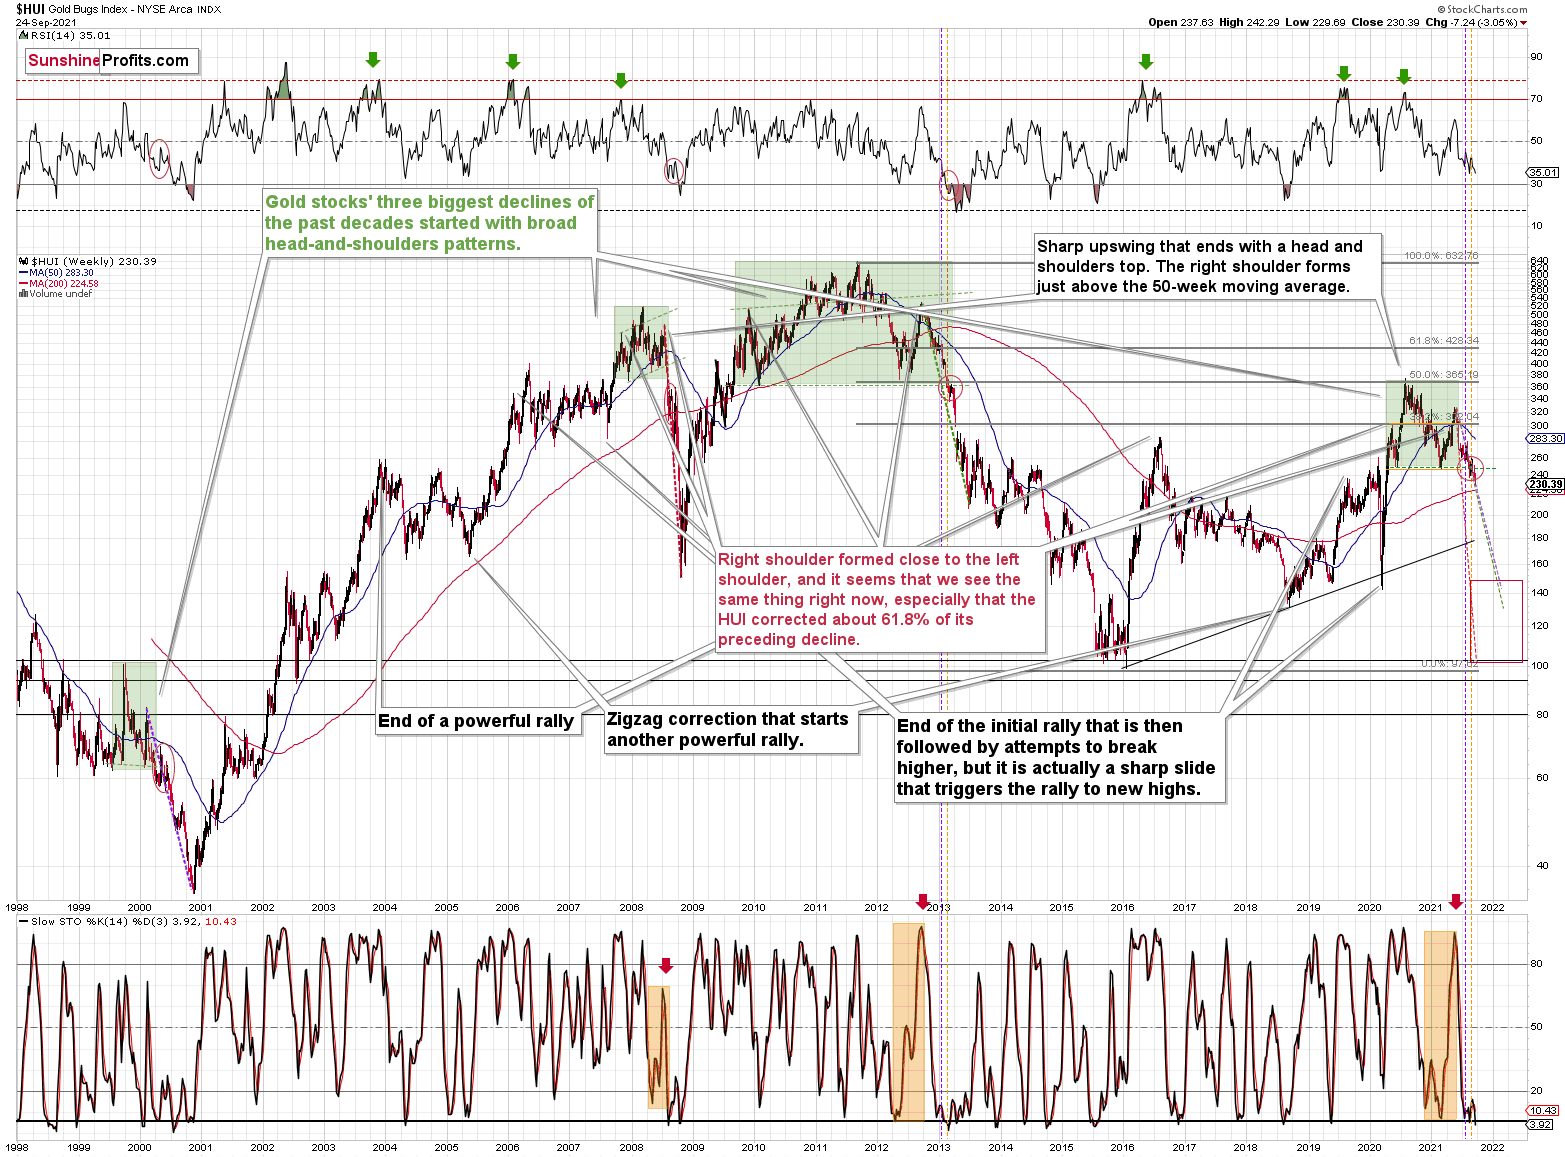
The clearest and most important thing that you can see on this chart is that gold miners continued their decline after completing – and verifying – the breakdown below the broad head and shoulders pattern (marked in green). Just like in the case of the previous similar patterns (also marked in green), mining stocks are likely to now decline profoundly. The 3% decline that we saw last week is likely just a small beginning of the entire slide.
Yes, the Stochastic indicator is very oversold, but please note that it was the same in 2013 during the powerful post-head-and-shoulders-breakdown slide. And it didn’t cause the decline to end or reverse.
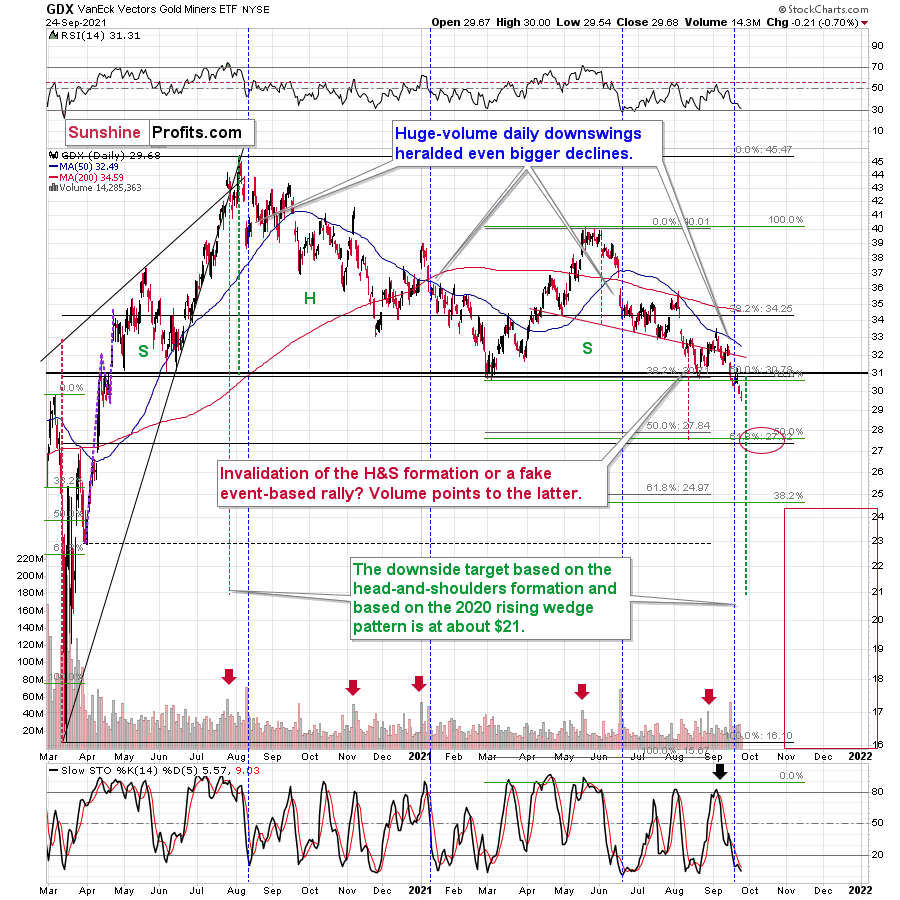
The breakdown to yearly lows is also crystal-clear in case of the GDX ETF. The weekly close below the previous 2021 lows is critical, but it’s worth noting that it was also a close below the psychologically important (as its round) $30 level.
The next target for the GDX ETF is based mainly on the 61.8% Fibonacci retracement level based on the entire 2020 rally. The previous retracements worked quite well, so it seems that this technique shouldn’t be ignored.
The 38.2% retracement served as support in November 2020. The decline below this level triggered a short-term rebound.
The 50% retracement served as support in March and August 2021. This level was particularly strong as it corresponded to the previous – May and June 2020 – lows. Reaching this level triggered rebounds. The first one was quite significant, and the second one was of only short-term importance.
When the GDX ETF moves to its 61.8% it’s likely to rebound in the short term (and probably in the short term only), not only because of the retracement itself, but also because two additional techniques confirm this level as a short-term target. One is the support provided by the late-March 2020 high, and the other is the previous head and shoulders pattern that formed between April and early August 2021. Based on the size of the head (red, dashed lines), GDX is likely to decline to about $28.
And while the GDX is likely to decline, so is its counterpart focused on junior mining stocks – the GDXJ ETF.
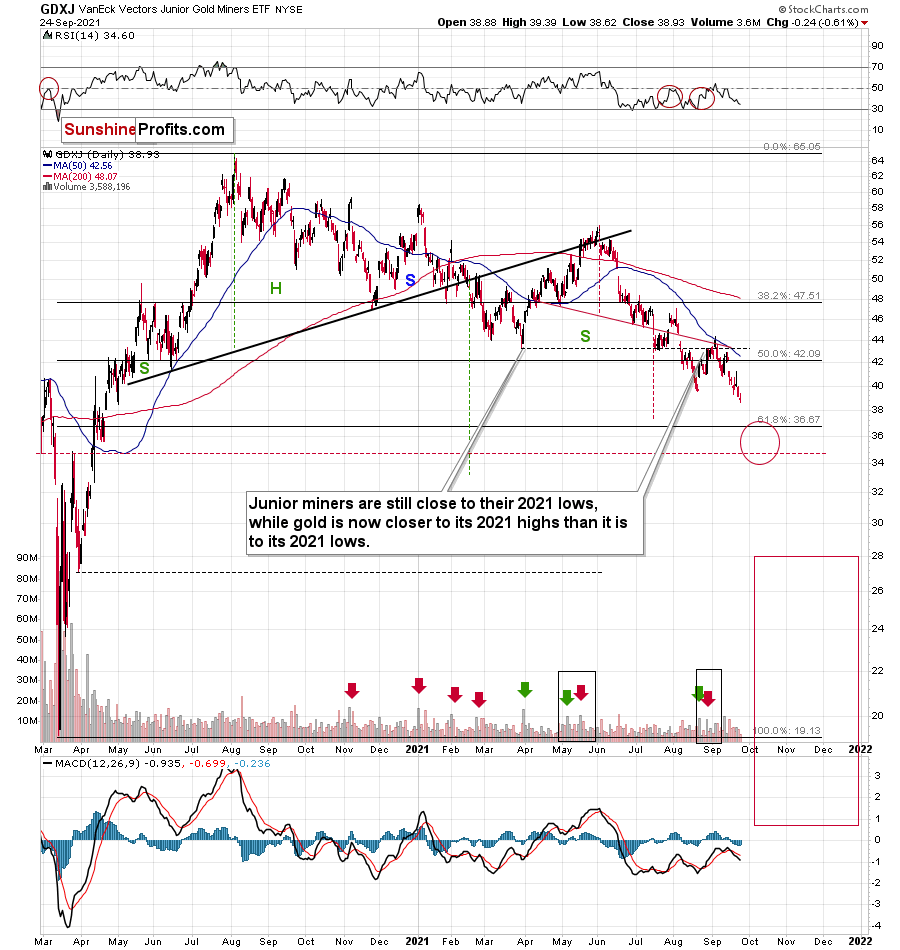
In the case of the GDXJ, the downside target is broader, as the 61.8% Fibonacci retracement, the late-March 2020 high, and the head-and-shoulders-based target are not so aligned.
A decline to the 61.8% Fibonacci retracement here would more or less correspond to the analogous move in the GDX in percentage terms. However, if the junior miners underperform (as they’ve been underperforming seniors for months), they could move even lower before rebounding.
On a different note, let’s take a look at what’s happening in a less popular part of the precious metals sector – palladium.
On Sep. 7, I wrote the following:
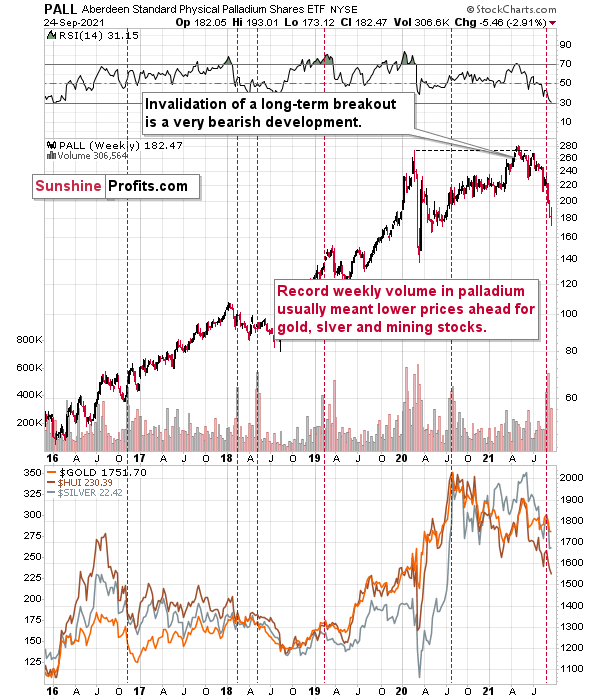
Also adding credibility to the conclusions drawn from the volume spikes in the GDX ETF and the GDXJ ETF, last week, the Aberdeen Standard Physical Palladium Shares (PALL) ETF recorded a new 2021 high for weekly volume. And with abnormal volume offering a window into investor sentiment, historical euphoria preceded minor-to-massive declines in gold and silver (the red vertical dashed lines below). As a result, several areas of the precious metals market are sounding the alarm.
Last week’s volume spike was an anomaly, and whenever we see one on a given market, it’s useful to check what happened when we saw it previously. At times, you can notice some regularities – a pattern. And such a pattern could have important trading implications. That’s the case with palladium volume spikes, which – while rather inconsequential for palladium itself – were practically always followed by lower gold, silver, and mining stock prices. The implications for the said markets for the following weeks are thus bearish.
And indeed, the precious metals sector declined right after that volume spike. So far, the decline was only modest from the long-term point of view. Since some of the declines that followed the previous huge-volume signals from palladium were much bigger (especially the one following the 2020 top), we might see even lower prices of PMs and miners in the next weeks and months as well.
Having said that, let’s take a look at gold.
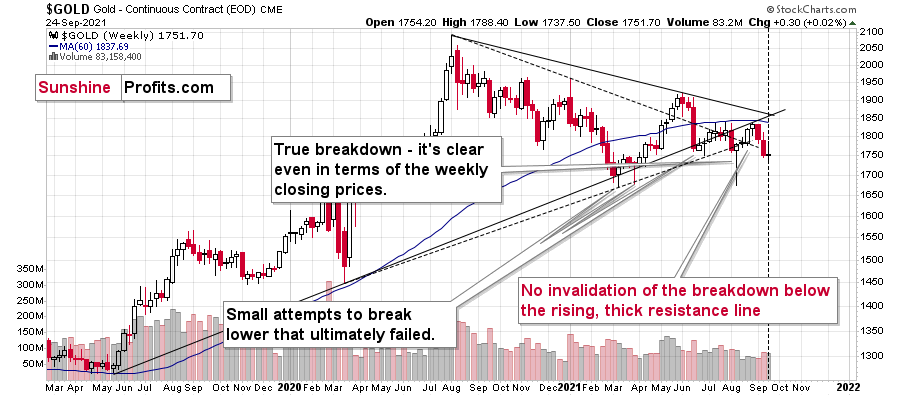
After an early-week rally, gold gave away its gains and ended the week only $0.30 higher. This may not seem like a big deal, until one notices that it means that we saw another weekly close below the April and August lows in terms of the weekly prices. In other words, last week’s “inaction” was bearish.
The thing that might appear perplexing at this time is gold’s upcoming triangle-vertex-based reversal. The perplexing detail is its exact timing. Looking at the exact moment when the lines cross, we get a point that actually somewhat between the previous week and this week. This, plus the fact that these reversals might work on a near-to basis suggests that we might see an important bottom sometime this week. It’s not crystal clear, but it appears quite likely.
In fact, gold miners’ weakness suggests exactly that.
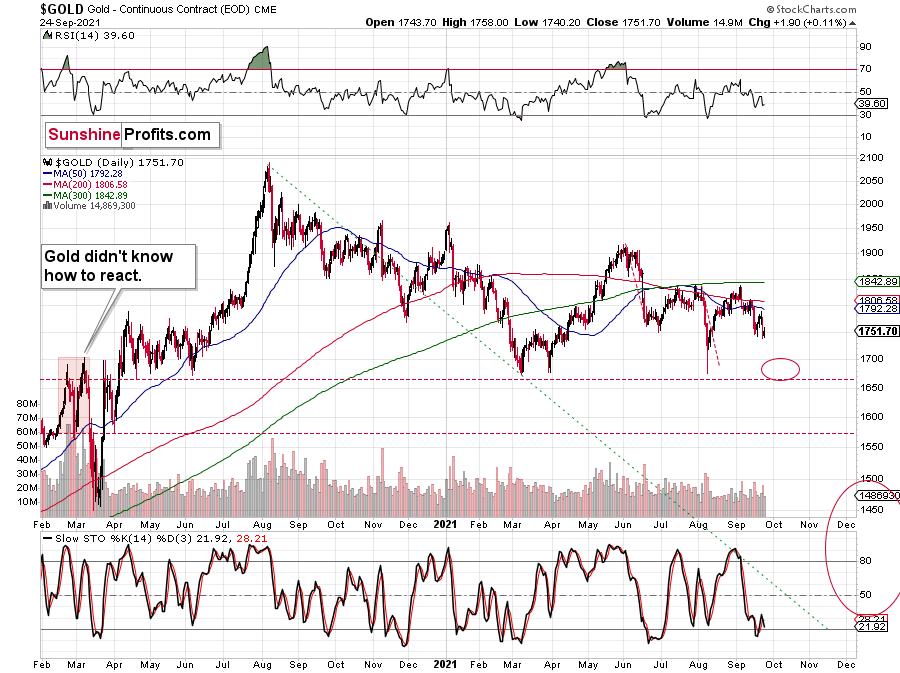
On a short-term basis, gold hasn’t changed much – it moved to its recent September lows, but based on the weekly chart, we know that there was actually a more important breakdown.
Please note that gold’s back-and-forth decline (three local tips in September) is in near-perfect tune with how gold declined initially in 2013.
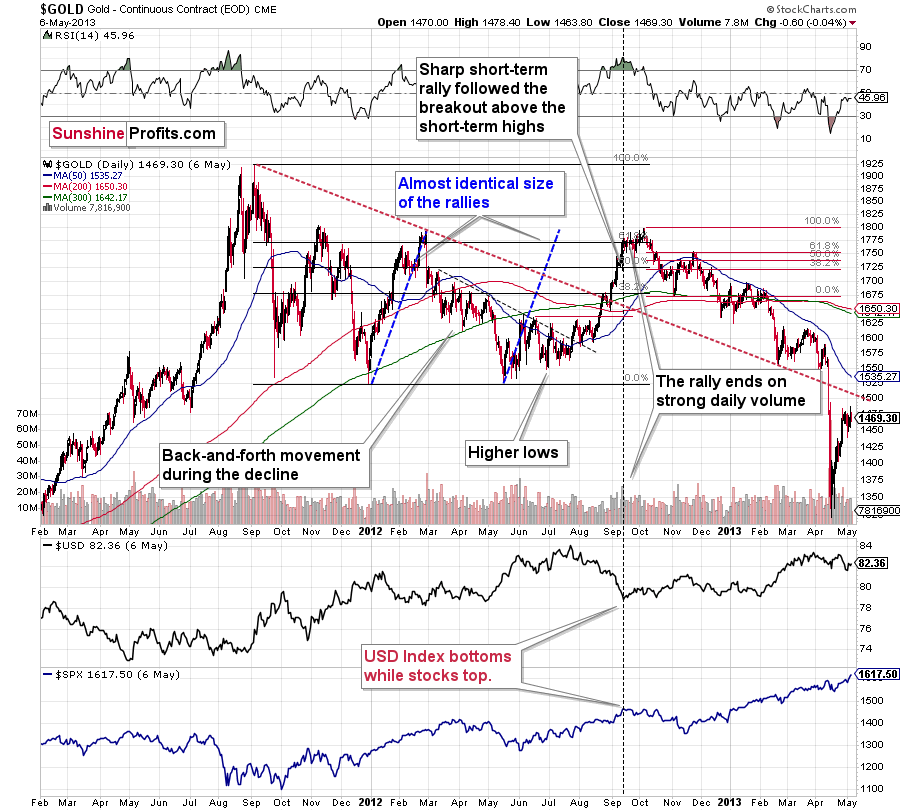
Between September 2012 and February 2013, gold declined in a back-and-forth manner as well, and the current situation seems to be analogous to what we saw in February 2013. At the time, the final short-term upswing took gold to its 50-day moving average (marked with blue), and we saw something very similar recently. The recent high ($1788.40) was very close to gold’s 50-day moving average too – less than $10 from it.
You can see the comparison even more clearly in the video that I posted on Wednesday (Sep. 22) – on a side note, I was recording this when gold was moving higher - right to its Sep. 22 top. So, it turns out that I said that gold might top close to its 50-day moving average instead of rallying higher, right before exactly that happened.
Having said that, let’s move to silver.
Silver – just like gold – hasn’t changed much on a week-to-week basis. It was up by mere $0.09.
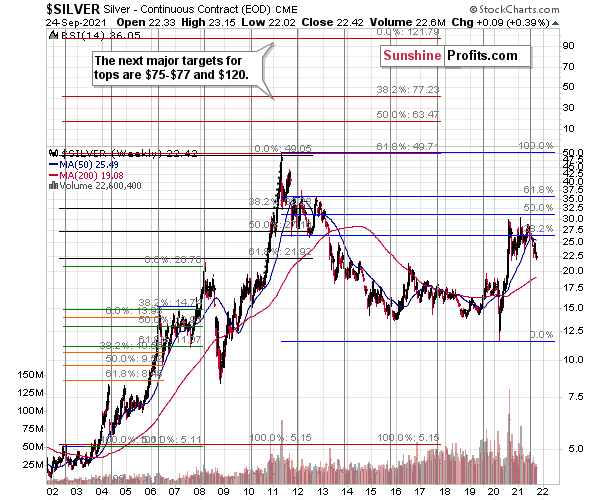
This means that silver’s medium-term downtrend continues. It started at silver’s long-term cyclical turning point earlier this year, and it continues up to this day.
Is the decline over or close to being over? Probably not.
Silver didn’t reach any of its strong support levels yet, and its already trading at new 2021 lows. The breakdown below the previous lows was already confirmed, and it’s more clearly visible on silver’s short-term chart.
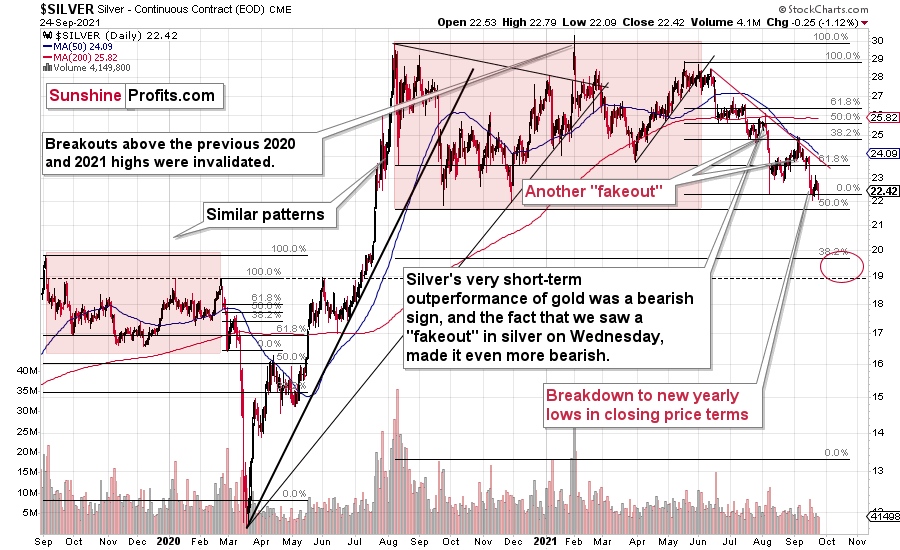
Friday’s (Sep. 24) close was not the lowest that we saw in 2021, but it was the third lowest close since July 2020. The breakdown below not only the 2021 lows, but also below the September and November 2021 lows is quite clear in terms of the closing prices.
Naturally, the implications of the above-mentioned breakdown are bearish.
The next target is provided by the previous highs – the ones that we saw in September 2019 and January/February 2020. In other words, silver is likely to move to the $20 level or even below it.
That’s likely to be just an interim bottom that’s likely to trigger a corrective upswing, but it’s unclear if the latter is going to be significant. What’s more clear is that after the upswing, another big move lower is likely to take place.
Why? Because the history rhymes, and it seems that we’re seeing the 2013 decline all over again. This doesn’t mean that silver is likely to fall as long as it did then, but it means that it’s likely to fall quite visibly before it rebounds. And a decline to $20 is not big enough to be similar to what we saw in 2013.
Finally, let’s take a look at the USD Index and the situation in it.
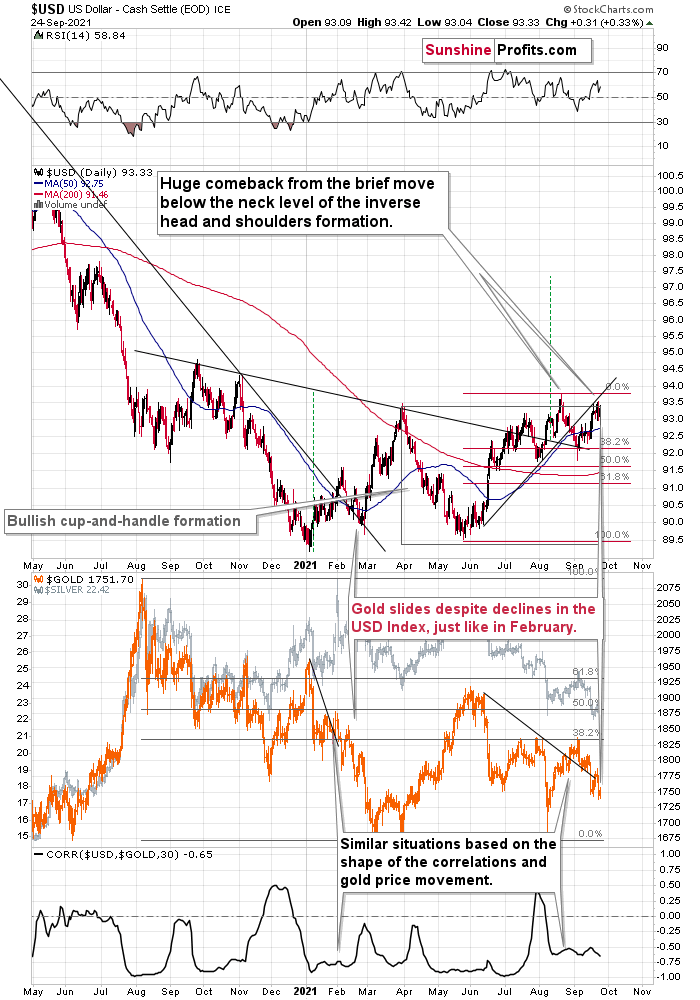
The USD Index is consolidating right below the previous highs, and once it finally breaks above them, it’s likely to rally significantly. This might serve as a trigger for a big decline in gold.
This is particularly the case, since gold invalidated its breakout above the short-term, declining resistance line.
Having said that, let’s move to the fundamental part of today’s analysis.
Interesting Developments
After a mini taper tantrum erupted on Sep. 23, the U.S. 10-Year Treasury yield jumped to its highest level in nearly three months. And with higher long-term interest rates cooling investors’ interest in gold, the yellow metal gave back all of its early-week gains. Moreover, with Treasury yields’ surge sinking the copper/U.S. 10-Year Treasury yield ratio to its lowest level since late June, follow-through by the yellow metal implies a gold futures price of roughly $1,690.
Please see below:
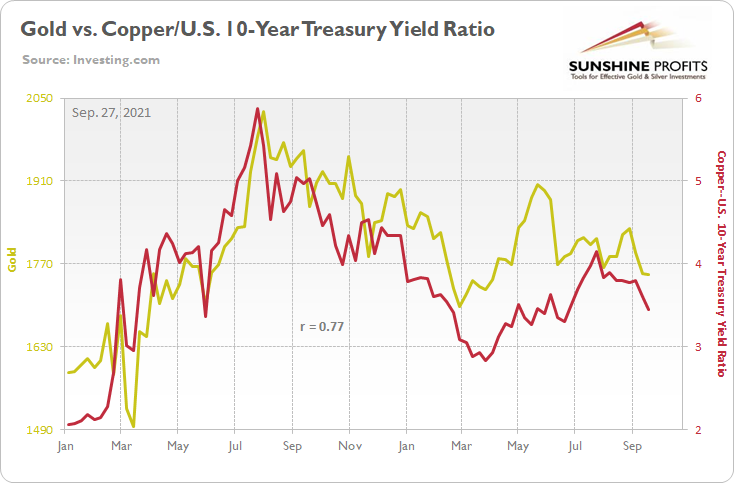
To explain, the red line above tracks the copper/U.S. 10-Year Treasury yield ratio, while the gold line above tracks the gold futures price. Outside of a short-term decoupling in May, the ratio has been a reliable predictor of the yellow metal’s future path. And with the former predicting further downside ahead, gold’s slide likely has more room to run.
To that point, with Fed Chairman Jerome Powell revealing on Sep. 22 that “I guess my own view is the test for substantial further progress on employment is all but met… [and that] a gradual tapering process that concludes around the middle of next year is likely to be appropriate,” the PMs’ medium-term outlook remains quite treacherous.
For one, the U.S. 10-Year real (inflation-adjusted) yield has increased by 29 basis points (0.29%) since Aug. 3. And with the Fed’s ~$120 billion worth of monthly bond purchases distorting the thinly traded market for Treasury Inflation-Protected Securities (TIPS), the end of QE could result in a material increase in U.S. real yields.
To explain, the Fed owns roughly 22% of the TIPS outstanding and the central bank’s bond-buying program has increased prices, reduced real yields and put upward pressure on breakeven inflation rates. However, if Powell’s taper timeline proves prescient, lower TIPS purchases could increase U.S. real yields and put further downward pressure on the PMs.
“The demand for inflation-linked securities has gone through the roof over the last 15 months because headline inflation has been going higher,” said Bhanu Baweja, chief strategist at UBS. “The supply of TIPS has been falling because the Fed has been intervening through its QE. Both will change.” To that point, with Baweja predicting that the U.S. 10-Year real yield will rise to roughly -0.50% in the coming months – which is 40 basis points higher than the Sep. 24 close – the PMs are unlikely to celebrate the prospective move.
Likewise, James Athey, a Senior Investment Manager on the Rates Management team at Aberdeen Standard Investments, added that U.S. real yields are “heavily distorted” and that TIPS will “suffer as the result of the taper.”
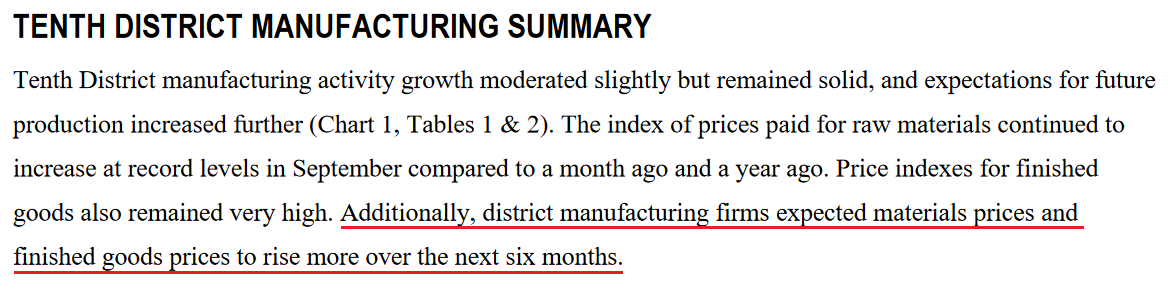
In the meantime, though, the bond market’s mini taper tantrum was likely an exercise of front-running the Fed’s eventual unwind. However, with inflation still surging, the Fed’s rate-hike cycle could accelerate if the taper doesn’t get the pricing pressures under control. Case in point: the Kansas City Fed released its Tenth District Manufacturing Activity Survey on Sep. 23. And while the headline index declined from 29 in August to 23 in September, inflationary pressures remain elevated.
Please see below:
 Source: KC Fed
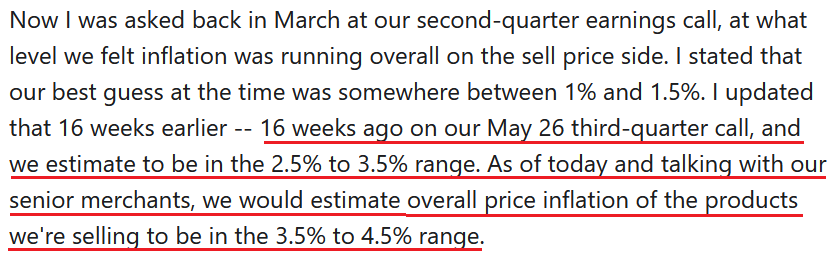
Even more revealing, Costco released its fourth-quarter earnings on Sep. 23. And with CFO Richard Galanti labeling surging freight costs as “permanent inflationary items,” he added that the current environment is “somewhat permanent.”
He said:
“As I discussed on last quarter's call, inflationary factors abound: higher labor costs, higher freight costs, higher transportation demand, along with container shortages and port delays, increased demand in certain product categories, various shortages of everything from computer chips to oils and chemicals, higher commodities prices.
“Price increases of pulp and paper goods, some items up 4% to 8%. Again, we're trying to mitigate those where we can, and we think we've done a decent job of mitigating some of it. Plastics, resin increases on things like trash bags, Ziploc SKUs, pet products -- resin or [Inaudible] PET products, plastic cups, plates, plastic wrap, many items up in the 5% to 11% range. Metals, again, aluminum foil, mid-single-digit cost increases, as well as cans for sodas and other beverages.
“I mentioned commodities earlier, oil, coffee, nuts, they remain generally according to our buyers at five-year highs and so on. Higher import prices on things from Europe like cheeses, but the combination of freight and FX. 3% to 10% increases on certain but not all apparel items. And fresh foods, inflation is up in the mid- to high single digits, with meat leading the way, up high single to low double digits due to feed, labor and transportation costs.”
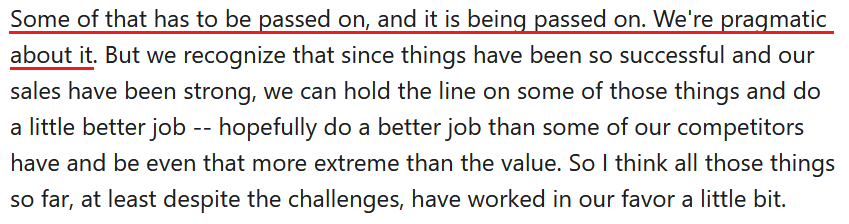
Moreover, increasing the company’s inflationary guidance for the second time, he added:
 Source: Costco/The Motley Fool
For context, I warned on Mar. 30 that the cost-push inflationary spiral was poised to persist.
I wrote:
Didn’t Powell insist that near-term inflation was only “one-time” and “transient?” Well, despite government-issued CPI data failing to capture the effect of the Fed’s liquidity circus, pricing pressures are popping up everywhere. And with corporations’ decision tree left to raising prices or accepting lower margins, which one do you think they’re likely to choose?
To that point, with Costco opting for the latter, Galanti added that “to the extent that there's permanent inflationary items like freight costs or even somewhat permanent for the next year, we can't hold on to all those.”
As a result:
 Source: Costco/The Motley Fool
For context, Costco is no small fry. The company is ranked fifth on the National Retail Federation’s (NRF) list of the Top 100 Retailers in the U.S. Thus, the company’s behavior is extremely important.
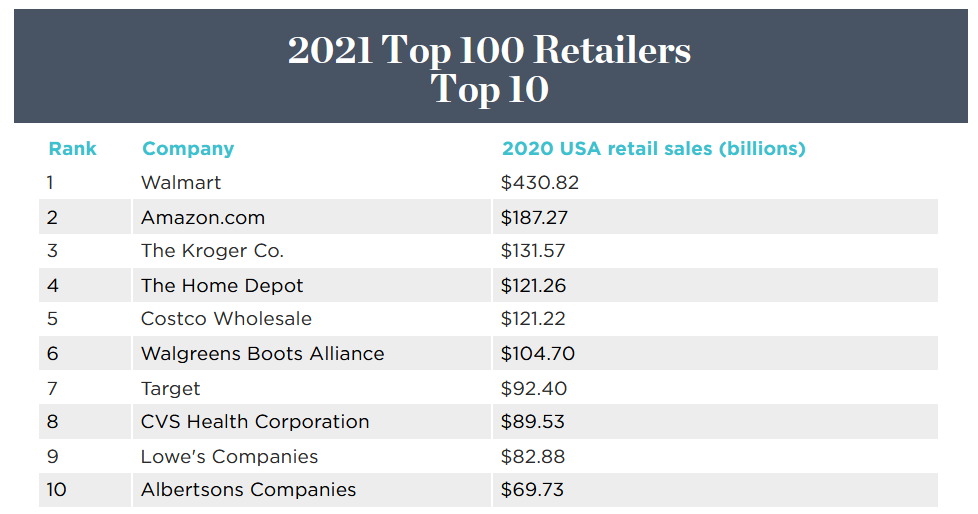 Source: NRF
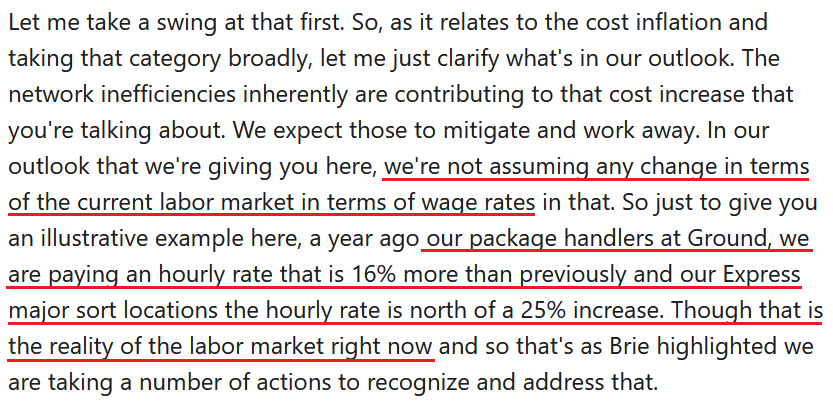
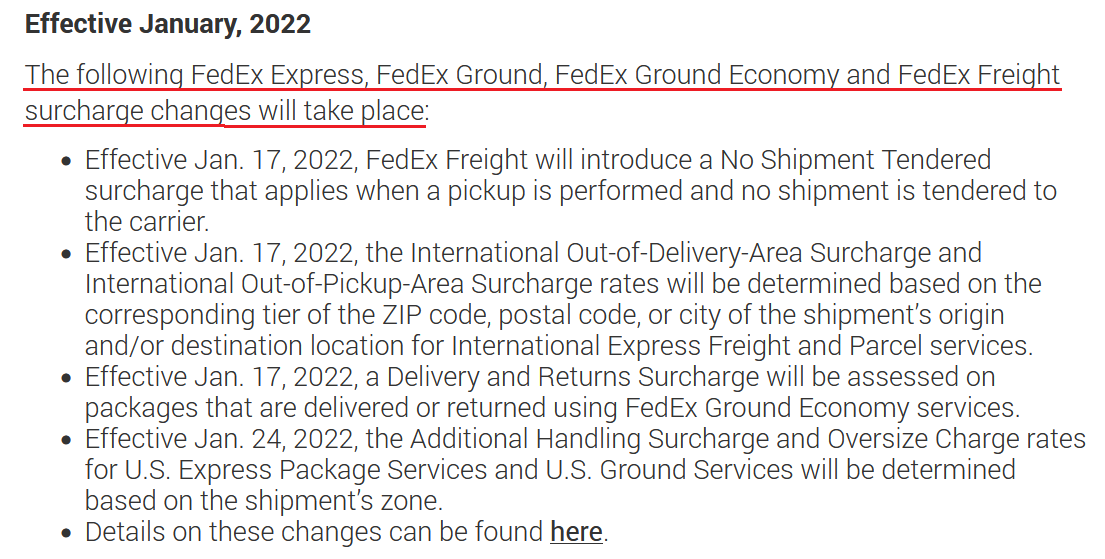
Adding to Powell’s conundrum, FedEx sounded the alarm on both input and wage inflation. After the company’s first-quarter earnings came in weaker than expected on Sep. 21, CFO Mike Lenz lamented “the difficult labor market” and said that the cost pressures added “an estimated $450 million in additional year-over-year costs.”
“I want to break this impact into two components,” he said. “Higher wages and the impact of network inefficiencies. Of the $450 million we estimate that $200 million was incurred in higher wage and purchased transportation rates. This included higher wage rates and pay premiums for team members and higher rates paid for third-party transportation services. In addition to the higher wage rates, we estimate that network inefficiencies of approximately $250 million contributed to the total impact of labor shortages on the business. These costs include additional linehaul, higher usage of third-party transportation, cost to reposition assets in the network, over time and recruiting incentives all to address staffing shortages.”
And how high is high?
 Source: FedEx/The Motley Fool
And surprise, surprise, how is the company responding to the inflationary pressures?
 Source: FedEx
For context, FedEx’s 2022 surcharges represent price increases of 5.9% to 7.9% depending on the service. What’s more, the statement revealed that, “a fuel surcharge increase will be applied to FedEx Express (domestic package and freight services), FedEx Ground, and FedEx Freight shipments beginning November 1, 2021.” For context, like its counterpart Costco, FedEx is no small fry either:
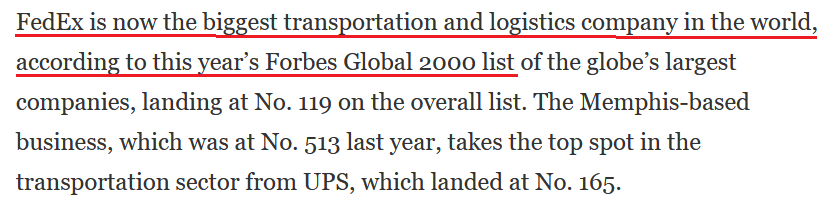 Source: Forbes
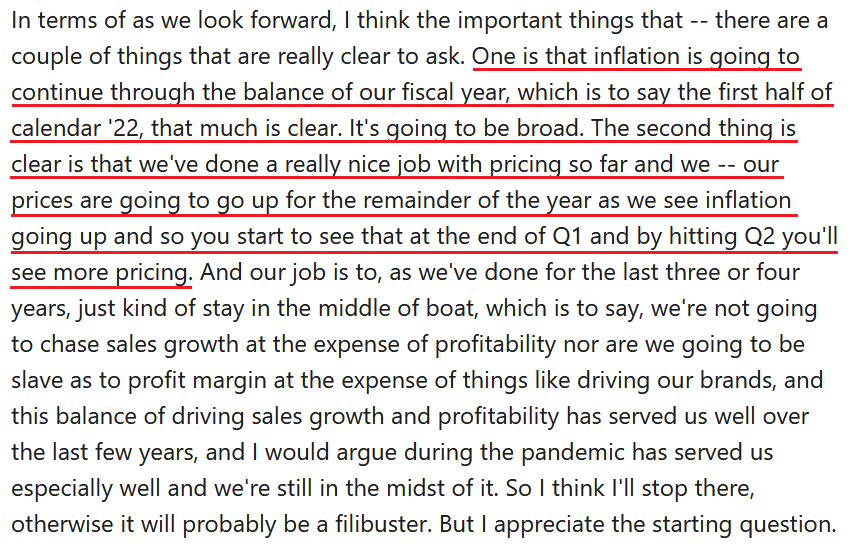
Finally, General Mills – the world's sixth-largest food company – also has its pedal to the inflationary metal. For context, General Mills is the maker of Cheerios cereal, Häagen-Dazs ice cream and Nature Valley snacks & bars. CEO Jeffrey L. Harmening said during the company’s first-quarter earnings call on Sep. 22:
 Source: General Mills/The Motley Fool
The bottom line?
While Powell surprised investors with his hawkish rhetoric on Sep. 22, the long-end of the U.S. yield curve’s delayed reaction could be a sign of things to come. Furthermore, with inflation surging and the Fed’s taper timeline already known, investors remain sanguine since FOMC participants are split 50/50 when it comes to a 2022 rate hike. However, if the inflationary rush continues and Powell’s accelerated taper fails to quell the momentum, another pull-forward of the FOMC’s ‘dot plot’ could result in another sell-off of the PMs.
In conclusion, it was another day of underperformance for the gold miners on Sep. 24. And while Powell’s hawkish shift shifted the narrative across the financial markets, the Fed chief still remains behind the inflationary curve. Moreover, with the pricing pressures poised to persist for much longer than he expects, the FOMCs 2022 PCE Index projection could be revised upward again in the coming months. More importantly, though, if investors fear that Powell has lost control of inflation, several assets, including the PMs, could suffer mightily.
Overview of the Upcoming Part of the Decline
- It seems to me that the corrective upswing in gold is over, and the big decline seems to be already underway.
- It seems that the first stop for gold will be close to its previous 2021 lows, slightly below $1,700. Then it will likely correct a bit, but it’s unclear if I want to exit or reverse the current short position based on that – it depends on the number and the nature of the bullish indications that we get at that time.
- After the above-mentioned correction, we’re likely to see a powerful slide, perhaps close to the 2020 low ($1,450 - $1,500).
- If we see a situation where miners slide in a meaningful and volatile way while silver doesn’t (it just declines moderately), I plan to switch from short positions in miners to short positions in silver. At this time, it’s too early to say at what price levels this could take place, and if we get this kind of opportunity at all – perhaps with gold close to $1,600.
- I plan to exit all remaining short positions when gold shows substantial strength relative to the USD Index while the latter is still rallying. This might take place with gold close to $1,350 - $1,400. I expect silver to fall the hardest in the final part of the move. This moment (when gold performs very strongly against the rallying USD and miners are strong relative to gold after its substantial decline) is likely to be the best entry point for long-term investments, in my view. This might also happen with gold close to $1,375, but it’s too early to say with certainty at this time. I expect the final bottom to take place near the end of the year, perhaps in mid-December.
- As a confirmation for the above, I will use the (upcoming or perhaps we have already seen it?) top in the general stock market as the starting point for the three-month countdown. The reason is that after the 1929 top, gold miners declined for about three months after the general stock market started to slide. We also saw some confirmations of this theory based on the analogy to 2008. All in all, the precious metals sector is likely to bottom about three months after the general stock market tops.
- The above is based on the information available today, and it might change in the following days/weeks.
You will find my general overview of the outlook for gold on the chart below:
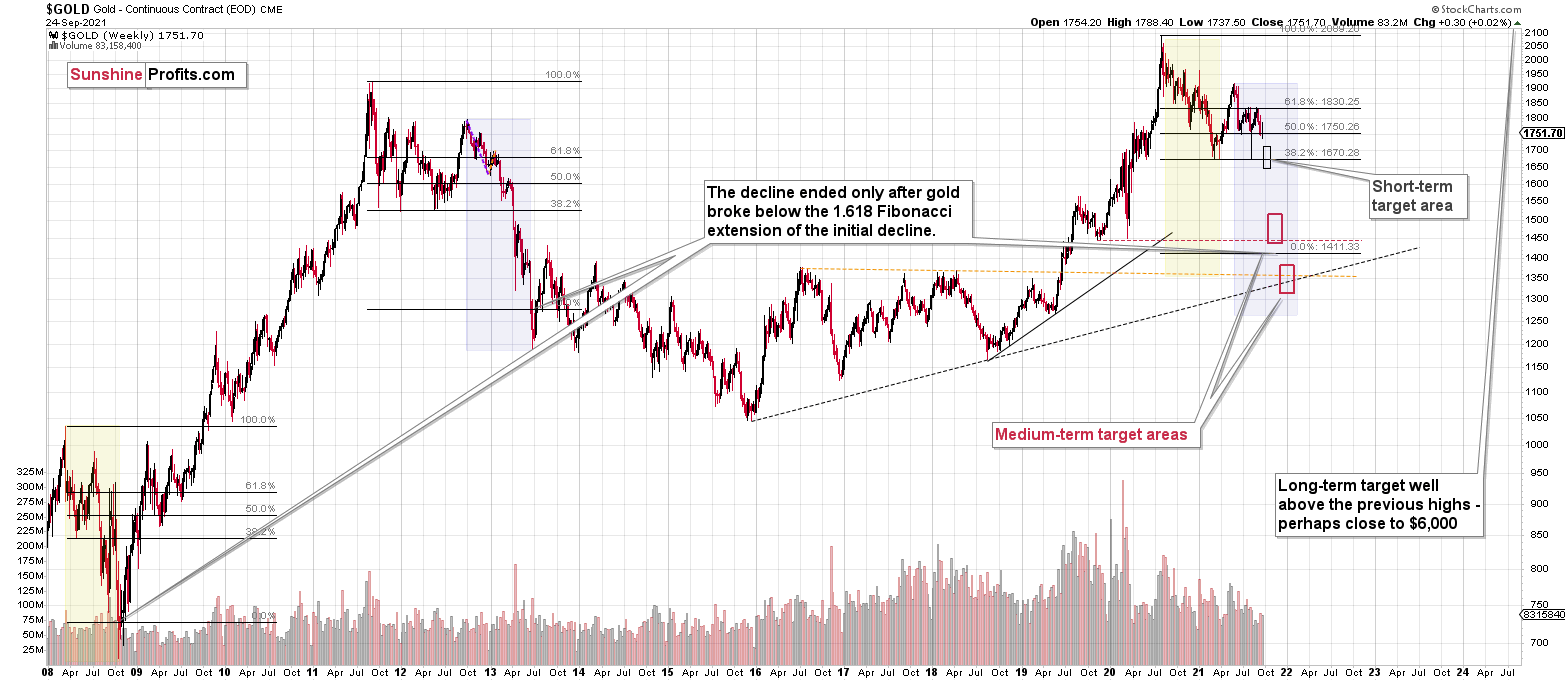
Please note that the above timing details are relatively broad and “for general overview only” – so that you know more or less what I think and how volatile I think the moves are likely to be – on an approximate basis. These time targets are not binding or clear enough for me to think that they should be used for purchasing options, warrants or similar instruments.
Summary
To summarize, the outlook for the precious metals sector remains extremely bearish for the next few months.
The decline to new lows in practically all important proxies for mining stocks despite lack thereof in gold served as an important short-term confirmation for the bearish case. However, the key two long-term factors remain the analogy to 2013 in gold and the broad head and shoulders pattern in the HUI Index. They both suggest much lower prices ahead.
It seems that our profits from the short positions are going to become truly epic in the following weeks.
After the sell-off (that takes gold to about $1,350 - $1,500), I expect the precious metals to rally significantly. The final part of the decline might take as little as 1-5 weeks, so it's important to stay alert to any changes.
Most importantly, please stay healthy and safe. We made a lot of money last March and this March, and it seems that we’re about to make much more on the upcoming decline, but you have to be healthy to enjoy the results.
As always, we'll keep you - our subscribers - informed.
By the way, we’re currently providing you with the possibility to extend your subscription by a year, two years or even three years with a special 20% discount. This discount can be applied right away, without the need to wait for your next renewal – if you choose to secure your premium access and complete the payment upfront. The boring time in the PMs is definitely over, and the time to pay close attention to the market is here. Naturally, it’s your capital, and the choice is up to you, but it seems that it might be a good idea to secure more premium access now while saving 20% at the same time. Our support team will be happy to assist you in the above-described upgrade at preferential terms – if you’d like to proceed, please contact us.
To summarize:
Trading capital (supplementary part of the portfolio; our opinion): Full speculative short positions (300% of the full position) in mining stocks are justified from the risk to reward point of view with the following binding exit profit-take price levels:
Mining stocks (price levels for the GDXJ ETF): binding profit-take exit price: $35.73; stop-loss: none (the volatility is too big to justify a stop-loss order in case of this particular trade)
Alternatively, if one seeks leverage, we’re providing the binding profit-take levels for the JDST (2x leveraged) and GDXD (3x leveraged – which is not suggested for most traders/investors due to the significant leverage). The binding profit-take level for the JDST: $16.96; stop-loss for the JDST: none (the volatility is too big to justify a SL order in case of this particular trade); binding profit-take level for the GDXD: $35.46; stop-loss for the GDXD: none (the volatility is too big to justify a SL order in case of this particular trade).
For-your-information targets (our opinion; we continue to think that mining stocks are the preferred way of taking advantage of the upcoming price move, but if for whatever reason one wants / has to use silver or gold for this trade, we are providing the details anyway.):
Silver futures upside profit-take exit price: unclear at this time - initially, it might be a good idea to exit, when gold moves to $1,683
Gold futures upside profit-take exit price: $1,683
HGD.TO – alternative (Canadian) inverse 2x leveraged gold stocks ETF – the upside profit-take exit price: $11.38
Long-term capital (core part of the portfolio; our opinion): No positions (in other words: cash
Insurance capital (core part of the portfolio; our opinion): Full position
Whether you already subscribed or not, we encourage you to find out how to make the most of our alerts and read our replies to the most common alert-and-gold-trading-related-questions.
Please note that we describe the situation for the day that the alert is posted in the trading section. In other words, if we are writing about a speculative position, it means that it is up-to-date on the day it was posted. We are also featuring the initial target prices to decide whether keeping a position on a given day is in tune with your approach (some moves are too small for medium-term traders, and some might appear too big for day-traders).
Additionally, you might want to read why our stop-loss orders are usually relatively far from the current price.
Please note that a full position doesn't mean using all of the capital for a given trade. You will find details on our thoughts on gold portfolio structuring in the Key Insights section on our website.
As a reminder - "initial target price" means exactly that - an "initial" one. It's not a price level at which we suggest closing positions. If this becomes the case (like it did in the previous trade), we will refer to these levels as levels of exit orders (exactly as we've done previously). Stop-loss levels, however, are naturally not "initial", but something that, in our opinion, might be entered as an order.
Since it is impossible to synchronize target prices and stop-loss levels for all the ETFs and ETNs with the main markets that we provide these levels for (gold, silver and mining stocks - the GDX ETF), the stop-loss levels and target prices for other ETNs and ETF (among other: UGL, GLL, AGQ, ZSL, NUGT, DUST, JNUG, JDST) are provided as supplementary, and not as "final". This means that if a stop-loss or a target level is reached for any of the "additional instruments" (GLL for instance), but not for the "main instrument" (gold in this case), we will view positions in both gold and GLL as still open and the stop-loss for GLL would have to be moved lower. On the other hand, if gold moves to a stop-loss level but GLL doesn't, then we will view both positions (in gold and GLL) as closed. In other words, since it's not possible to be 100% certain that each related instrument moves to a given level when the underlying instrument does, we can't provide levels that would be binding. The levels that we do provide are our best estimate of the levels that will correspond to the levels in the underlying assets, but it will be the underlying assets that one will need to focus on regarding the signs pointing to closing a given position or keeping it open. We might adjust the levels in the "additional instruments" without adjusting the levels in the "main instruments", which will simply mean that we have improved our estimation of these levels, not that we changed our outlook on the markets. We are already working on a tool that would update these levels daily for the most popular ETFs, ETNs and individual mining stocks.
Our preferred ways to invest in and to trade gold along with the reasoning can be found in the how to buy gold section. Furthermore, our preferred ETFs and ETNs can be found in our Gold & Silver ETF Ranking.
As a reminder, Gold & Silver Trading Alerts are posted before or on each trading day (we usually post them before the opening bell, but we don't promise doing that each day). If there's anything urgent, we will send you an additional small alert before posting the main one.
Thank you.
Przemyslaw Radomski, CFA
Founder, Editor-in-chief

