

Briefly: in our opinion, full (250% of the regular size of the position) speculative short position in gold, silver, and mining stocks is justified from the risk/reward perspective at the moment of publishing this Alert.
Gold is still hanging close to the $1,300 mark. Tensions with Iran remains high and the China trade dispute hasn't been resolved so far. Yet gold hasn't really gained since Monday. Neither silver or gold stocks. This short-term stalemate is getting long in the tooth. What kind of catalyst does the precious metals market need in order to wake up from its slumber? Better yet, does it need any catalyst at all? You may remember our recent exclusive article shining light on the truth about gold price triggers. Let's see how it fits today's situation.
Today's Alert is going to be short and there are two reasons for it. First, our regular chart provider - Stockcharts.com - has some technical difficulties and all charts that we're working with, are unreadable. The data for the last couple of years is missing, which makes any analysis of recent price moves impossible. Naturally, we would have delivered the charts through some other provider if it wasn't for the second reason. The second reason is that practically nothing changed in gold, silver, or mining stocks yesterday, so we have nothing new to show you anyway.
Here's how the gold and silver intraday charts look like.
Gold and Silver Close to Unchanged
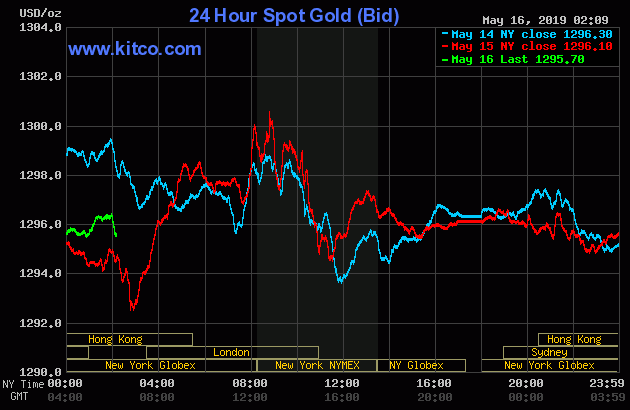
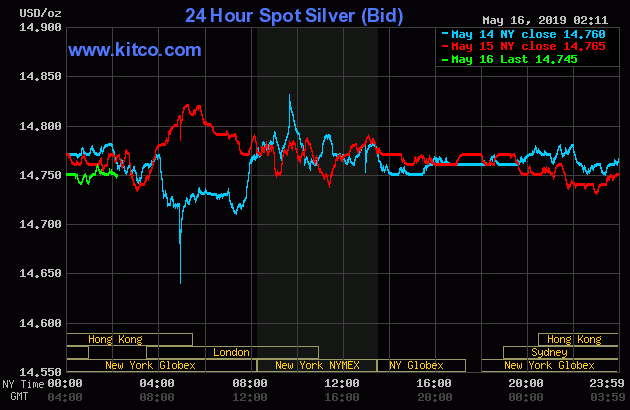
Both metals closed their sessions almost exactly where they had closed it on Tuesday. At the moment of writing these words, they are trading very close to where they were trading just 24 hours earlier. Consequently, everything that we wrote yesterday remains up-to-date and if you haven't had the chance to read yesterday's analysis yet, now would be a good time to do so.
Gold made another attempt to move above $1,300 and it failed. Another reversal adds to the bearish side of the outlook.
Now, instead of calling it a day, we will take this opportunity to reply to two questions that we just received.
From the Readers' Mailbag
The first question is about Iran. Namely, how the possibility of Iran strikes is going to play into our predictions. Gold might be expected to soar then because of safe haven buying.
Our reply is that yes, if any unlikely (markets need to be truly surprised) major geopolitical event was to happen, gold might temporary rise and its decline would be delayed. At the same time, if tensions decrease, gold might decline sooner and more profoundly. The latter is actually more likely, because tensions are already high. For instance, the U.S. - China trade war might end very quickly (remember how fast the "Twitter war" with North Korea ended?), and Brexit can be dismissed entirely or another vote on it can be announced. It would all be likely to trigger substantial declines in gold.
The markets are forward-looking which means that they already took the above possibilities into account and they are already reflected in the price - along with investors' emotionality that ultimately drives the short- and medium-term trends. This means that by looking at the charts, we are already discounting the possibility of something taking place. That's why the markets would need to be indeed surprised to trigger any kind of reaction. Remember what happened when the SLV ETF launched? Silver plunged, even though everyone expected silver to soar at that time. What happened when Russia took over Crimea a few years ago? Gold's rally made way for its decline relatively soon before it all happened - based on the tensions. There are multiple analogous examples. That's why looking at the charts is so important. The market is discounting more factors than one could name without looking at some kind of list.
Can we predict everything with 100% precision based on the charts alone or based on any other technique? No. But is analyzing charts better and more efficient than trying to guess what's going to happen with regard to all the news and military threats? You bet.
The second question that we received was about gold priced in the Australian dollar and the Australian mining stocks. The analysis of gold from the USD perspective is useful also from the Australian point of view, but it's not going to be as clear with regard to very short-term price targets. The medium- and long-term targets are still likely to be reached at the same time. For instance, when gold bottoms at about $890, it's also likely to bottom in terms of the Australian dollar. Both: US mining stocks, and Australian mining stocks are likely to bottom at that time as well.
There are two reasons for it. First, the major gold price moves will be similar in terms of all currencies unless something extreme is going to happen to the exchange rate (here: AUD/USD). The second reason is the contagion effect. Once people get very emotional about a certain market or asset class, they will sell whatever bears some connection to it - especially if they categorize something similarly. For instance, crisis in one emerging market (say Uruguay) can trigger a massive stock decline on the other side of the planet in a country that's not linked to Uruguay in any important way other than it being also an emerging market (for instance Bulgaria, or Thailand). Based on a crisis in one country, people would panic and withdraw their capital from emerging markets in general thinking that "emerging markets are not safe". This might actually trigger crises in other countries that would have otherwise not take place. This is a very harmful, fear-based effect. It's not really logical (in the above example, the other emerging markets were just as safe or risky before the crisis would hit Uruguay), but it's emotional, which makes the contagion effect to be seen over and over again. Just like technical formations - people know about them, but they still act the same after they are completed. And that's why they work.
If people start to hate gold for its declines and fear even bigger losses (after all, once gold breaks below $1,000, "who knows how low it can go?") they will likely sell anything that's gold-related. Even if the Australian miners are going to be very profitable, their share prices would be likely to fall anyway. People will not care about logic - they will be scared. And they will sell.
All in all, even though the golden roadmap will not look the same from the AUD point of view, the time when gold turns up and down in the moves that we marked on the price path chart should be very similar (if not identical) in terms of both: USD and AUD. Consequently, even though the price targets will be different in case of non-USD currencies, our analyses should still prove useful.
Summary
Summing up, at first sight, it may seem a lot has changed based on Monday's rally in gold and mining stocks. That's not the case, however. The breakout in gold is not confirmed and is similar to rallies that took place right before the most important tops of 2018 and 2019. The triangle-vertex-based reversal in gold is just around the corner, and the same goes for the cyclical turning point in the mining stocks. Plus, options expire on Friday. It doesn't seem that this news-driven rally will be able to do much more than delay the big decline by just a few more days. We might see the decline resume right away, but we might also see it resume on Friday or early next week. The much more important thing is the likelihood that the big decline is coming anyway than whether it starts now or in a few days. The potential profits on the slide are huge and definitely worth waiting a few extra days. Consequently, we think that keeping the short positions intact is justified from the risk to reward point of view.
To summarize:
Trading capital (supplementary part of the portfolio; our opinion): Full short position (250% of the full position) in gold, silver, and mining stocks is justified from the risk/reward perspective with the following stop-loss orders and exit profit-take price levels:
- Gold: profit-take exit price: $1,241; stop-loss: $1,357; initial target price for the DGLD ETN: $51.87; stop-loss for the DGLD ETN $39.87
- Silver: profit-take exit price: $13.81; stop-loss: $15.72; initial target price for the DSLV ETN: $39.38; stop-loss for the DSLV ETN $26.97
- Mining stocks (price levels for the GDX ETF): profit-take exit price: $17.61; stop-loss: $24.17; initial target price for the DUST ETF: $34.28; stop-loss for the DUST ETF $15.47
In case one wants to bet on junior mining stocks' prices (we do not suggest doing so - we think senior mining stocks are more predictable in the case of short-term trades - if one wants to do it anyway, we provide the details), here are the stop-loss details and target prices:
- GDXJ ETF: profit-take exit price: $24.71; stop-loss: $35.67
- JDST ETF: profit-take exit price: $78.21 stop-loss: $30.97
Long-term capital (core part of the portfolio; our opinion): No positions (in other words: cash)
Insurance capital (core part of the portfolio; our opinion): Full position
Whether you already subscribed or not, we encourage you to find out how to make the most of our alerts and read our replies to the most common alert-and-gold-trading-related-questions.
Please note that the in the trading section we describe the situation for the day that the alert is posted. In other words, it we are writing about a speculative position, it means that it is up-to-date on the day it was posted. We are also featuring the initial target prices, so that you can decide whether keeping a position on a given day is something that is in tune with your approach (some moves are too small for medium-term traders and some might appear too big for day-traders).
Plus, you might want to read why our stop-loss orders are usually relatively far from the current price.
Please note that a full position doesn't mean using all of the capital for a given trade. You will find details on our thoughts on gold portfolio structuring in the Key Insights section on our website.
As a reminder - "initial target price" means exactly that - an "initial" one, it's not a price level at which we suggest closing positions. If this becomes the case (like it did in the previous trade) we will refer to these levels as levels of exit orders (exactly as we've done previously). Stop-loss levels, however, are naturally not "initial", but something that, in our opinion, might be entered as an order.
Since it is impossible to synchronize target prices and stop-loss levels for all the ETFs and ETNs with the main markets that we provide these levels for (gold, silver and mining stocks - the GDX ETF), the stop-loss levels and target prices for other ETNs and ETF (among other: UGLD, DGLD, USLV, DSLV, NUGT, DUST, JNUG, JDST) are provided as supplementary, and not as "final". This means that if a stop-loss or a target level is reached for any of the "additional instruments" (DGLD for instance), but not for the "main instrument" (gold in this case), we will view positions in both gold and DGLD as still open and the stop-loss for DGLD would have to be moved lower. On the other hand, if gold moves to a stop-loss level but DGLD doesn't, then we will view both positions (in gold and DGLD) as closed. In other words, since it's not possible to be 100% certain that each related instrument moves to a given level when the underlying instrument does, we can't provide levels that would be binding. The levels that we do provide are our best estimate of the levels that will correspond to the levels in the underlying assets, but it will be the underlying assets that one will need to focus on regarding the signs pointing to closing a given position or keeping it open. We might adjust the levels in the "additional instruments" without adjusting the levels in the "main instruments", which will simply mean that we have improved our estimation of these levels, not that we changed our outlook on the markets. We are already working on a tool that would update these levels on a daily basis for the most popular ETFs, ETNs and individual mining stocks.
Our preferred ways to invest in and to trade gold along with the reasoning can be found in the how to buy gold section. Additionally, our preferred ETFs and ETNs can be found in our Gold & Silver ETF Ranking.
As a reminder, Gold & Silver Trading Alerts are posted before or on each trading day (we usually post them before the opening bell, but we don't promise doing that each day). If there's anything urgent, we will send you an additional small alert before posting the main one.
=====
Latest Free Trading Alerts:
Stocks retraced some more of their Monday's sell-off on Wednesday, as investors' sentiment improved following economic data releases, among other factors. The S&P 500 index fell the lowest since late March and it got closer to the 2,800 mark on Monday. Will the market reverse its downward course? Or was the recent advance just another short-term upward correction?
S&P 500 Continues Retracing Monday's Sell-Off, Upward Reversal?
=====
Thank you.
Sincerely,
Przemyslaw Radomski, CFA
Editor-in-chief, Gold & Silver Fund Manager

