

Briefly: in our opinion, full (300% of the regular position size) speculative short positions in junior mining stocks are justified from the risk/reward point of view at the moment of publishing this Alert.
PLEASE NOTE:
Dear Subscribers,
due to the Author's travel schedule, tomorrow’s and Wednesday’s regular Gold & Silver Trading Alerts will cover the fundamental part of the analysis. However, if anything major happens and it impacts our views on the positions that are currently justified from the risk-to-reward point of view, he’ll send you a quick intraday message.
Thank you for being with us!
Although history doesn’t repeat itself to the letter, it rhymes. At least that’s what tends to happen in the financial markets.
In today’s analysis, I’ll explain why I think we’re about to see another example of the above in the case of junior mining stocks. There’s a technique that suggests one thing, but there’s also another that suggests that a 1-to-1 analogy wouldn’t be as good a fit, as a slight deviation from it.
So far, the situation in the GDXJ – a proxy for junior mining stocks – has been similar to what happened in the second half of April and early May.
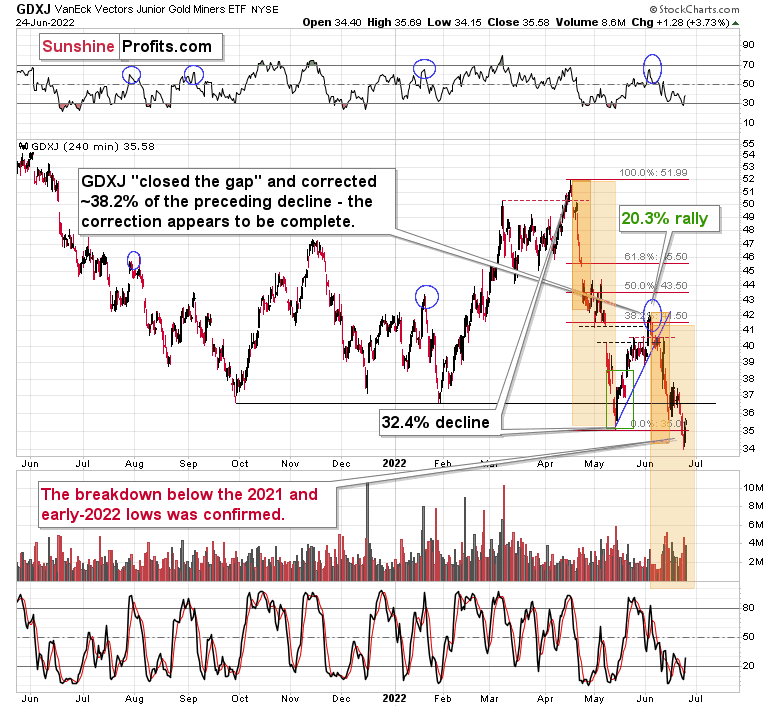
I even marked those similar periods with orange rectangles. We saw a small consolidation right after the end of the smaller rectangle, so history had already proved to be repeating itself.
However, let’s see what happened differently. This time, the initial decline (so the smaller rectangle) was not as steep as it was in April, and the following consolidation was shorter and narrower, too.
What does it tell us? No, I don’t mean the obvious “well, it’s not identical” here. The price moves are smaller either because the entire current short-term downswing is smaller (so, a smaller initial part and then a smaller final part would together create a smaller version of what we saw in April and May), or because this time, the structure of the price move is going to be a bit different.
If the latter is the case, it means that the decline can actually be bigger than what we saw in April-May, not smaller.
Looking at the charts featuring gold and the general stock market, we can tell that the latter of the above scenarios is more likely being realized.
Why? Because junior miners are weak relative to both: gold and the stock market.
Did gold move to new 2022 lows recently? Or below its 2021 lows?
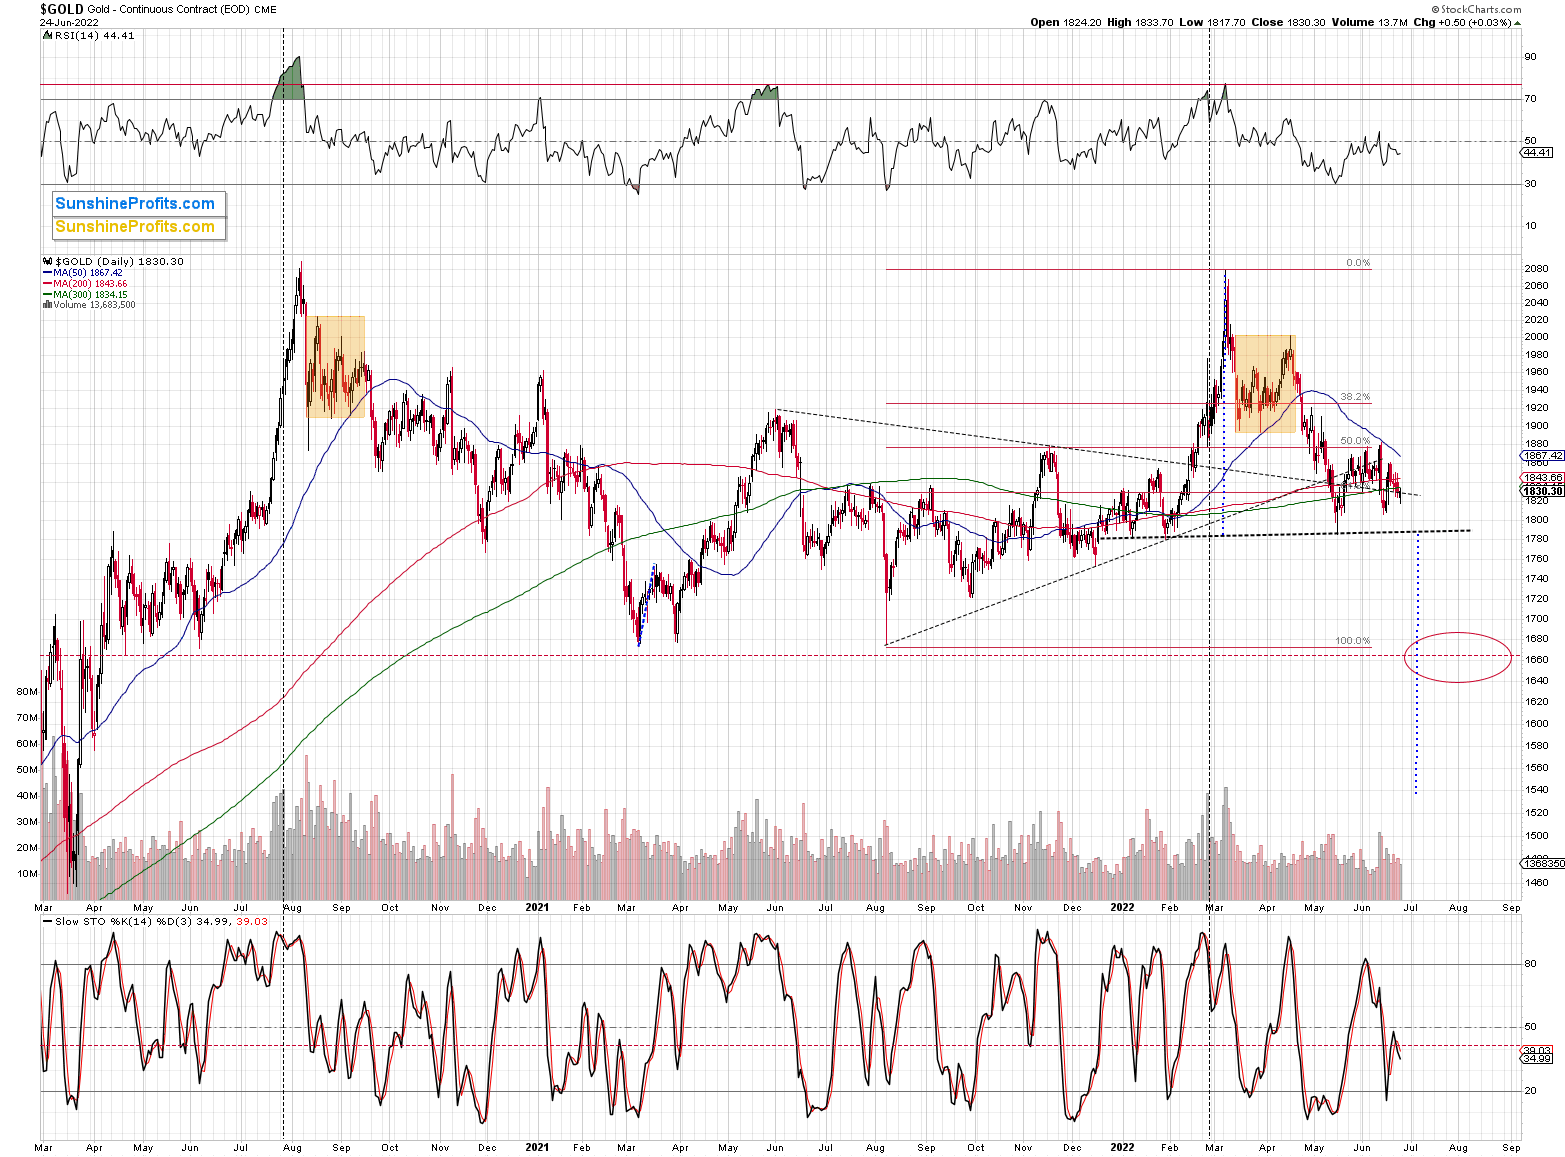
Nope, it’s not even particularly close to those levels. In fact, gold didn’t even move below its recent lows on Friday.
What about the general stock market – did it slide profoundly recently? If it did, it might have explained juniors’ weakness, as both juniors and the general stock market are relatively highly correlated (compared to how correlated is the general stock market is with other parts of the precious metals sector).
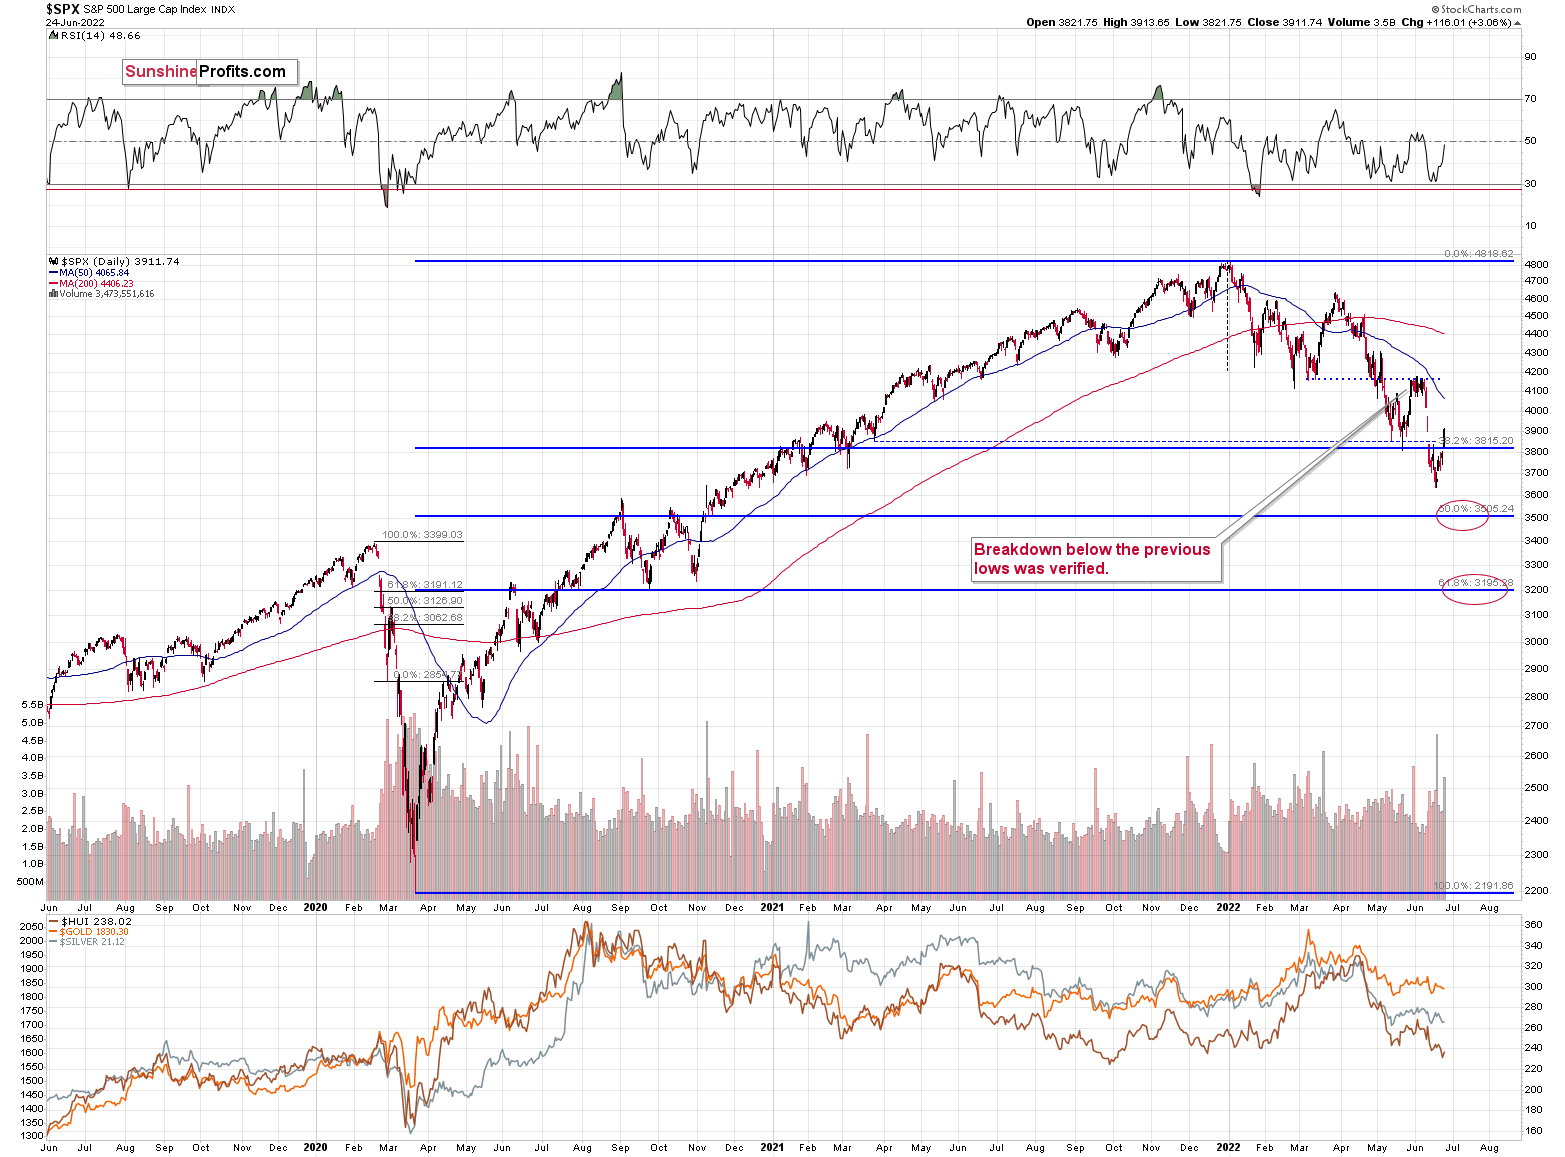
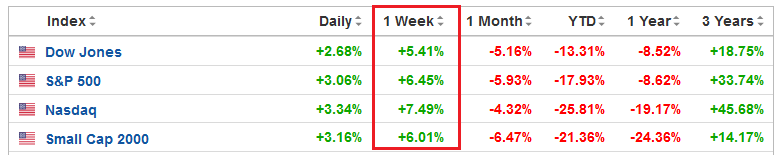
Actually, the general stock market rallied last week, and it invalidated its previous breakdown below the recent and 2021 lows. In fact, the S&P 500 Index was up by over 6% last week!
Was GDXJ up by over 6% too? No. It was down by over 3%, and profits on our short positions in juniors have increased once again.
The juniors are weak. Period.
This tells us that it’s more likely that the deviation from the history that is not repeating itself to the letter will be toward something more bearish than the 1:1 analogy would be.
Does it complicate the outlook or analysis right now? Actually, it’s the opposite, because the above perfectly fits what was visible on broader charts all along!
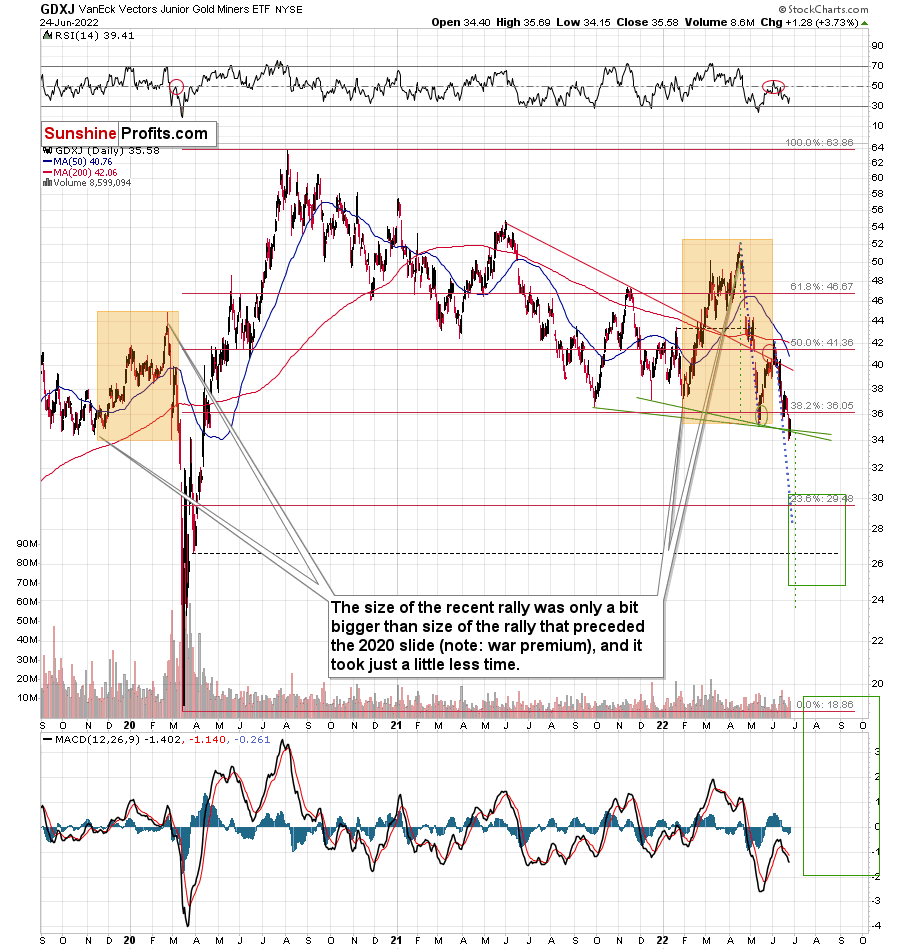
I previously explained that the next target for the GDXJ is likely around the $26-27 area.
That’s below the 1:1 analogy-based target that would be at “just” $28 as the blue, dotted lines would indicate.
Additionally, please note that the GDXJ is likely about to complete a head-and-shoulders pattern. Actually, it doesn’t matter if we use the late-2021 rally as the left shoulder or the late-2021 – early-2022 one, as the early-2022 rally is still the head, and the target based on the formation is the same in both cases. I marked the neck levels with green, solid lines, and I marked the downside target based on the potential formation with green, dashed lines – it’s slightly below $24.
The formation is only “potential” at this time, as we would need to see a confirmed breakdown below the neck level to say that the formation is complete. This would mean a breakdown below ~$34.
Given the kind of weakness that we saw in junior miners recently, it seems that we won’t have to wait too long for the above to take place.
Speaking of time, the month is ending, and this might ring some bells…
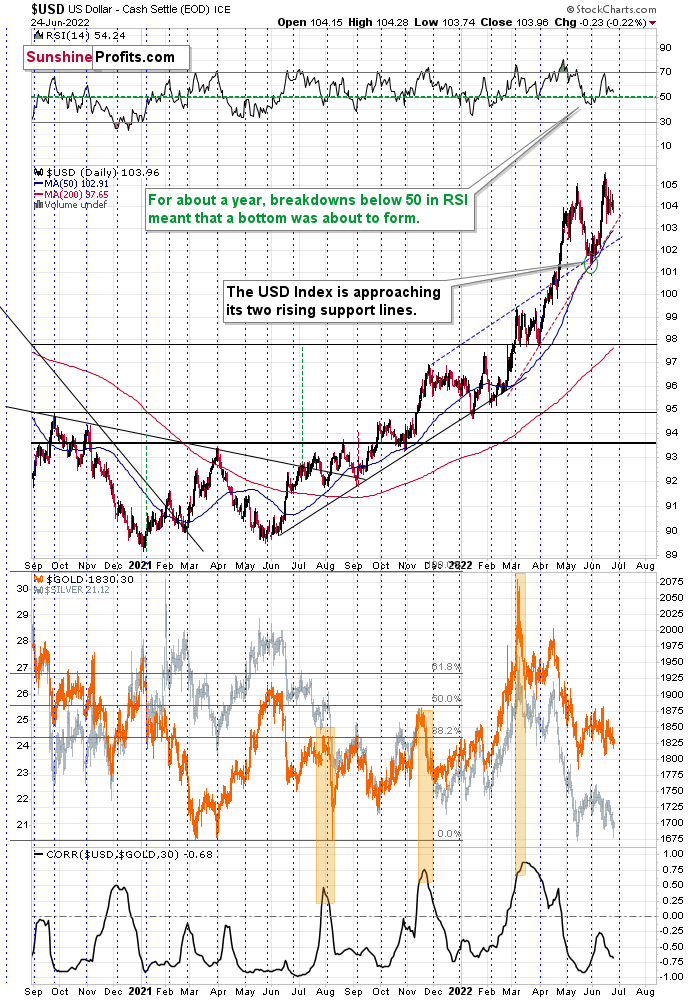
The USD Index tends to turn around at the turn of the month, usually bottoming out at that time. For example, that happened about a month ago and three months ago.
The month ends this Thursday. This tendency works on a near-to basis, so the exact bottom might or might not form on Thursday, but it doesn’t seem that we’ll need to wait for this bottom for long.
Based on junior’s weakness, we see that they just “can’t wait” to move lower, and the above USD Index chart tells us that they are likely about to get a bearish push.
Let’s not forget about the forest while looking at trees. The recent brief decline in the USD Index is likely just a handle of a cup-and-handle pattern that – when completed – is likely to take the USD Index much higher.
Most importantly, the entire cup-and-handle pattern (so basically the May-now performance) is a big handle of a much bigger cup-and-handle pattern that you can see on the long-term USD Index chart.
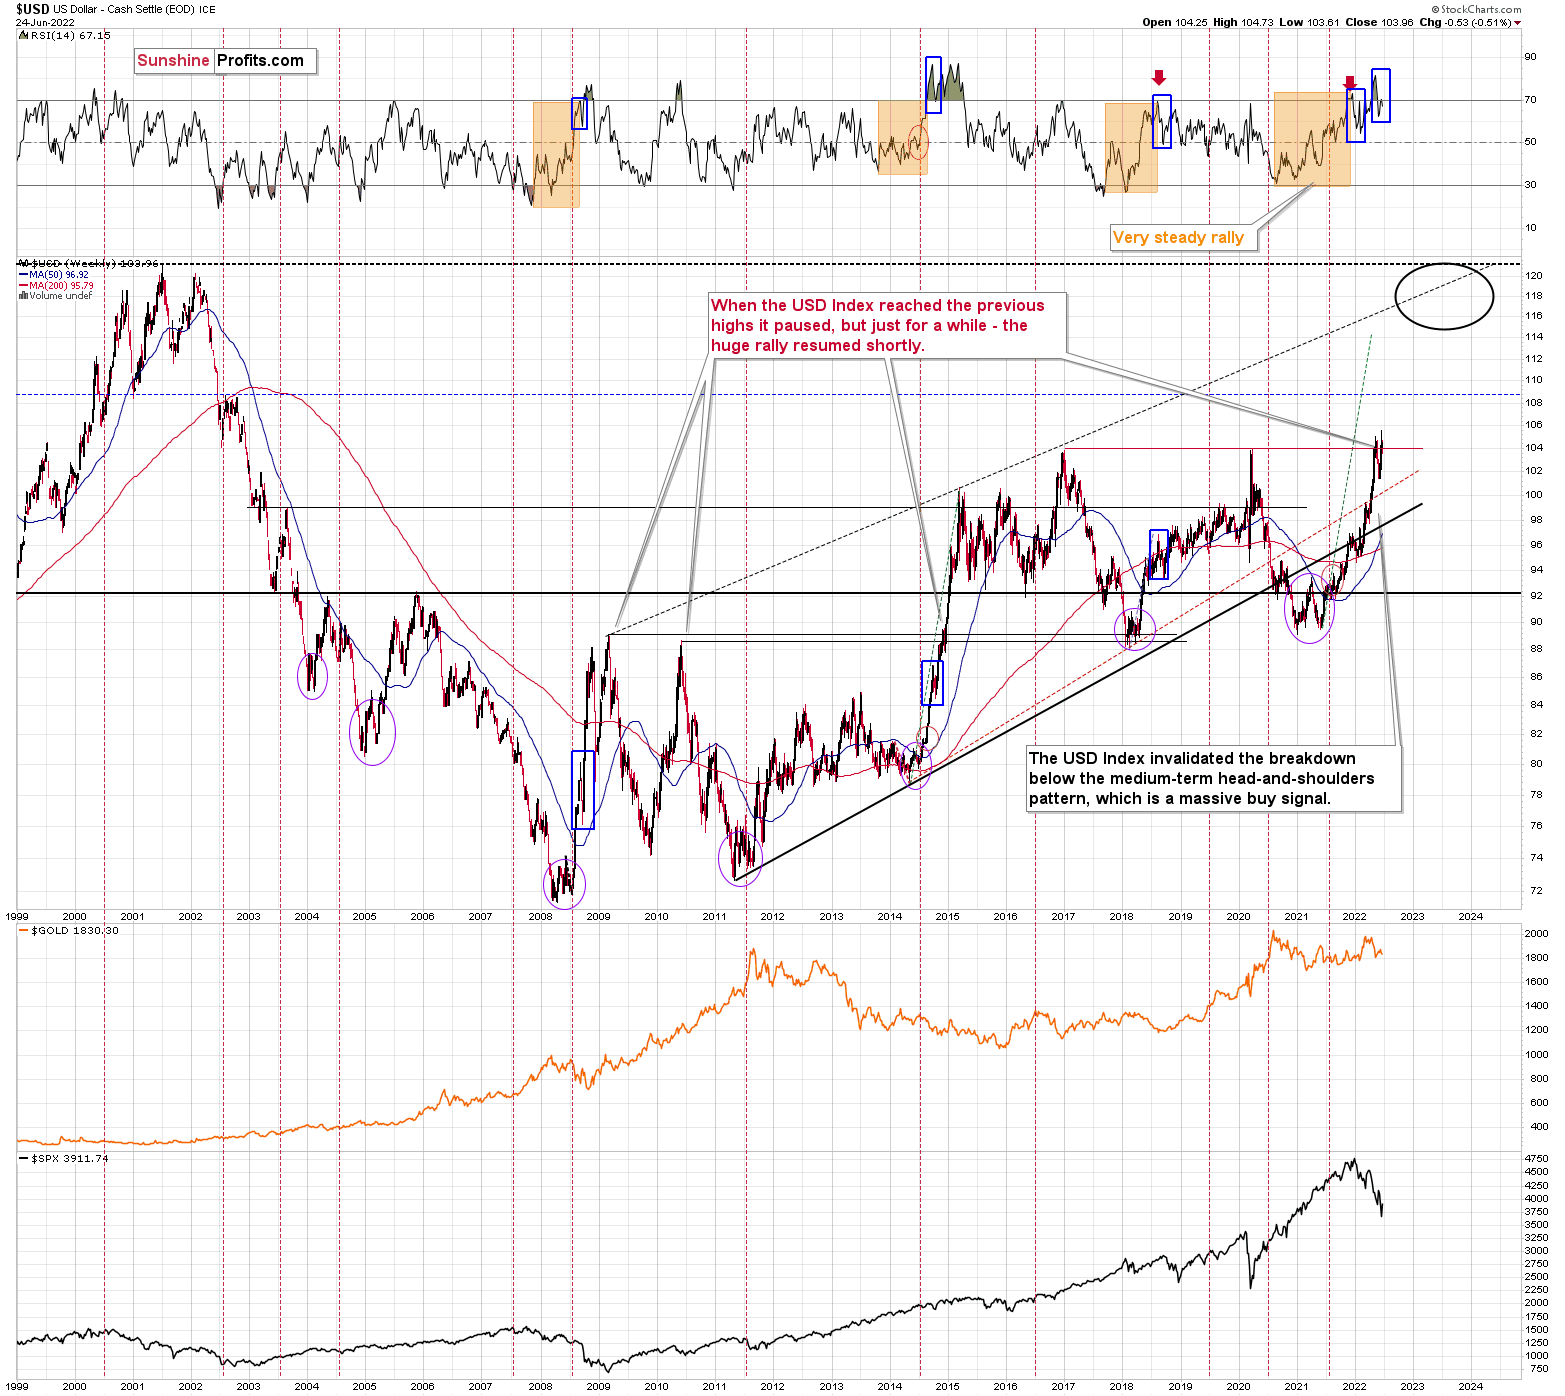
This means that once the USD Index breaks and confirms the breakout above the previous highs (and it’s likely to do so in the near future), it’s likely to soar.
This is bearish for the precious metals market – extremely so. Gold’s back-and-forth movement is likely about to end, just like junior miners are indicating. Gold’s next important stop (not the final end of the entire medium-term decline, though) is likely to be at its 2021 lows or close to them.
Having said that, let’s take a look at the markets from a more fundamental angle.
Relative Weakness
With the S&P 500 staging a comeback last week, the bulls rejoiced as oversold conditions helped elicit a short-term relief rally.
Please see below:
 Source: Investing.com
However, with the typical bear market bounce largely expected, I warned on Jun. 21 that too much pessimism led to one-sided positioning. I wrote:
Last week's sell-off has too many market participants on one side of the boat. As a result, don't confuse a short squeeze for bullish price action.
Please see below:
 Source: Goldman Sachs
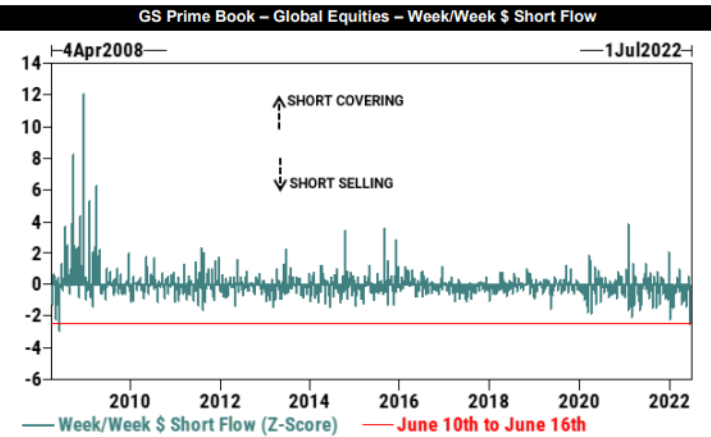
To explain, the blue bars above track the short-selling and short-covering activity of Goldman Sachs' hedge fund clients. If you analyze the red line at the bottom, you can see that the z-score of hedge funds' weekly short sales was the highest since April 2008.
In a nutshell: hedge funds shorted more stocks as the S&P 500 declined, leaving them highly exposed to a short squeeze. As a result, if the markets rally, consider the price action within the context of the above data.
Likewise, oversold conditions are also present.
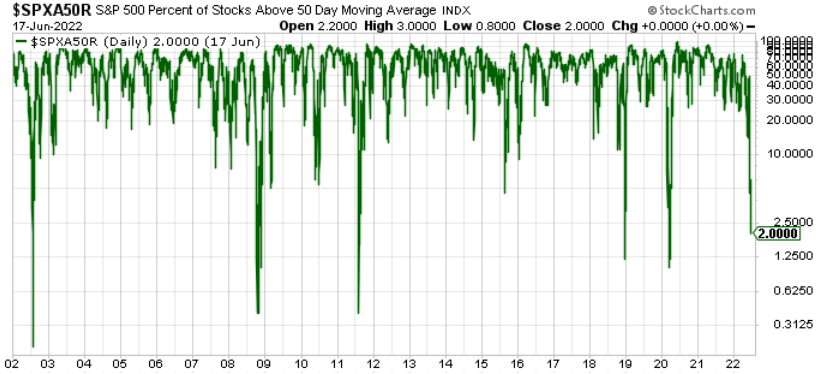
To explain, the green line above tracks the percentage of S&P 500 stocks above their 50-day moving average. If you analyze the right side of the chart, you can see that only 2% of S&P 500 constituents hold the key level, and the reading is abnormally low.
For context, it’s a contrarian indicator, meaning that too much pessimism often elicits a short-term reversion. Moreover, with the dot-com bubble, the global financial crisis (GFC), the 2011 growth scare, the COVID-19 crash and the 2018 sell-off the only periods with lower readings, it may take a shock-and-awe event to move the metric lower in the short term.
Thus, while a sharp reversion materialized on cue, the sentiment shift has little impact on the S&P 500’s medium-term outlook. More importantly, with the GDXJ ETF underperforming the S&P 500, the junior miners have demonstrated immense relative weakness.
Please see below:
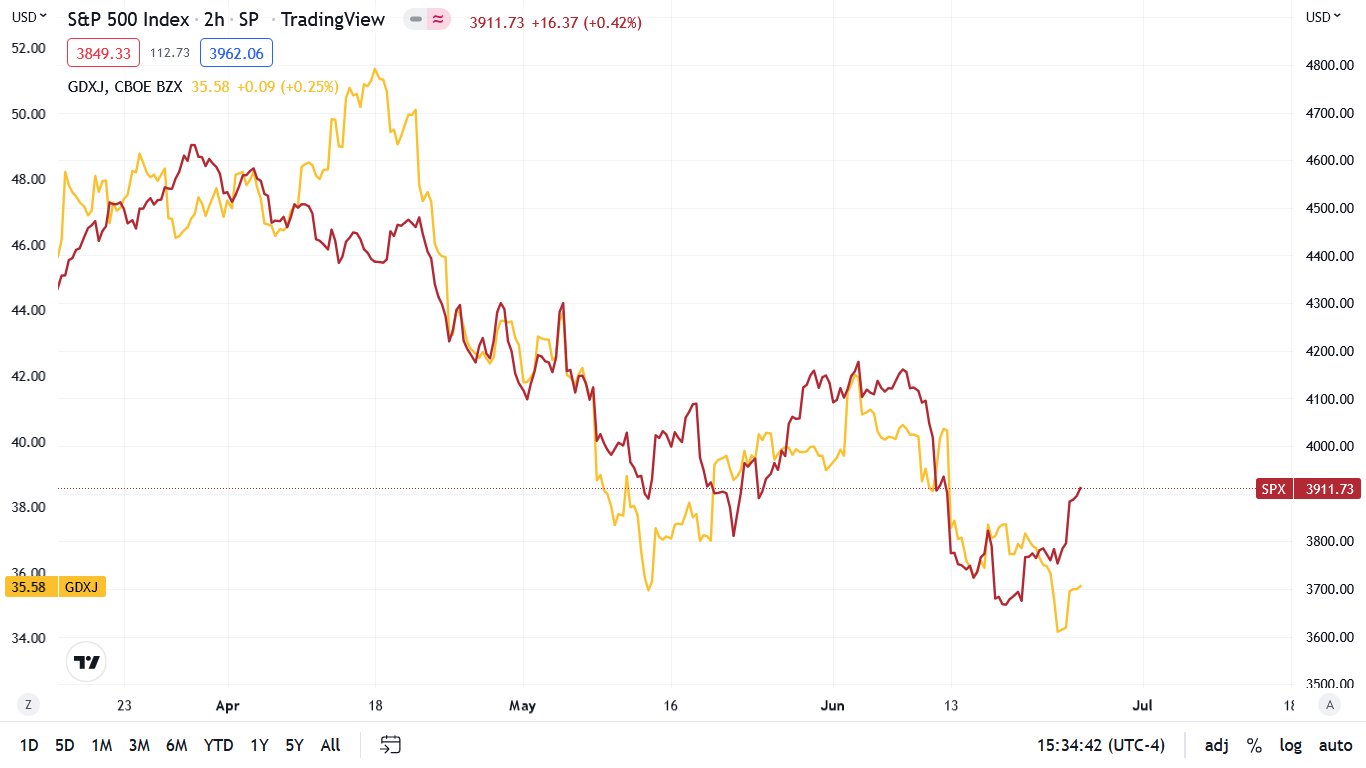
To explain, the gold line above tracks the two-hour movement of the GDXJ ETF since mid-March, while the red line above tracks the two-hour movement of the S&P 500. As I’ve noted on numerous occasions, the junior miners’ performance is more correlated with the general stock market than the other PMs.
However, while the GDXJ ETF rallied by 3.73% on Jun. 24, its weekly performance materially lagged the S&P 500 (see the right side of the chart). Therefore, a bear market rally wasn’t enough to light a fire under the junior miners. Furthermore, with more downside poised to confront the S&P 500 over the medium term, the pair’s selling pressure should intensify during the summer months.
Earn Your Keep
While oversold conditions are known to spark short-term rallies, narratives often manifest that leave investors expecting more. However, with the Fed’s rate hike cycle taking shape, the fundamental realities of suppressing demand with higher interest rates should prove problematic in the months ahead.
For example, stock market bulls highlight low price-to-earnings (P/E) multiples as signs of fundamental value. Moreover, with the S&P 500’s forward P/E ratio approaching 15 recently, the figure looks relatively cheap compared to the ~22 reading that materialized in 2020 and 2021.
However, while investors focus on the ‘P,’ inflation, rate hikes, and a looming recession should weigh heavily on the ‘E’ in the coming months.
Please see below:
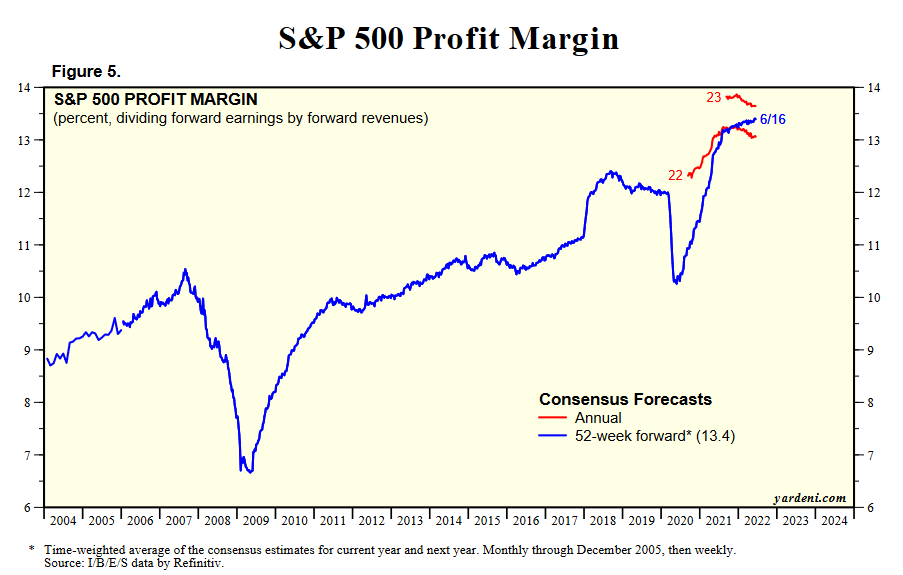
To explain, the blue line above tracks the S&P 500’s forward profit margin. For context, the metric divides analysts’ forward earnings estimates by their forward revenue estimates. If you analyze the right side of the chart, you can see that the blue line continues to move higher. In fact, analysts’ earnings estimates have increased since January, even with the S&P 500 falling by roughly 18%.
Furthermore, the red lines at the top right of the chart show that analysts expect the S&P 500’s annual forward profit margin to be higher in 2023 than in 2022. In a nutshell: analysts think the Fed’s profoundly hawkish rate hike cycle won’t impact S&P 500 companies’ earnings. However, notice the sharp declines in 2008 and 2020? Moreover, when the Fed hiked interest rates in 2017/2018, estimates came down from their highs.
Likewise, with nearly 70 years of data showing that recessions materialize when the Fed battles unanchored inflation, analysts' estimates are out of touch with reality.
Please see below:
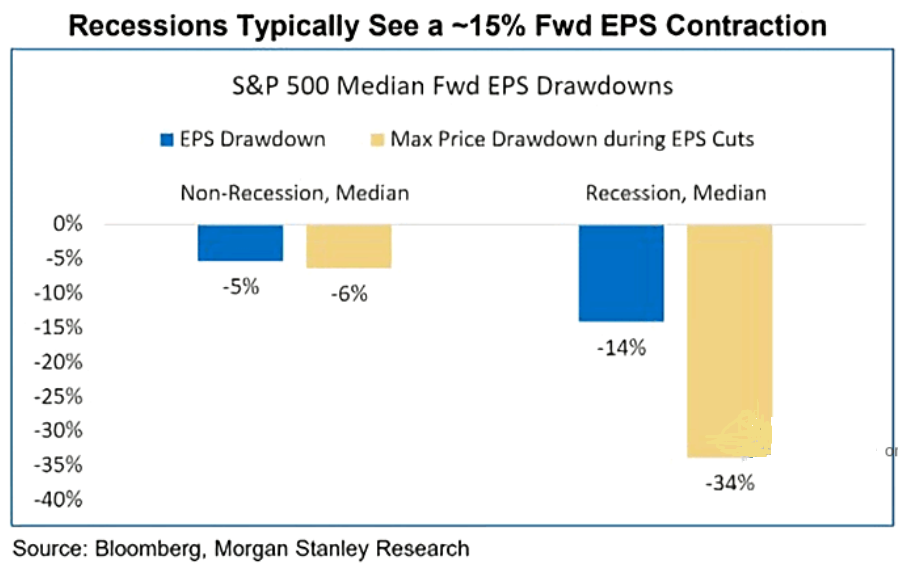
To explain, the blue and tan bars on the left highlight the S&P 500’s earnings per share (EPS) and price declines when analysts cut their targets outside of recessions. However, the blue and tan bars on the right show that 14% to 15% declines in forward EPS estimates often culminate with 34% S&P 500 price declines during recessions.
As a result, with expected profit margins already at all-time highs (data going back to 2004) and expected to rise in 2023, the recession realities that should emerge in the coming months leave plenty of room for further downside.
For context, I wrote on Jun. 1:
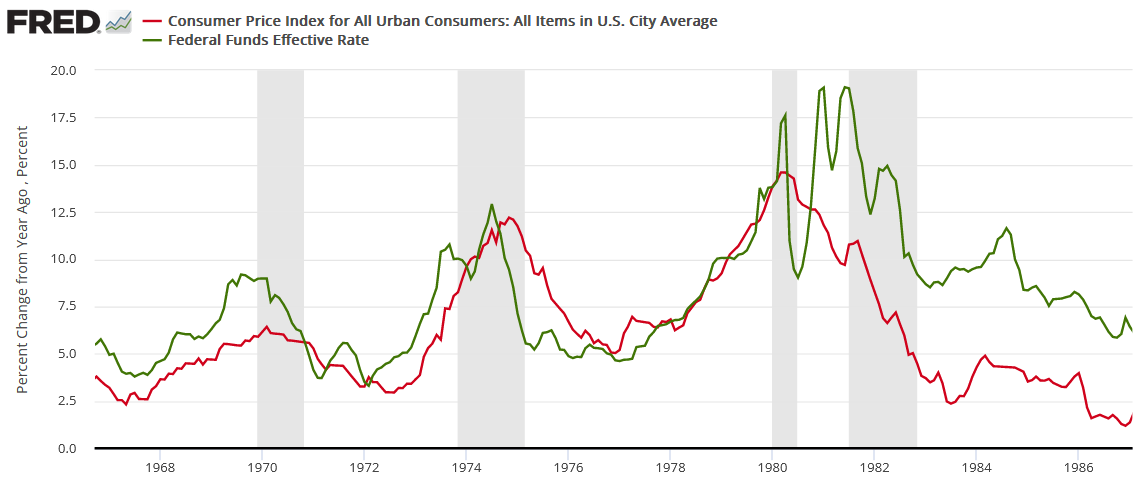
While the consensus either doesn't care or doesn't know history, unanchored inflation in the 1970s/1980s pushed the U.S. into recession four times over ~12 years (the vertical gray bars below). For context, if we exclude the COVID-19 pandemic, the U.S. has only entered a recession once in the last 20 years. Thus, putting a Band-Aid on a gunshot wound won't do much good.
Please see below:
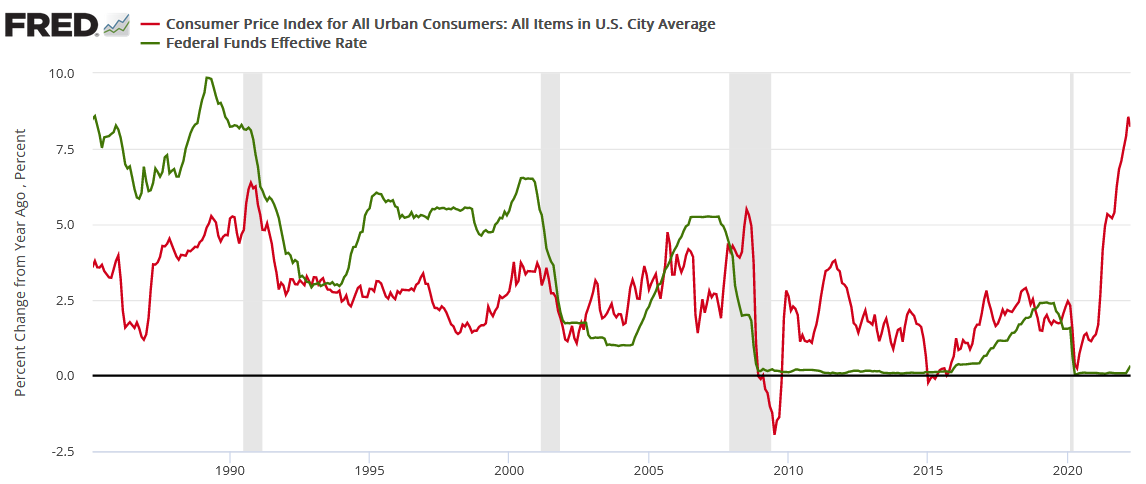
Likewise, modern history sings a similar tune. For example, the Fed has never curbed inflation without the U.S. federal funds rate eclipsing the YoY CPI rate at some point. Therefore, if the Fed pauses at 1.83% and inflation falls to its 2% target, Powell and his crew would accomplish something that’s never been done.
To that point, notice how every inflation spike leads to a higher U.S. federal funds rate and then a recession. As such, do you really think this time is different?
Also noteworthy, I’ve highlighted on numerous occasions that there is no reason to fear in the financial markets. With investors still awaiting the Fed’s dovish pivot, they assume that inflation will abate on its own, the S&P 500 will hit new highs, and everyone will live happily ever after.
Please see below:
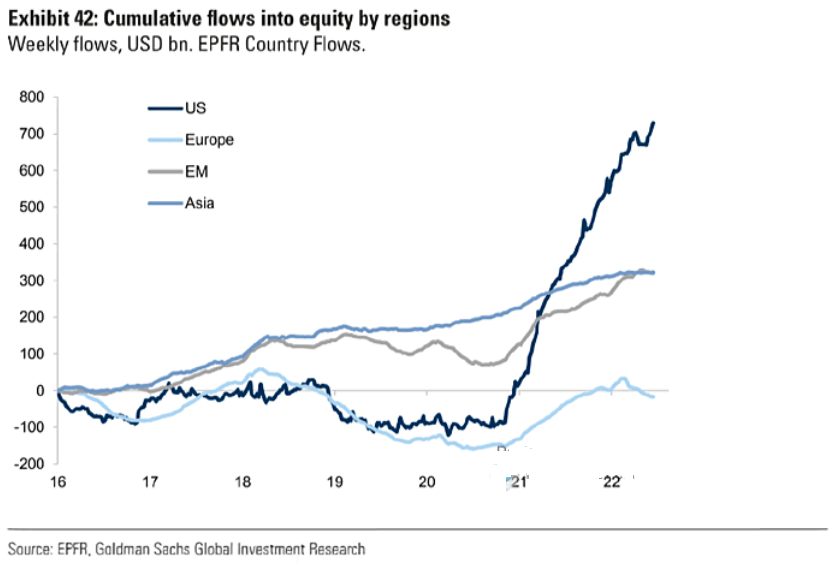
To explain, the various lines above track the equity flows into different regions. If you focus your attention on the dark blue line, you can see that investors continue to pour money into U.S. stocks. As a result, the ‘buy the dip crowd’ remains loyal to the post-GFC script. However, with unanchored inflation a much different animal, investors’ recency bias overlooks the ominous realities present in the CPI/U.S. federal funds rate charts above.
Still Hawked Up
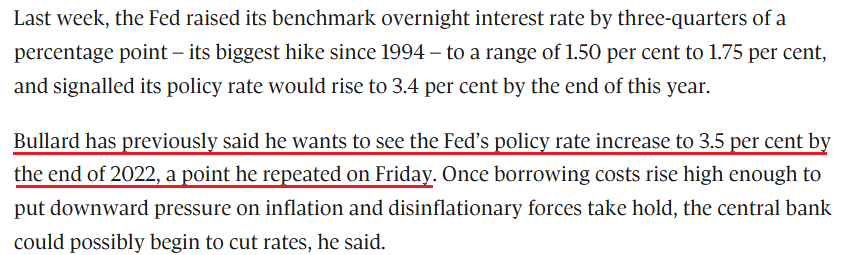
While Fed Chairman Jerome Powell made it clear that he wants positive real yields "across the curve," his deputies continued to sound the hawkish alarm. For example, St. Louis Fed President James Bullard said on Jun. 24 that "We have to act forthrightly and aggressively to get inflation to turn around and get it under control... or you could suffer a decade of high and variable inflation."
"So front-load today, get inflation under control in short order, and get inflation back on a path to 2%," Bullard added.
As a result, he reiterated his expectation for 14 rate hikes in 2022. For context, the current tally stands at six (25 basis point increments).
Please see below:
 Source: The Globe and Mail
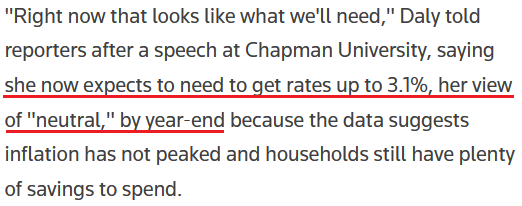
Likewise, San Francisco Fed President Mary Daly said on Jun. 24 that a 75 basis point rate hike in July is her "starting point." However, she cautioned, "If we get more tightening or a broader slowdown in the economy than I currently expect, then anything between 50 and 75 seems like a reasonable thing to consider."
As a result, while 50 basis points is considered dovish these days, whether the FOMC raises rates by 25, 50, or 75 basis points in July doesn't matter. What matters is the duration of the Fed's war on inflation. Moreover, Daly stated that her view of "neutral" is 3.1%, which implies more than 12 rate hikes.
Please see below:
 Source: Reuters
However, with history showing that the U.S. federal funds rate needs to eclipse the YoY percentage change in the headline CPI to curb inflation, Fed officials and investors’ expectations are unrealistic. Moreover, history shows that the measures required to reduce inflation always lead to recessions. Therefore, with equity flows still surging and S&P 500 expected profit margins at record highs, investors should learn the hard way that 12 to 14 rate hikes over 12 months will do plenty of damage to the U.S. economy.
The Bottom Line
The expected short squeeze materialized last week, as U.S. equities bounced off of oversold conditions. Moreover, with month-end and quarter-end rebalancing underway, 60/40 pension funds may need to buy more equities to return their portfolio weights to their desired allocations. However, these are short-term phenomena and don’t account for the fundamental destruction that continues to unfold. As a result, more pain should confront the GDXJ ETF and the S&P 500 over the next few months.
In conclusion, the PMs rallied on Jun. 24, as risk-on sentiment returned to the financial markets. However, while the algorithms found something they liked, the fundamentals headed in the opposite direction. Thus, gold, silver, and mining stocks’ medium-term outlooks remain profoundly bearish.
Overview of the Upcoming Part of the Decline
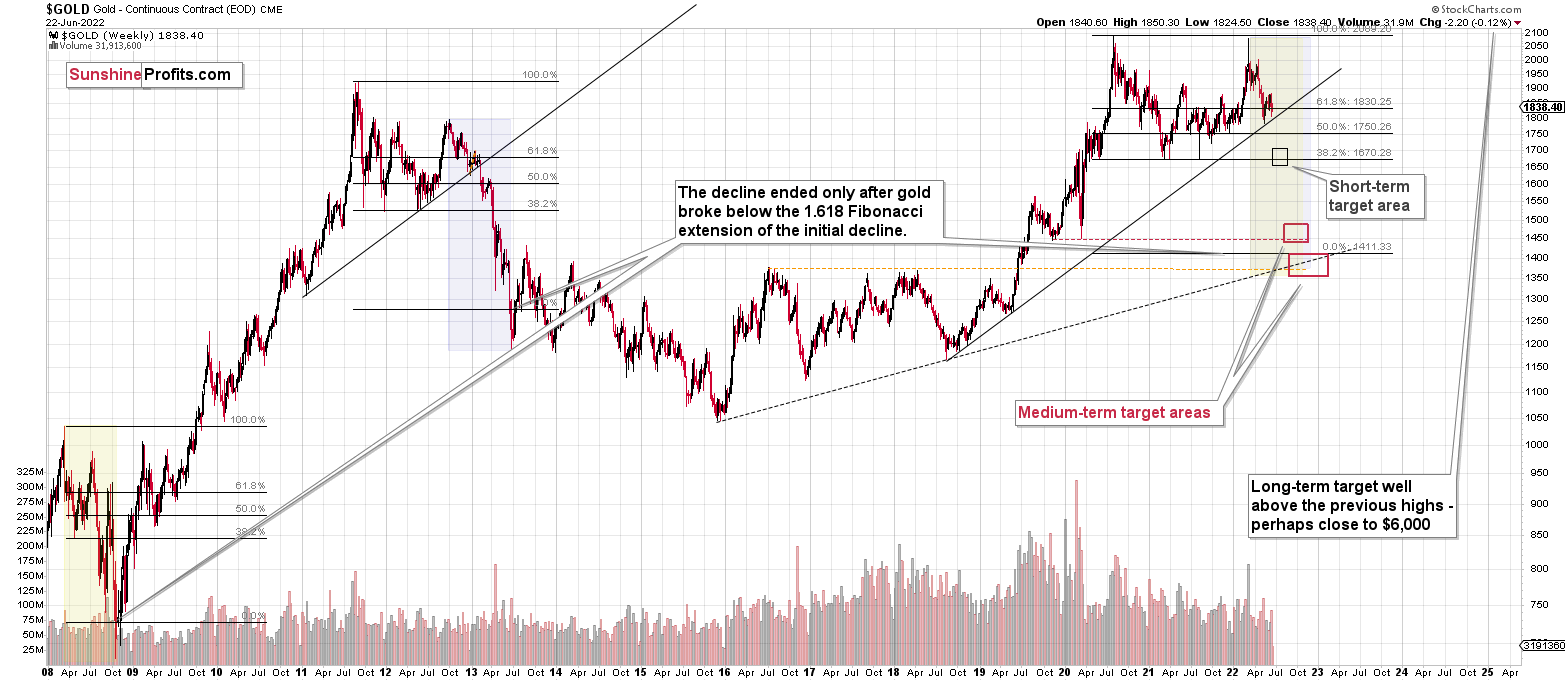
- It seems to me that the precious metals market is already in its medium-term decline that is about to take it much lower (to the 2021 lows in case of gold - $1,650 - $1,700)
- If we see a situation where miners slide in a meaningful and volatile way while silver doesn’t (it just declines moderately), I plan to – once again – switch from short positions in miners to short positions in silver. At this time, it’s too early to say at what price levels this could take place and if we get this kind of opportunity at all – perhaps with gold prices close to $1,600.
- I plan to exit all remaining short positions once gold shows substantial strength relative to the USD Index while the latter is still rallying. This may be the case with gold close to $1,400. I expect silver to fall the hardest in the final part of the move. This moment (when gold performs very strongly against the rallying USD and miners are strong relative to gold after its substantial decline) is likely to be the best entry point for long-term investments, in my view. This can also happen with gold close to $1,400, but at the moment it’s too early to say with certainty.
- The above is based on the information available today, and it might change in the following days/weeks.
You will find my general overview of the outlook for gold on the chart below:
Please note that the above timing details are relatively broad and “for general overview only” – so that you know more or less what I think and how volatile I think the moves are likely to be – on an approximate basis. These time targets are not binding or clear enough for me to think that they should be used for purchasing options, warrants, or similar instruments.
Letters to the Editor
Q: A historical question. Re:DUST, September 3, 2013 shows $34,500 for DUST. I’m looking at the history of DUST from my Fidelity trading app. I don’t know enough about DUST, but it's currently trading at $18. Can you explain this? Thank you.
A: Yes. Leveraged instruments like DUST, NUGT, JDST, and JNUG tend to decline in value (by a lot) over long periods of time. That’s due to the way they operate. They magnify daily price moves, nothing more and nothing else. If something moves down by 20% and then backs up by 25% to break even (it needs to rally back more as the basis is lower for the rally), then the leveraged instrument will initially decline by 40% and then rally by 50%. So, something that was worth $10 will first decline to $6 (a 40% decline) and then increase to $9 (a 50% rally). It’s still $1 (10%) lower than it was at the beginning. If you multiply this many times over, you get significant declines over the long run. They might be useful proxies for short- and medium-term (sometimes) trades, but they are generally not a good long-term option for the above reasons.
Was DUST or another leveraged instrument over $30k in price? No. They were cheaper, but as the price moved lower (and below $1), the shares were split, which caused the historical prices to be adjusted – and that’s what you see on the charts.
Q: PR, I got this off of Twitter. Just so you know. It seems legit. The Cleveland Fed quarterly Q2 inflation Nowcasting annualized CPI at 10.03%
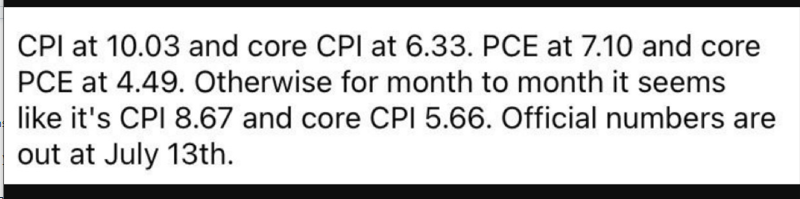
A: Thanks! Well, yes, inflation is huge and rates are likely to increase much further, too. When more and more people realize this, the markets are likely to decline. Practically all markets, especially stocks, but PMs are likely to bottom before stocks – similarly to what we saw in 2020, only this time the price moves are taking more time.
Q: Shouldn't a Russian ban on gold imports be bullish as these same exact measures were super bullish for oil and natural gas?
A: Indeed, it could work this way, but I doubt the magnitude and duration of this effect.
Oil and natural gas are used industrially and are critical commodities that people need in a timely manner. The reserves / stockpiles are limited, too. Consequently, when people need to get heat and are unable to do so, the price is likely to soar. People might discount this – rather obvious – kind of price reaction in the before it happens.
In the case of gold, there are substantial stockpiles – pretty much all the gold that was ever mined is “out there” in one form or another. Of course, not all of that is available, but still a lot of it is. At the same time, gold is not as critically needed as something used for heating / transportation. At least not right now, as we are not in hyperinflation and people still trust the fiat currencies (mostly). Don’t get me wrong – gold is valuable (definitely!), but due to inventories and the structure of demand, there’s much more “demand and supply elasticity” than in the case of oil and natural gas.
So, while the markets might view the above as something bullish for gold, I don’t think it will prevent the medium-term decline. I don’t think that it would be able to trigger a bigger correction, either.
Summary
Summing up, it seems to me that the short-term rally in the precious metals market is over, and the decline will now continue. And the tiny correction’s days are likely numbered, too.
I previously wrote that the profits from the previous long position (congratulations once again) were likely to further enhance the profits on this huge decline, and that’s exactly what happened. The profit potential with regard to the upcoming gargantuan decline remains huge.
As investors are starting to wake up to reality, the precious metals sector (particularly junior mining stocks) is declining sharply. Here are the key aspects of the reality that market participants have ignored:
- rising real interest rates,
- rising USD Index values.
Both of the aforementioned are the two most important fundamental drivers of the gold price. Since neither the USD Index nor real interest rates are likely to stop rising anytime soon (especially now that inflation has become highly political), the gold price is likely to fall sooner or later. Given the analogy to 2012 in gold, silver, and mining stocks, “sooner” is the more likely outcome.
After the final sell-off (that takes gold to about $1,350-$1,500), I expect the precious metals to rally significantly. The final part of the decline might take as little as 1-5 weeks, so it's important to stay alert to any changes.
Also, on an administrative note, due to Przemysław Radomski’s travel schedule, tomorrow’s and Wednesday’s regular Gold & Silver Trading Alerts will cover the fundamental part of the analysis. However, if anything major happens and it impacts our views on the positions that are currently justified from the risk-to-reward point of view, I’ll send you a quick intraday message.
As always, we'll keep you – our subscribers – informed.
To summarize:
Trading capital (supplementary part of the portfolio; our opinion): Full speculative short positions (300% of the full position) in junior mining stocks are justified from the risk to reward point of view with the following binding exit profit-take price levels:
Mining stocks (price levels for the GDXJ ETF): binding profit-take exit price: $27.32; stop-loss: none (the volatility is too big to justify a stop-loss order in case of this particular trade)
Alternatively, if one seeks leverage, we’re providing the binding profit-take levels for the JDST (2x leveraged). The binding profit-take level for the JDST: $18.35; stop-loss for the JDST: none (the volatility is too big to justify a SL order in case of this particular trade).
For-your-information targets (our opinion; we continue to think that mining stocks are the preferred way of taking advantage of the upcoming price move, but if for whatever reason one wants / has to use silver or gold for this trade, we are providing the details anyway.):
Silver futures downside profit-take exit price: $17.22
SLV profit-take exit price: $16.22
ZSL profit-take exit price: $41.47
Gold futures downside profit-take exit price: $1,706
HGD.TO – alternative (Canadian) 2x inverse leveraged gold stocks ETF – the upside profit-take exit price: $11.87
HZD.TO – alternative (Canadian) 2x inverse leveraged silver ETF – the upside profit-take exit price: $31.87
Long-term capital (core part of the portfolio; our opinion): No positions (in other words: cash)
Insurance capital (core part of the portfolio; our opinion): Full position
Whether you’ve already subscribed or not, we encourage you to find out how to make the most of our alerts and read our replies to the most common alert-and-gold-trading-related-questions.
Please note that we describe the situation for the day that the alert is posted in the trading section. In other words, if we are writing about a speculative position, it means that it is up-to-date on the day it was posted. We are also featuring the initial target prices to decide whether keeping a position on a given day is in tune with your approach (some moves are too small for medium-term traders, and some might appear too big for day-traders).
Additionally, you might want to read why our stop-loss orders are usually relatively far from the current price.
Please note that a full position doesn't mean using all of the capital for a given trade. You will find details on our thoughts on gold portfolio structuring in the Key Insights section on our website.
As a reminder - "initial target price" means exactly that - an "initial" one. It's not a price level at which we suggest closing positions. If this becomes the case (as it did in the previous trade), we will refer to these levels as levels of exit orders (exactly as we've done previously). Stop-loss levels, however, are naturally not "initial", but something that, in our opinion, might be entered as an order.
Since it is impossible to synchronize target prices and stop-loss levels for all the ETFs and ETNs with the main markets that we provide these levels for (gold, silver and mining stocks - the GDX ETF), the stop-loss levels and target prices for other ETNs and ETF (among other: UGL, GLL, AGQ, ZSL, NUGT, DUST, JNUG, JDST) are provided as supplementary, and not as "final". This means that if a stop-loss or a target level is reached for any of the "additional instruments" (GLL for instance), but not for the "main instrument" (gold in this case), we will view positions in both gold and GLL as still open and the stop-loss for GLL would have to be moved lower. On the other hand, if gold moves to a stop-loss level but GLL doesn't, then we will view both positions (in gold and GLL) as closed. In other words, since it's not possible to be 100% certain that each related instrument moves to a given level when the underlying instrument does, we can't provide levels that would be binding. The levels that we do provide are our best estimate of the levels that will correspond to the levels in the underlying assets, but it will be the underlying assets that one will need to focus on regarding the signs pointing to closing a given position or keeping it open. We might adjust the levels in the "additional instruments" without adjusting the levels in the "main instruments", which will simply mean that we have improved our estimation of these levels, not that we changed our outlook on the markets. We are already working on a tool that would update these levels daily for the most popular ETFs, ETNs and individual mining stocks.
Our preferred ways to invest in and to trade gold along with the reasoning can be found in the how to buy gold section. Furthermore, our preferred ETFs and ETNs can be found in our Gold & Silver ETF Ranking.
As a reminder, Gold & Silver Trading Alerts are posted before or on each trading day (we usually post them before the opening bell, but we don't promise doing that each day). If there's anything urgent, we will send you an additional small alert before posting the main one.
Thank you.
Przemyslaw Radomski, CFA
Founder, Editor-in-chief

