

Briefly: in our opinion, full (300% of the regular position size) speculative short positions in junior mining stocks are justified from the risk/reward point of view at the moment of publishing this Alert.
Today’s analysis will take a video format.
In the second part of the video, I’m providing a small teaser of the major improvement in the way in which I’m providing my services.
Oh, and if you’re wondering why I’m not more enthusiastic in the video while talking about it, it’s simply because I’m really tired, given how much work the entire team has been putting into this new platform and everything related to it. But I know – we know – that it’s well worth it.
In tomorrow’s notification email, you will receive two links. The first link will be an invitation link to join the new platform, and I highly recommend that you do it right away because, thanks to this, you can enjoy the new features right from the start.
The second link will be “plan B” – for some time (in days, maybe weeks, but not in months), we’ll be providing links to premium analyses posted in the old way in addition to links posted in the new way (on the new platform). The point is that I don’t want some temporary technical glitches to prevent you from accessing the analysis.
Please, please, please treat this as plan B – we all really want to see you and interact with you on the new platform :) When tomorrow’s notification email comes, please sign up for the new platform using the main link. Don’t worry, we’ll make it extremely clear where to find it.
Now, what I didn’t mention on the video was that the platform has an iOS app (and the Android app is likely to be available within a couple of months), which means that you’ll now be able to get notifications for your premium Gold & Silver Trading Alerts right on your iPhone (and in the not-too-distant future also for your Android device). Actually, you’ll be able to set up all sorts of notifications, and it will be up to you about what way you’ll be notified. Cool, huh?
On a final note, the name Gold & Silver Trading Alert will be shortened – to Gold Trading Alerts. However, the scope doesn’t change – I’m going to continue to cover gold, silver, and mining stocks. My current focus is on junior mining stocks, anyway.
Stay tuned!
Having said that, let’s take a look at the markets from a more fundamental point of view.
While the gold price remains uplifted as the materials sector outperformed the S&P 500 once again, financial assets were in limbo ahead of Fed Chairman Jerome Powell’s speech today. Moreover, while numerous Fed officials have vehemently pushed back against a dovish pivot, the loosening of financial conditions only makes the Fed’s job more difficult.
As a result, while Powell often struggles to deliver his message, higher asset prices and even looser financial conditions will only make the medium-term pain more pronounced.
For example, while every inflation fight since 1954 has ended with a recession, the crowd expects the Fed to pull off the near impossible. Therefore, immense disappointment should confront the bulls when economic reality bites.
Please see below:
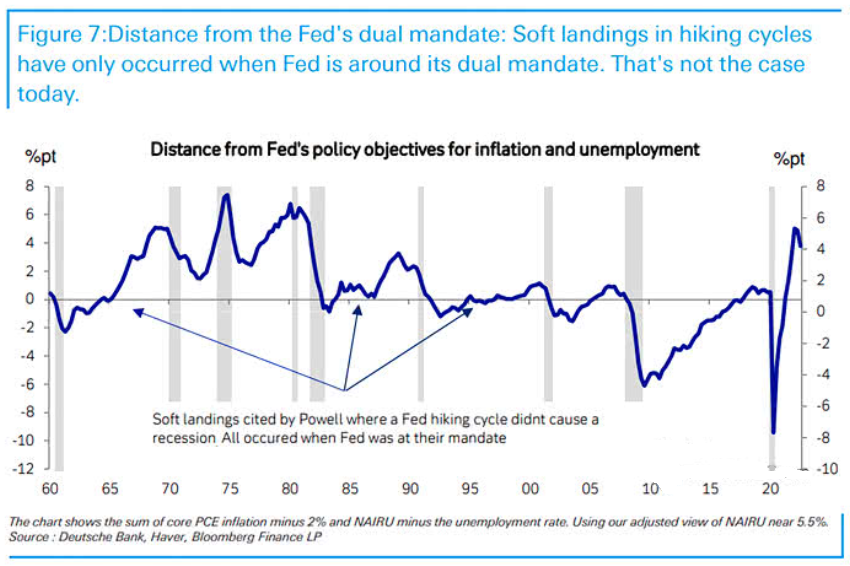
To explain, the blue line above tracks the sum of the U.S. inflation and unemployment spreads. For context, the inflation spread is the difference between the year-over-year (YoY) core Personal Consumption Expenditures (PCE) Index and the Fed’s 2% inflation target.
In addition, the employment spread is the difference between the current unemployment rate and the non-accelerating inflation rate of unemployment (NAIRU) – which is the lowest unemployment rate that doesn’t provoke higher wages.
If you analyze the three blue arrows near the middle of the chart, you can see that soft landings often occur when the inflation and unemployment spreads are close to the Fed’s target levels. In contrast, hard landings often occur when the spreads are substantially above the Fed’s target levels (like in the 1970s).
So, with inflation well above 2% and the unemployment rate well below the NAIRU, both have deviated materially from where the Fed needs them to be. As such, the blue line’s ascent on the right side of the chart is another example of why the bulls’ soft landing prediction is wishful thinking.
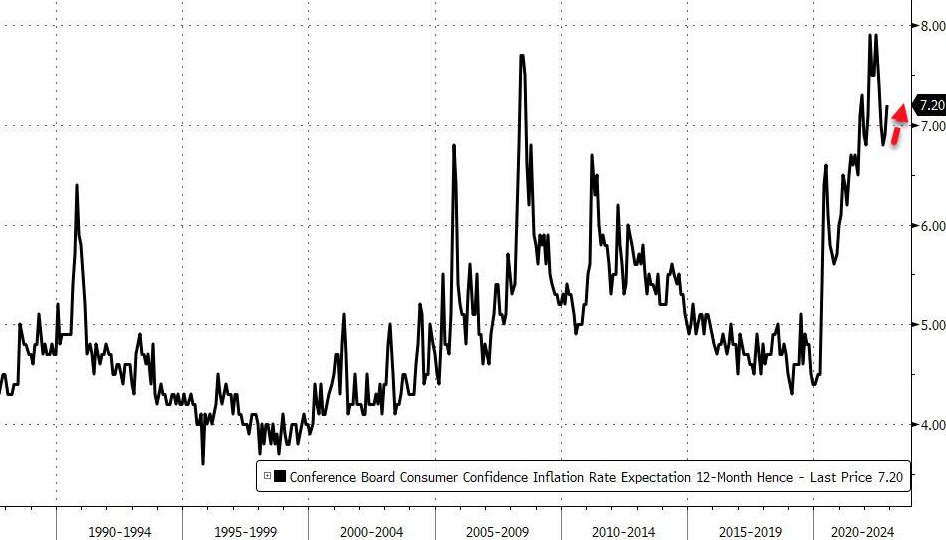
Likewise, since investors have the propensity to over-extrapolate short-term trends, their belief that inflation is no longer problematic is shortsighted. For example, the Conference Board released its Consumer Confidence Survey on Nov. 29. The headline index decreased from 102.2 in October to 100.2 in November.
Yet, the report stated:
“45.8% of consumers said jobs were ‘plentiful,’ up from 44.8%.”
More importantly:
“Inflation expectations increased to their highest level since July, with both gas and food prices as the main culprits.”
Thus, while overall confidence remains weak, the metrics that drive the Fed’s dual mandate continue to head in the wrong direction; and while investors assume that a dovish 180 will make all of the financial market’s problems disappear, the reality is that a patient Powell will only make a bad situation worse.
Please see below:
 Source: Bloomberg/ZeroHedge
To explain, the black line above tracks the 12-month inflation expectations derived from The Conference Board’s survey; and while the metric has come down from its all-time high, tighter financial conditions are necessary to prevent further upward pressure.
Therefore, the medium-term outlooks are bullish for the U.S. federal funds rate (FFR), real yields and the USD Index, and a realization is bearish for gold. So, while the price action suggests otherwise, don’t be surprised if sentiment shifts dramatically in 2023.
Will Silver Slide Sooner or Later?
Teaser:
While the silver price continues to consolidate, and seasonality keeps hope alive, 2022’s ills are far from cured.
Article:
While I warned throughout 2021 and 2022 that inflation, employment, consumer spending and growth would light a fire under the FFR, interest rates have increased sharply. Moreover, while the crowd expects a dovish pivot, the narrative materially contrasts the data.
Please see below:
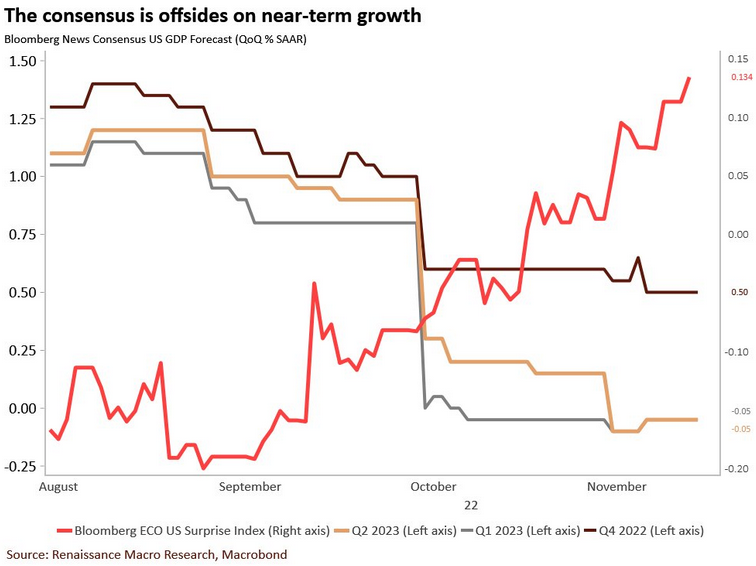
To explain, the dark brown line above tracks economists’ consensus GDP growth estimate for the fourth quarter, while the gray and light brown lines above track the consensus projections for Q1 and Q2 2023.
However, the red line above tracks the Bloomberg U.S. Economic Surprise Index. For context, a ‘surprise’ occurs when a data point outperforms the consensus estimate. If you analyze the red line’s ascent, you can see that resilient economic data has been present for the last few months.
So, while I warned that a dovish pivot requires a collapse in growth, inflation and the U.S. labor market, that scenario is far from the current environment. Consequently, the investors bidding up the silver price will likely suffer profound disappointment as the Fed keeps pushing the FFR higher.
To that point, silver is more cyclical than gold, so it has a higher sensitivity to the U.S. business cycle. In addition, silver and mining stocks are more volatile than gold, and they often suffer mightily when the S&P 500 exhibits weakness. As such, with the fundamental backdrop contrasting the conditions that support stock market bottoms, the S&P 500’s plight could weigh heavily on the silver price in the months ahead.
For example, Bridgewater Associates is the largest hedge fund in the world. Co-Head of Equities Research Erin Miles wrote on Nov. 11:
“The equity bottom typically does not come until 1) there is a meaningful period of easing sufficient to offset the negative economic momentum, and 2) equity prices fall enough that investors are incentivized to move back out the risk curve and buy stocks.
“The former typically means that central banks assess that the slowdown in economic activity has been large enough to bring inflation back under control. And the latter means equities typically decline much more than justified by higher interest rates, resulting in valuations that are low enough to draw investors back in.
“When we look at conditions today, the typical markers of an equity market bottom are not yet present.”
Please see below:
 Source: Bridgewater Associates
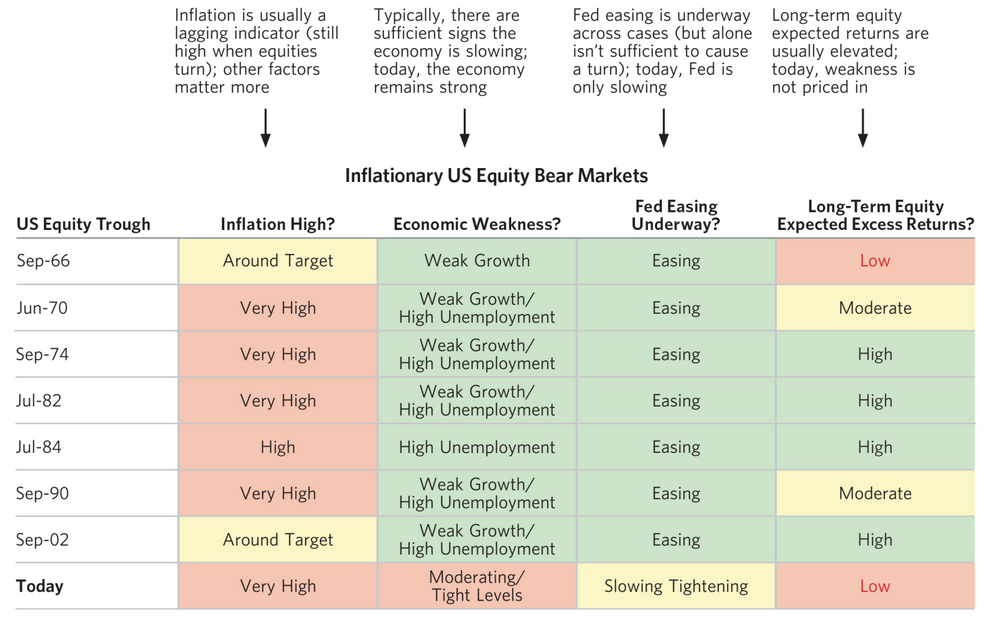
To explain, the heat map above contrasts the fundamental conditions present during historical stock market bottoms with today's conditions. If you analyze the first several rows, you can see that high inflation is often present, combined with weak growth, high unemployment and the Fed cutting interest rates.
Conversely, the bottom row highlights how today's environment has high inflation, moderate growth, low unemployment and a Fed that's still raising interest rates. As a result, few of the boxes are checked, and I've warned on numerous occasions that bear markets don't end with the unemployment rate at a ~50-year low.
Furthermore, the report added:
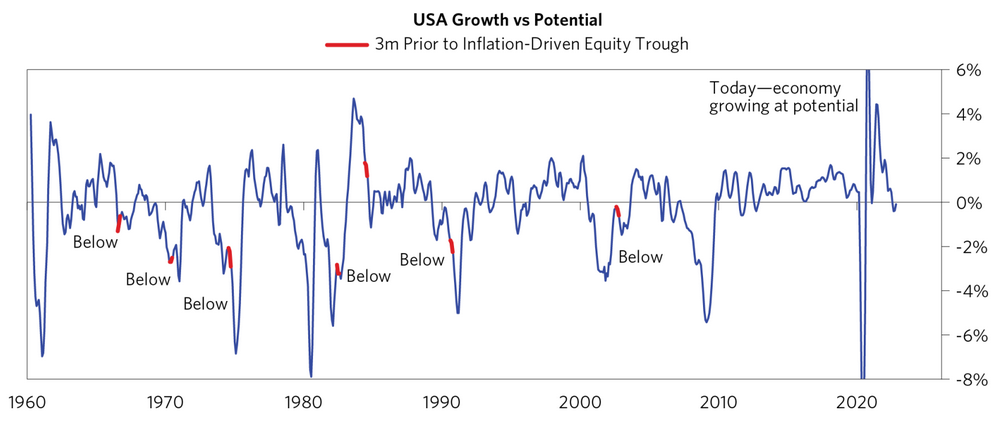
“Growth is typically below potential going into inflation-driven equity market troughs, as the Fed usually needs to see weak conditions to ease and turn the market. The main exception was 1984.”
Please see below:
 Source: Bridgewater Associates
To explain, the red markers above show how outside of 1984, U.S. GDP growth tracks below potential three months before the stock market bottoms. However, the right side of the chart shows how the blue line remains near neutral. Thus, the stock market hasn’t reconciled the demand destruction that often unfolds before a long-term low is achieved.
Also noteworthy, valuation is an important driver of stock prices over the long term; and with the S&P 500’s price-to-sales (P/S) ratio still near its dot-com bubble high, the current reading is nowhere near recent stock market bottoms.
Please see below:
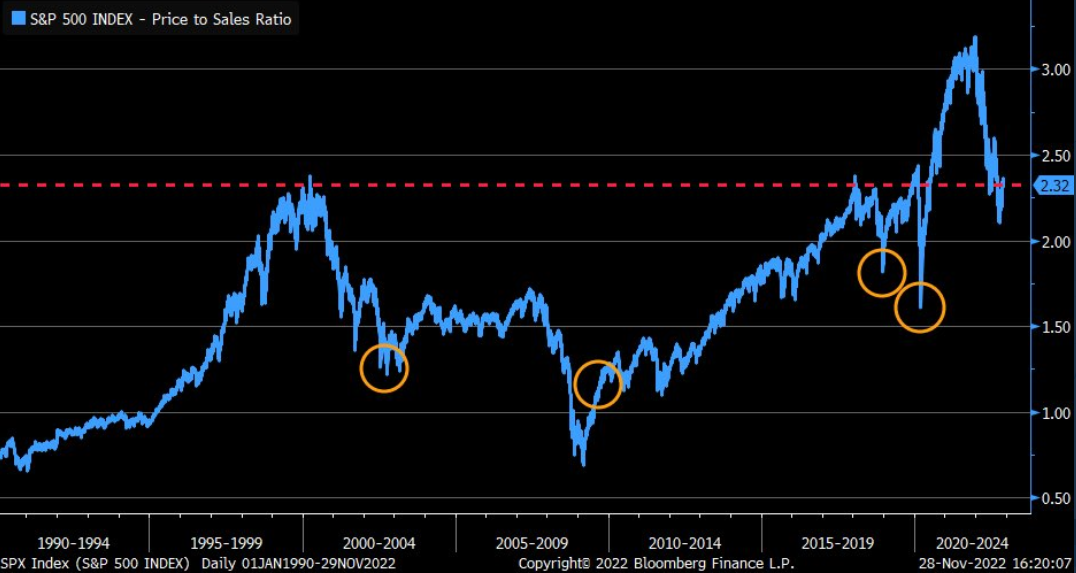
To explain, the blue line above tracks the S&P 500’s P/S ratio. If you analyze the horizontal red line, you can see that the current reading of 2.32 is far from cheap.
More importantly, the orange circles highlight how troughs in 2020, 2018, 2009 and 2002 occurred with the metric below 2 and 1.5; and while the bulls are not fans of data, the numbers suggest this bear market still has plenty of room to run.
Overall, while the silver price remains elevated, the bullish seasonal period has investors overlooking the ominous outcomes that proceed abnormally high inflation and abnormally low unemployment; and while sentiment can keep the S&P 500 and the white metal levitated in the short term, the downside could be immense when the momentum reverses.
Mixed PMIs
The Fed's regional PMIs are valuable because they're like puzzle pieces that create the fundamental whole. So, while mixed results were present recently, they have not been sharp enough to support a dovish pivot.
For example, the Richmond Fed released its Fifth District Survey of Manufacturing Activity on Nov. 22. The headline index increased from -10 in October to -9 in November, and the employment index was roughly flat. The report stated:
“The wage index decreased notably from 34 to 25 in November but remained elevated.”
Furthermore:
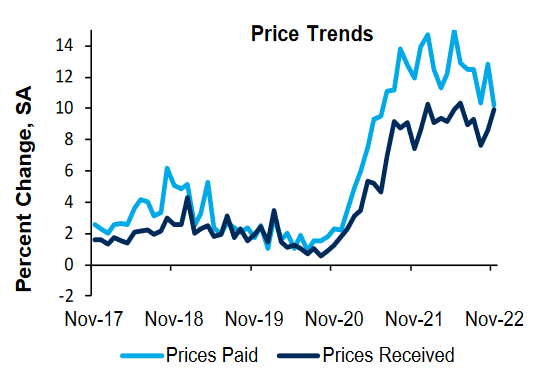
“The average growth rate of prices paid decreased in November, while the average growth rate of prices received increased somewhat. Expectations for prices paid over the next 12 months decreased slightly since last month, while expectations for prices received increased slightly.”
As a result, the modest rise in output prices highlights why the Fed is far from achieving its 2% inflation goal.
Please see below:
 Source: Richmond Fed
Also, the Dallas Fed released its Texas Manufacturing Outlook Survey on Nov. 28. The headline index increased from -19.4 in October to -14.4 in November, and the report stated that “labor market measures pointed to slower employment growth and stable hours worked,” while “price growth eased, while wage growth remained elevated.”
In addition, the Dallas Fed’s Texas Service Sector Outlook Survey (released on Nov. 29) showed the headline index increased from -13.6 to -11, and an excerpt read:
“Labor market indicators suggested continued growth in employment and hours worked in November,” and “growth in selling and input prices continued to moderate in November, while wage pressures picked up slightly.”
Thus, there is no smoking gun. However, with this month’s “special questions” providing some interesting insights, they showcased why the Fed’s inflation fight will be one of attrition. For context, manufacturing, service sector and retail firms are included in the results.
Please see below:
 Source: Dallas Fed
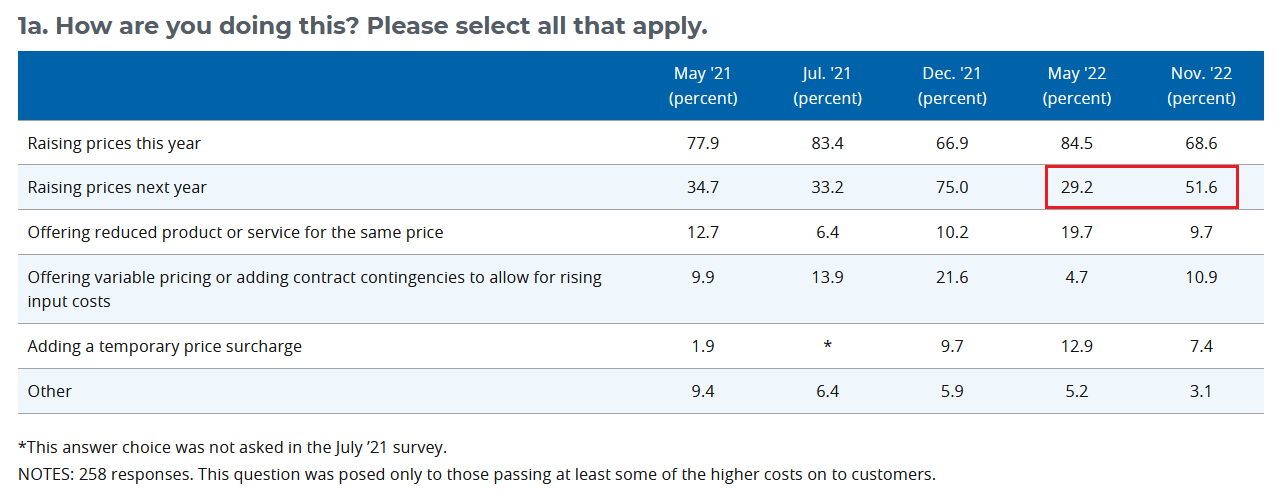
To explain, when asked about how firms plan to deal with the higher input costs and wages, more than 50% of respondents said they plan to increase their output prices in 2023. Plus, the figure is much higher than the ~29% recorded in May.
Likewise, the row above shows that ~69% of Dallas firms still plan to raise prices this year. As a result, an inflationary mindset is hard to break, and a dovish pivot would only enhance businesses’ reaction function.
So, while the pricing pressures have eased somewhat, the Fed is still a long way from solving its inflation conundrum.
The Bottom Line
While gold, silver, mining stocks and the S&P 500 continue to prioritize seasonality, the medium-term technicals and fundamentals are profoundly bearish. Moreover, while the crowd hopes that Powell will throw them a bullish bone, 2021 and 2022 have shown that his words have no bearing on the fundamentals.
Consequently, while investors assume that he can eliminate inflation and orchestrate a soft landing by waving a magic wand, the reality is that no Fed committee since 1954 has achieved what the consensus assumes he will. Therefore, while a lack of short-term bearish catalysts are seen as bullish, plenty of ‘surprises’ should unfold in the months ahead.
In conclusion, the PMs rallied on Nov. 29, as the USD Index and the U.S. 10-Year real yield continue their consolidations. But, with the pair poised to seek higher ground over the medium term, the fundamentals should showcase their might as this bear market evolves. As such, we believe that gold, silver, mining stocks and the S&P 500 have not seen their final lows.
Overview of the Upcoming Part of the Decline
- It seems to me that the corrective upswing is over (or about to be over) and that the next big move lower is already underway (or that it’s about to start).
- If we see a situation where miners slide in a meaningful and volatile way while silver doesn’t (it just declines moderately), I plan to – once again – switch from short positions in miners to short positions in silver. At this time, it’s too early to say at what price levels this could take place and if we get this kind of opportunity at all – perhaps with gold prices close to $1,500 - $1,550.
- I plan to switch from the short positions in junior mining stocks or silver (whichever I’ll have at that moment) to long positions in junior mining stocks when gold / mining stocks move to their 2020 lows (approximately). While I’m probably not going to write about it at this stage yet, this is when some investors might consider getting back in with their long-term investing capital (or perhaps 1/3 or 1/2 thereof).
- I plan to return to short positions in junior mining stocks after a rebound – and the rebound could take gold from about $1,450 to about $1,550, and it could take the GDXJ from about $20 to about $24. In other words, I’m currently planning to go long when GDXJ is close to $20 (which might take place when gold is close to $1,450), and I’m planning to exit this long position and re-enter the short position once we see a corrective rally to $24 in the GDXJ (which might take place when gold is close to $1,550).
- I plan to exit all remaining short positions once gold shows substantial strength relative to the USD Index while the latter is still rallying. This may be the case with gold prices close to $1,400 and GDXJ close to $15 . This moment (when gold performs very strongly against the rallying USD and miners are strong relative to gold after its substantial decline) is likely to be the best entry point for long-term investments, in my view. This can also happen with gold close to $1,400, but at the moment it’s too early to say with certainty.
- The above is based on the information available today, and it might change in the following days/weeks.
You will find my general overview of the outlook for gold on the chart below:

Please note that the above timing details are relatively broad and “for general overview only” – so that you know more or less what I think and how volatile I think the moves are likely to be – on an approximate basis. These time targets are not binding nor clear enough for me to think that they should be used for purchasing options, warrants, or similar instruments.
Summary
Summing up, last week’s shooting star reversal candlestick in gold already resulted in lower gold prices, and as Bitcoin forms its short-term bottom, the big decline in the precious metals sector (especially in junior mining stocks) is likely to resume.
I would like to take this opportunity to congratulate you on your patience with this trade (and I’m grateful for your understanding that not every corrective upswing can be “caught” in trading terms). Many investors and traders panic and get out of the market exactly at the wrong time, but your patience and self-discipline mean that you’re poised to make the most of what the market brings us this and next year.
Moving back to the market, it appears to be yet another time when the markets are incorrectly expecting the Fed to make a dovish U-turn, and based on this, the part of the 2008 decline where we saw the biggest corrective upswing materialized.
In my opinion, the current trading position is going to become profitable in the following weeks, and quite possibly in the following days. And while I can’t promise any kind of performance, I fully expect it to become very profitable before it’s over and to prolong our 2022 winning streak.
After the final sell-off (that takes gold to about $1,350-$1,500), I expect the precious metals to rally significantly. The final part of the decline might take as little as 1-5 weeks, so it's important to stay alert to any changes.
To summarize:
Trading capital (supplementary part of the portfolio; our opinion): Full speculative short positions (300% of the full position) in junior mining stocks are justified from the risk to reward point of view with the following binding exit profit-take price levels:
Mining stocks (price levels for the GDXJ ETF): binding profit-take exit price: $20.32; stop-loss: none (the volatility is too big to justify a stop-loss order in case of this particular trade)
Alternatively, if one seeks leverage, we’re providing the binding profit-take levels for the JDST (2x leveraged). The binding profit-take level for the JDST: $27.87; stop-loss for the JDST: none (the volatility is too big to justify a SL order in case of this particular trade).
For-your-information targets (our opinion; we continue to think that mining stocks are the preferred way of taking advantage of the upcoming price move, but if for whatever reason one wants / has to use silver or gold for this trade, we are providing the details anyway.):
Silver futures downside profit-take exit price: $12.32
SLV profit-take exit price: $11.32
ZSL profit-take exit price: $74.87
Gold futures downside profit-take exit price: $1,504
HGD.TO – alternative (Canadian) 2x inverse leveraged gold stocks ETF – the upside profit-take exit price: $18.47
HZD.TO – alternative (Canadian) 2x inverse leveraged silver ETF – the upside profit-take exit price: $46.87
Long-term capital (core part of the portfolio; our opinion): No positions (in other words: cash)
Insurance capital (core part of the portfolio; our opinion): Full position
Whether you’ve already subscribed or not, we encourage you to find out how to make the most of our alerts and read our replies to the most common alert-and-gold-trading-related-questions.
Please note that we describe the situation for the day that the alert is posted in the trading section. In other words, if we are writing about a speculative position, it means that it is up-to-date on the day it was posted. We are also featuring the initial target prices to decide whether keeping a position on a given day is in tune with your approach (some moves are too small for medium-term traders, and some might appear too big for day-traders).
Additionally, you might want to read why our stop-loss orders are usually relatively far from the current price.
Please note that a full position doesn't mean using all of the capital for a given trade. You will find details on our thoughts on gold portfolio structuring in the Key Insights section on our website.
As a reminder - "initial target price" means exactly that - an "initial" one. It's not a price level at which we suggest closing positions. If this becomes the case (as it did in the previous trade), we will refer to these levels as levels of exit orders (exactly as we've done previously). Stop-loss levels, however, are naturally not "initial", but something that, in our opinion, might be entered as an order.
Since it is impossible to synchronize target prices and stop-loss levels for all the ETFs and ETNs with the main markets that we provide these levels for (gold, silver and mining stocks - the GDX ETF), the stop-loss levels and target prices for other ETNs and ETF (among other: UGL, GLL, AGQ, ZSL, NUGT, DUST, JNUG, JDST) are provided as supplementary, and not as "final". This means that if a stop-loss or a target level is reached for any of the "additional instruments" (GLL for instance), but not for the "main instrument" (gold in this case), we will view positions in both gold and GLL as still open and the stop-loss for GLL would have to be moved lower. On the other hand, if gold moves to a stop-loss level but GLL doesn't, then we will view both positions (in gold and GLL) as closed. In other words, since it's not possible to be 100% certain that each related instrument moves to a given level when the underlying instrument does, we can't provide levels that would be binding. The levels that we do provide are our best estimate of the levels that will correspond to the levels in the underlying assets, but it will be the underlying assets that one will need to focus on regarding the signs pointing to closing a given position or keeping it open. We might adjust the levels in the "additional instruments" without adjusting the levels in the "main instruments", which will simply mean that we have improved our estimation of these levels, not that we changed our outlook on the markets. We are already working on a tool that would update these levels daily for the most popular ETFs, ETNs and individual mining stocks.
Our preferred ways to invest in and to trade gold along with the reasoning can be found in the how to buy gold section. Furthermore, our preferred ETFs and ETNs can be found in our Gold & Silver ETF Ranking.
As a reminder, Gold & Silver Trading Alerts are posted before or on each trading day (we usually post them before the opening bell, but we don't promise doing that each day). If there's anything urgent, we will send you an additional small alert before posting the main one.
Thank you.
Przemyslaw K. Radomski, CFA
Founder, Editor-in-chief

